
Are you considering investing in Apple stock(AAPL) and looking for a clear picture of how the stock price trend is doing before you decide? This detailed AAPL price analysis will help you by showing the essential price levels, changes in momentum, and what key technical indicators are signaling in the latest trading session. Whether planning a quick trade or thinking long term, this breakdown will give you the insight you need to move confidently.
Apple (AAPL) Price Analysis of May 2, 2025
The Apple (AAPL) price action on a 5-minute chart over the past 24 hours highlights a strong early upward push followed by tight-range consolidation. In the opening hours between 13:30 UTC and 16:30 UTC, AAPL price rebounded sharply from a brief dip near $210, surging into a clean intraday uptrend. The stock formed higher lows within a steep ascending channel, confirming bullish control. A golden cross on the MACD confirmed the AAPL breakout structure, while the RSI moved steadily from neutral toward the overbought zone, indicating strong buyer demand. The session high was set at just under $214 before the price met clear resistance at that level, which was aligned with historical supply.

Chart 1- Analyzed by Alokkp0608, published on May 2nd, 2025.
Between 16:30 UTC and 19:30 UTC, the Apple stock attempted to break the $214 ceiling but failed, forming a minor double top pattern. RSI spiked into overbought near 75, triggering brief profit-taking. MACD shifted to a bearish alignment as a death cross formed, reinforcing the fading bullish momentum. Despite the rejection, AAPL price maintained relative strength and avoided falling back to the $210 support zone. Price entered a horizontal phase with declining volume, suggesting a battle between short-term bulls protecting gains and bears defending the resistance.
Tight Range Holds, Indicators Flatten, Minor Rebound into Close
Between 19:30 UTC and 20:00 UTC, AAPL price action tightened further. Apple stock held within a $212.50–$213.50 band. RSI remained mostly in mid-range, showing temporary equilibrium. MACD stayed muted, with minimal divergence between signal and MACD lines, suggesting market indecision. However, a sharp late spike re-tested the $214 resistance but failed again, resulting in a red candle into the close. This rejection occurred with RSI again tapping overbought, confirming the level’s significance. No new support breach was seen, which keeps buyers technically in play.
Post-market action (after 20:00 UTC) showed another quick upward spike breaching $214 momentarily. But it was swiftly reversed, and price pulled back toward $212.85. This brief overextension triggered another RSI overbought signal, but unlike earlier, there was no sustained bullish volume. The MACD histogram narrowed quickly, and the MACD lines remained close, suggesting fading momentum. Sellers used the opportunity to reject the AAPL breakout attempt, and AAPL closed weak near intraday midrange. Buyers failed to confirm a breakout, and the rally lacked broad participation.
AAPL Upside Stalls at Key Resistance, Decision Point Nearing
The AAPL price structure shows strength but also hesitation. Bulls pushed firmly early on, aided by golden crosses and a defined uptrend. However, repeated rejection at $214 confirms heavy resistance. The $210 support zone remains strong support. MACD and RSI now show a neutral to weakening momentum bias. If AAPL can reclaim and hold above $214 with volume, the next leg could aim for $216. Otherwise, failure to keep $212.50 may open the door to a pullback near $210. The stock is at a short-term decision point, where an AAPL breakout or a range breakdown will define the coming sessions.
Apple (AAPL) Price Analysis of May 28, 2025
The Apple stock price action over a regular trading session on a 1-minute chart opened at $198.35 and initially dipped to $197.50 by 13:41 UTC, forming a short-term support level. This early weakness also triggered a MACD death cross, reflecting bearish momentum. However, buyers stepped in quickly, reversing direction and lifting the stock above $198.50. RSI, which briefly approached oversold territory, started to climb, signaling renewed buying interest. By 15:04 UTC, the MACD flipped into a golden cross, strengthening the upward push. Apple broke through the $199 short-term resistance by 15:25 UTC, confirming a breakout and initiating a strong upward channel into the mid-session.
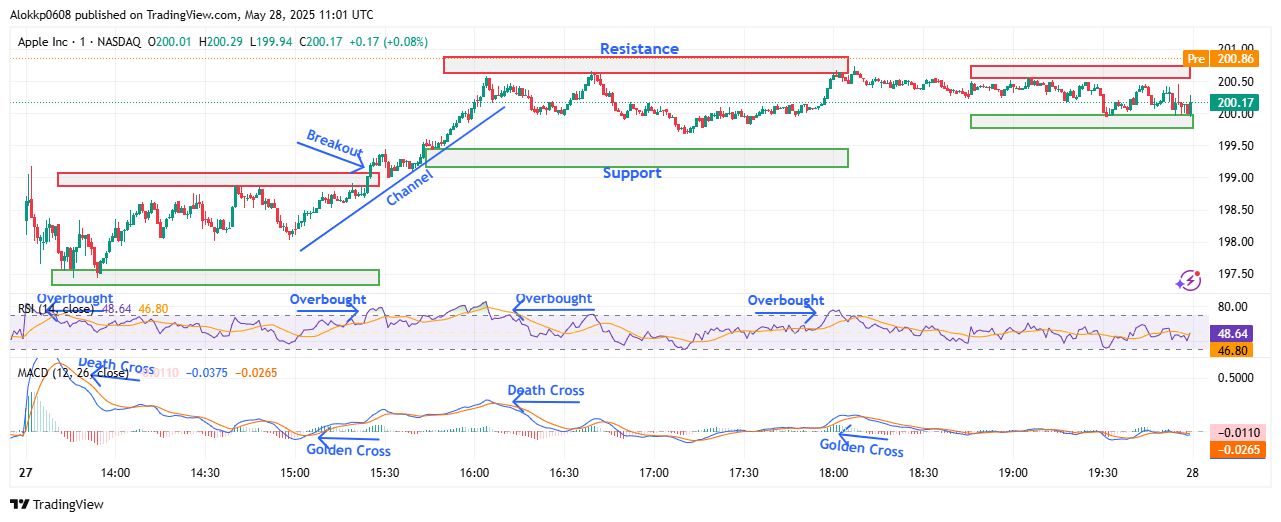
AAPL M-1 Chart Analyzed by Alokkp0608, published on May 28th, 2025.
The AAPL breakout gathered steam as prices rallied past $200, reaching an intraday high of $200.55 by 16:04 UTC. This zone near $200.65 acted as interim resistance, with price momentum briefly stalling. RSI moved into the overbought zone, while MACD momentum began to slow. A MACD death cross occurred around 16:07 UTC, which aligned with the price starting to retreat. Despite another attempt to breach the $200.55 resistance by 16:40 UTC, the move was rejected again. The failure to break higher introduced consolidation pressure, and the upward channel started to flatten, hinting at buyer exhaustion.
AAPL Breakout Fades into Sideways Range
Between 17:00 UTC and 18:00 UTC, AAPL price entered a sideways phase, drifting just below resistance while holding above the newly formed support at $199.50. Momentum was mixed, with RSI dropping out of the overbought zone but remaining steady around the mid-50s. Sellers lacked conviction, but buyers were hesitant. A new golden cross on the MACD appeared around 17:55 UTC, yet price movement remained capped under $200.55. This highlighted weakening follow-through on the bullish trend despite technical cues favoring further gains.
Flat Close Confirms Short-Term Market Indecision
From 18:00 UTC to market close, AAPL price maintained a tight trading range between $199.95 and $200.55. Price hugged this band with minimal breakout attempts, as RSI hovered sideways just under the 50 mark. MACD showed flattening behavior, indicating neutral momentum. With both bulls and bears lacking dominance, the consolidation solidified into a narrow sideways pattern. The close at $200.17 reflected little net movement from the afternoon highs, locking the stock in a neutral technical zone heading into the next session.
Apple Price Holds Steady Under $200.65 Resistance
Apple stock closed the May 27 session at $200.17, gaining modest ground after a solid intraday breakout and subsequent consolidation. The momentum is currently neutral, with price trapped below the $200.65 resistance and above the $199.50 support. A sustained breakout above $200.65 could reopen the path toward $201.50, while failure to hold $199.50 may invite a dip back toward $198.70. The RSI is steady near the mid-range, not hinting at directional pressure. Meanwhile, the MACD is in a golden cross but losing steam, reflecting cautious optimism. If momentum rebuilds and volume picks up, bulls may retest recent highs soon. The consolidation base around $199.95 will be key for bulls to defend in the upcoming session.
Apple (AAPL) Price Analysis of June 13th, 2025
The AAPL price action during the last regular session started slightly higher at $199.09 compared to the previous day’s close of $198.82. Right from the open at 13:30 UTC, the stock entered a downtrend channel, quickly dipping to test an interim support near $197.50 by 14:06 UTC. However, a reversal took place immediately afterward, backed by a golden cross on the MACD and a bounce from RSI’s oversold region. The price rebounded sharply toward $198.85 but was rejected at that interim resistance around 15:08 UTC. Although the rally faltered, the price found a higher low at $197.78, indicating early attempts by buyers to regain control, with RSI gradually climbing and MACD showing a brief pullback.
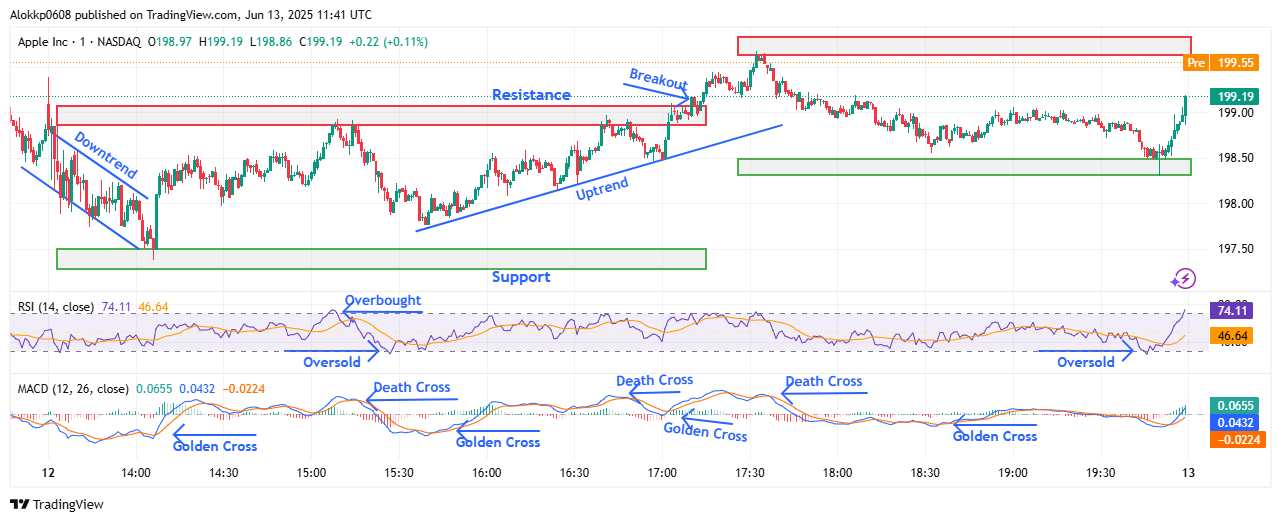
AAPL M-1 Chart Analyzed by Alokkp0608, published on June 13th, 2025.
From 15:40 UTC onward, the Apple stock entered a steady uptrend, carving out higher lows and breaking through $198.85 resistance by 17:10 UTC. This bullish leg was supported by a golden cross and a steady RSI push toward the 60s. Momentum carried AAPL up to $199.65, which became a new short-term resistance level. Despite some hesitation near that level at 17:32 UTC, bulls briefly retained control. However, a death cross on the MACD around 17:35 UTC and RSI peaking near overbought levels signaled cooling momentum. This marked the end of the uptrend and the beginning of renewed selling pressure.
Intraday Pullback Shakes Bulls Before Late Recovery
As the session entered its final leg, the AAPL price dropped from the $199.65 high and moved into another downtrend by 17:35 UTC. Sellers pushed the stock to an intraday low near $198.56 by 18:32 UTC. This weakness was accompanied by a weakening MACD momentum and a soft RSI retreat into the mid-40s, suggesting lackluster buying interest. AAPL then moved sideways in a tight consolidation band just above the short-term support zone around $198.50. Despite multiple death crosses on the MACD earlier, the RSI held firm above the oversold zone, hinting at waning bearish strength.
A notable shift came just before the session’s end. Around 19:50 UTC, the stock hit the support again but bounced sharply, posting a quick spike in price and momentum. MACD showed a final golden cross by 18:38 UTC, and RSI surged into the 70s, confirming strong end-of-day buying. The session closed at $199.19, nearly reclaiming the day’s opening level and reversing much of the earlier decline. Buyers reasserted some control but stopped short of breaking through the earlier $199.65 high.
End-of-Day Rebound Sets Bullish Tone Near $199.65
Apple stock wrapped the June 12 session with a mild gain, closing at $199.19 after bouncing strongly from the $198.50 support near the close. Momentum appears cautiously bullish heading into the next session. The sharp end-of-day recovery suggests buyers are not yet done testing the $199.65 resistance, which remains the key level to watch on the upside. On the downside, short-term support is firm at $198.50, and a break below that could drag the price back toward $197.50. RSI is back in the overbought region, hinting at temporary exhaustion, while MACD’s golden cross and upward slope support continued bullish interest. As long as AAPL holds above $198.85, bulls have a chance to retest the $199.65–$199.90 range soon.
Apple (AAPL) Price Analysis of June 24th, 2025
The AAPL price action over the recent regular trading session kicked off at $201.60 with a quick dip to the $200 support zone by 13:35 UTC. This initial pullback found support at the short-term lower bound, prompting a swift bounce back. Prices climbed steadily, testing the resistance level near $202 by 14:09 UTC before being rejected. The rejection marked the start of a steady downtrend as sellers gained momentum. RSI began slipping toward the oversold range during this period, signaling increasing selling pressure. Meanwhile, the MACD confirmed the shift with a death cross near the same time, reinforcing bearish sentiment and setting up the breakdown that followed.
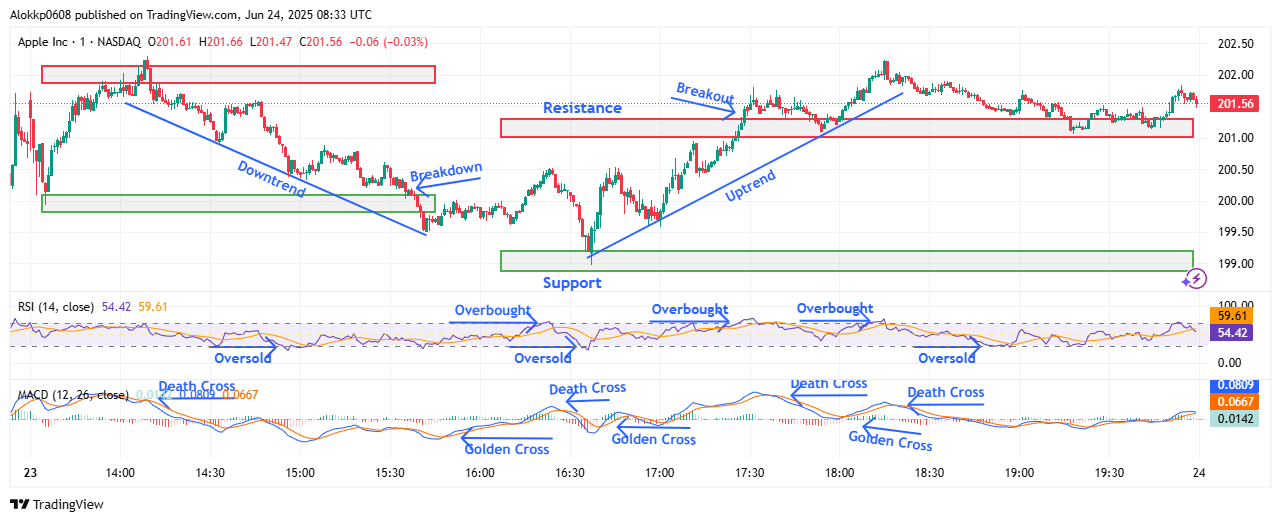
AAPL M-1 Chart Analyzed by Alokkp0608, published on June 24th, 2025.
The breakdown below $200 occurred by 15:39 UTC, with Apple stock prices hitting a session low of $199.50 just minutes later. However, buyers stepped in quickly, lifting the price back to $200.50 by 16:24 UTC before another dip set in. This lower high suggested hesitation from bulls, and the MACD responded with a death cross around 16:26 UTC, showing weakening momentum again. New short-term support and resistance levels formed at $199.20 and $201.20, respectively, and once again, the price tested support successfully. MACD flipped bullish with a golden cross at 16:40 UTC, supporting the shift into an uptrend.
Breakout Momentum Cools as Sellers Re-Emerge
By 17:27 UTC, AAPL price broke out above the $201.20 interim resistance, rallying up to $201.80 by 17:31 UTC and then extending to the session high of $202.22 by 18:15 UTC. This late-session strength confirmed bullish intent, further supported by a golden cross on the MACD at 18:01 UTC. RSI briefly entered the overbought zone during this run, suggesting overheated conditions. However, the upward move didn’t hold for long. Profit-taking or selling pressure re-emerged by 18:18 UTC, aligning with a fresh MACD death cross. The AAPL price dipped back to test the breakout zone near $201.20, which acted as support.
The final stretch of the session saw prices stabilizing above the $201.20 level with a sideways drift. The MACD remained weak with little expansion, hinting at fading momentum, while the RSI hovered just below the 60 mark, suggesting mild bullish bias but no strong continuation. Buyers managed to keep the price above both the opening level and key support, signaling confidence, but the loss of upward force warns of possible consolidation ahead if no fresh buying emerges.
Bulls Defend $201.20 as Momentum Slows Near $202 High
Apple Stock closed the June 23 session at $201.56, slightly below its opening at $201.60 but still holding well above the $200 psychological support. While the breakout above $201.20 showcased bullish intent, the inability to sustain above $202.20 suggests caution is returning. Momentum has started to fade, with the MACD ending on a weakening note and the RSI settling in the mid-50s, indicating neutral to slightly bullish conditions. If buyers regain strength, a retest of $202.20 is possible, with further upside targeting $203. Short-term support rests at $201.20, and stronger support remains at $200. Below that, $199.20 could see defensive buying. However, a break below $200 may shift momentum back to the bears. This outlook covers the June 23 session from 13:30 UTC to 20:00 UTC.
Apple (AAPL) Price Analysis of May 28th, 2025
Apple stock’s recent price action over the regular US session opened at $201.88 and dipped slightly to test short-term support near $202 by 13:40 UTC. That early weakness coincided with a bearish MACD death cross and a brief RSI retreat from overbought territory. Prices bounced quickly from the dip and approached resistance at $203 but failed to break through, peaking around 13:54 UTC. This rejection triggered a clear downtrend, with the stock sliding below support at 14:17 UTC and hitting a low of $201.04 by 14:33 UTC. Shortly after, a golden cross on MACD signaled recovery, and AAPL rose toward $201.93 by 14:40 UTC before facing renewed pressure near $202.

AAPL M-1 Chart Analyzed by Alokkp0608, published on June 28th, 2025.
AAPL Prices failed to regain their previous strength and slipped again to the revised short-term support at $201 by 15:02 UTC. This time, a new uptrend took shape around 15:03 UTC, lifting the stock into a stronger zone. The breakout above $202 resistance around 16:54 UTC was brief but notable, with AAPL hitting an intraday high of $202.70 by 17:14 UTC. During this period, RSI climbed into overbought territory again, reflecting bullish momentum. However, another MACD death cross and rejection near resistance by 17:17 UTC brought back selling interest and marked the beginning of another downtrend.
Failed Rally Reverts to Tight Range Between $200.65 and $201.50
After peaking near $202.70, AAPL price began a steady descent, breaking below support and slipping into a consolidation pattern around $201. From 17:30 to 18:35 UTC, the stock hovered between $201 and $201.60. MACD momentum weakened visibly, while RSI dipped toward oversold levels, confirming the cooling sentiment. Around 18:40 UTC, the price briefly dipped again, this time entering a new lower range with $200.65 as short-term support and $201.50 as resistance. Buyers defended the lower band, but strength was lacking, as AAPL moved sideways without any real recovery.
The final hour of trading saw low volatility and indecision as AAPL oscillated between $200.90 and $201.40. Despite a golden cross on MACD around 17:50 UTC, the broader trend stayed soft due to the absence of follow-through buying. RSI hovered in the 40s, showing no urgency from bulls or bears. While the $200.65 support held firm, attempts to reclaim $201.50 lacked momentum. Price action reflected a tired market settling into end-of-day consolidation, with no strong directional resolution before the close.
Downward Momentum Stalls, but Bulls Yet to Regain Control
Apple stock price closed the session nearly flat at $201.04 after opening at $201.88, underscoring a failed rally and fragile buyer strength. The short-term momentum leans neutral to bearish, with resistance now firmly established near $202 and $203. On the downside, support at $200.65 remains critical; a breakdown below that could invite further weakness toward $199.80.
RSI has settled into a mid-range band near 43, suggesting neither buyers nor sellers have a clear upper hand. Meanwhile, the MACD shows signs of instability with multiple conflicting signals, hinting at choppy momentum. If AAPL can hold above $201.00 early next session, a mild recovery toward $202.20 is possible. However, conviction remains low unless RSI climbs back toward the 60s and MACD enters a bullish expansion phase.