

Are you tracking AAVE’s price movements amid today’s volatility? The AAVE price analysis for May 27, 2025, shows a day marked by sharp swings and momentum-driven shifts within tight trading channels. Starting with a steady decline from $270.80 to a low near $266.40, AAVE found solid support before staging a key breakout around $266.80. This pushed the token to $273.80, its strongest rally of the day. Yet, exhaustion signs soon led to a pullback to $271.07. Throughout this turbulent session, momentum indicators like MACD and RSI played a critical role in signaling reversals and guiding traders. This price action underscores the need to watch momentum and key support and resistance levels when analyzing AAVE’s near-term trends.
AAVE Price Analysis For May 27, 2025
The AAVE price analysis over the last 24 hours shows a clean mix of ups and downs, guided by tight channels and momentum shifts. The day started with a steady downtrend, then shifted into multiple sharp recoveries. Momentum indicators gave early warnings before each reversal, keeping traders vulnerable. During the trading day, AAVE traded inside a downward channel, slowly sliding from $270.80 to $266.40 by 01:15 UTC. During this drop, RSI entered oversold territory twice, around 00:30 UTC and 01:10 UTC. The MACD showed a golden cross before 01:00 UTC, suggesting the first bullish pressure of the day. This was confirmed by a small AAVE breakout at 01:30 UTC as the AAVE token bounced to $268.30.

Chart 1- AAVE/USDT M1 Chart, Analysed By Anushri Varshney, Published on TradingView, May 27, 2025
By 02:15 UTC, the price consolidated briefly near $267. MACD gave another golden cross around 02:30 UTC, and the RSI started recovering. These signals played out well as AAVE entered a fresh upward channel. From 02:45 to 03:30 UTC, the AAVE price climbed toward $270.50, showing steady strength.
AAVE’s $266.80 Breakout and Pullback to $271.07
But by 03:45 UTC, the uptrend lost steam. A downward channel formed again, and AAVE fell back to $266.70 by 04:15 UTC. MACD confirmed the weakness with a death cross at 04:00, and RSI touched oversold again. This zone, near $266, acted as strong support throughout the day. At 04:30 UTC, another bullish swing started. A clear upward channel formed and continued through the next hour.
The AAVE token rose sharply from $266.80 to $273.80 by 05:45 UTC. This was the strongest move of the day. MACD showed multiple golden crosses, and RSI hit overbought near 05:30. This upward run was the day’s key AAVE breakout. After that, signs of exhaustion appeared. From 06:00 UTC, the price pulled back slightly, dipping to $271.20. MACD issued a final death cross around 06:20 UTC, and RSI dropped out of the overbought zone. As of the latest candle, AAVE trades at $271.07, holding steady after a volatile run.
AAVE Price Holds Ground After Volatile Day
AAVE made its major breakouts around $266.80, where there was substantial momentum before subsequently probing the rally higher at around $273.80; however, exhaustion and reversal were followed by a pullback. Nevertheless, AAVE prices remained firm support around the $266.40 price level, supporting further declines below these levels.
The AAVE token may go through some consolidation, as the momentum driving prices higher is starting to cool off. Nevertheless, if AAVE does break out strongly above this resistance noted at the $274 price level, there could be a larger trending rally. Regardless of the outcome that follows, consider if you are trading or holding AAVE, the AAVE price has demonstrated the influence the momentum indicators had on tracking the price activity, whilst simultaneously illustrating the importance of key zones of support and resistance as it relates to establishing short-term trends for AAVE.
AAVE Price Analysis For June 7, 2025
The AAVE price analysis shows a clear sequence of trends, breakouts, and well-defined indicators. The session opened near $253.90 with the AAVE token trading sideways until 00:30 UTC. Early action was quiet, but that changed quickly. From 00:30 to 01:30 UTC, the AAVE Price dropped sharply inside a clean downward channel, sliding from $253.80 to $251.90. RSI dipped into oversold, and MACD printed a golden cross near 01:40 UTC, hinting at a possible reversal. Between 01:40 and 02:30 UTC, the first strong AAVE Breakout took shape. Price climbed from $251.90 to $254.30 in a steep uptrend. RSI moved out of oversold and touched overbought, while MACD momentum turned bullish with a fresh golden cross.
By 02:30 UTC, the uptrend slowed. The AAVE token moved into a range-bound phase between $253.80 and $254.50. This sideways trading continued until 04:00 UTC. MACD flipped briefly with a death cross at 03:30 UTC, but a golden cross near 04:00 UTC helped maintain stability. From 04:00 to 05:30 UTC, the second strong move began. The AAVE price pushed from $254.00 to $255.20 in another short-lived uptrend. RSI crossed into overbought again, and MACD showed bullish strength. This marked the session high.
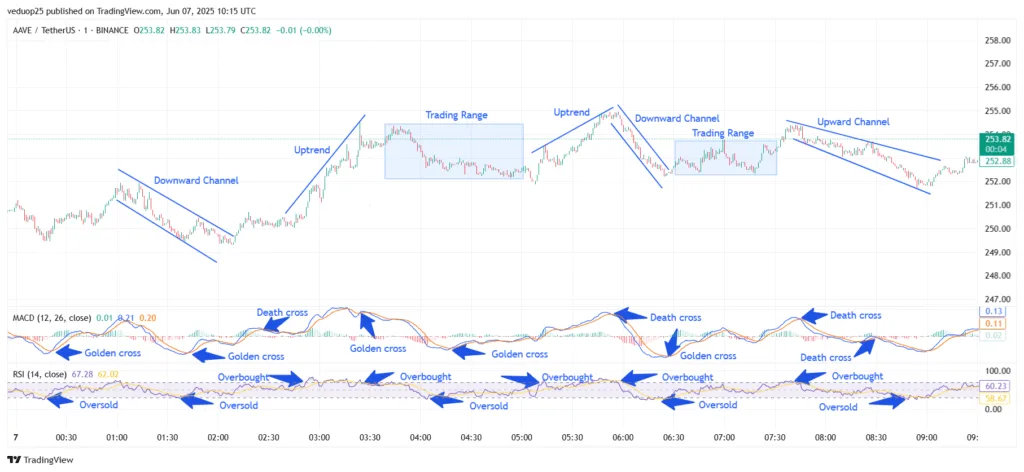
Chart 2- AAVE/USDT M1 Chart, Analysed By Anushri Varshney, Published on TradingView, June 7, 2025
Right after 05:30 UTC, sellers stepped in. A strong downward channel formed from 05:40 to 06:30 UTC, pulling the price back down to $252.90. RSI dropped sharply to oversold levels. MACD also confirmed the shift with a sharp death cross.
AAVE Price Slides into Channel After Weak Rebound from $254.40 to $252.40
From 06:30 to 07:30 UTC, AAVE traded in a tight range between $252.80 and $253.50. MACD gave a minor golden cross, but RSI stayed flat near the 50 level, suggesting weak momentum. A new upward channel emerged from 07:30 to 08:30 UTC. The AAVE price slowly climbed to $254.40 but couldn’t hold the level. MACD turned bearish again by 08:15 UTC, and RSI slipped below 50. In the final session from 08:30 to 10:00 UTC, the AAVE token dropped inside a wide descending channel, reaching a low near $252.40. A final golden cross showed up just before 09:00 UTC. Price recovered slightly and closed near $253.82.
AAVE Token Holds Structure Amid Volatility
The AAVE price showed a well-defined technical pattern throughout the session, despite intraday volatility. The day opened with a sharp drop, but a quick AAVE breakout reversed the trend, pushing price into higher zones. However, resistance near $255.20 capped gains, leading to a steady downward channel. RSI signals alternated between overbought and oversold across key phases, showing how reactive the market was to short-term moves. The AAVE token spent time in three trading zones, separated by clean directional shifts and supported by clear indicator behavior. Even during minor drops, the technical structure remained intact.
By the close, AAVE price hovered near $253.82, almost flat for the day but technically rich in movement. If the final golden cross holds, a short-term push may follow. Overall, AAVE remained range-bound but displayed a healthy intraday rhythm supported by reliable indicators.
AAVE Price Analysis For July 10, 2025
The AAVE price analysis highlights repeated trend shifts, momentum reversals, and periods of tight consolidation, all playing out within a structured range. The session began with a strong sell-off as the AAVE price slipped into a downward channel between 00:00 and 00:45 UTC. This early weakness was confirmed by a falling RSI that entered oversold territory, while MACD stayed bearish. A golden cross appeared around 00:50 UTC, triggering a sharp recovery. From 01:00 to 01:45 UTC, price reversed into an upward channel, pushing AAVE back above $296. RSI rose and briefly touched the overbought zone by 02:10 UTC.
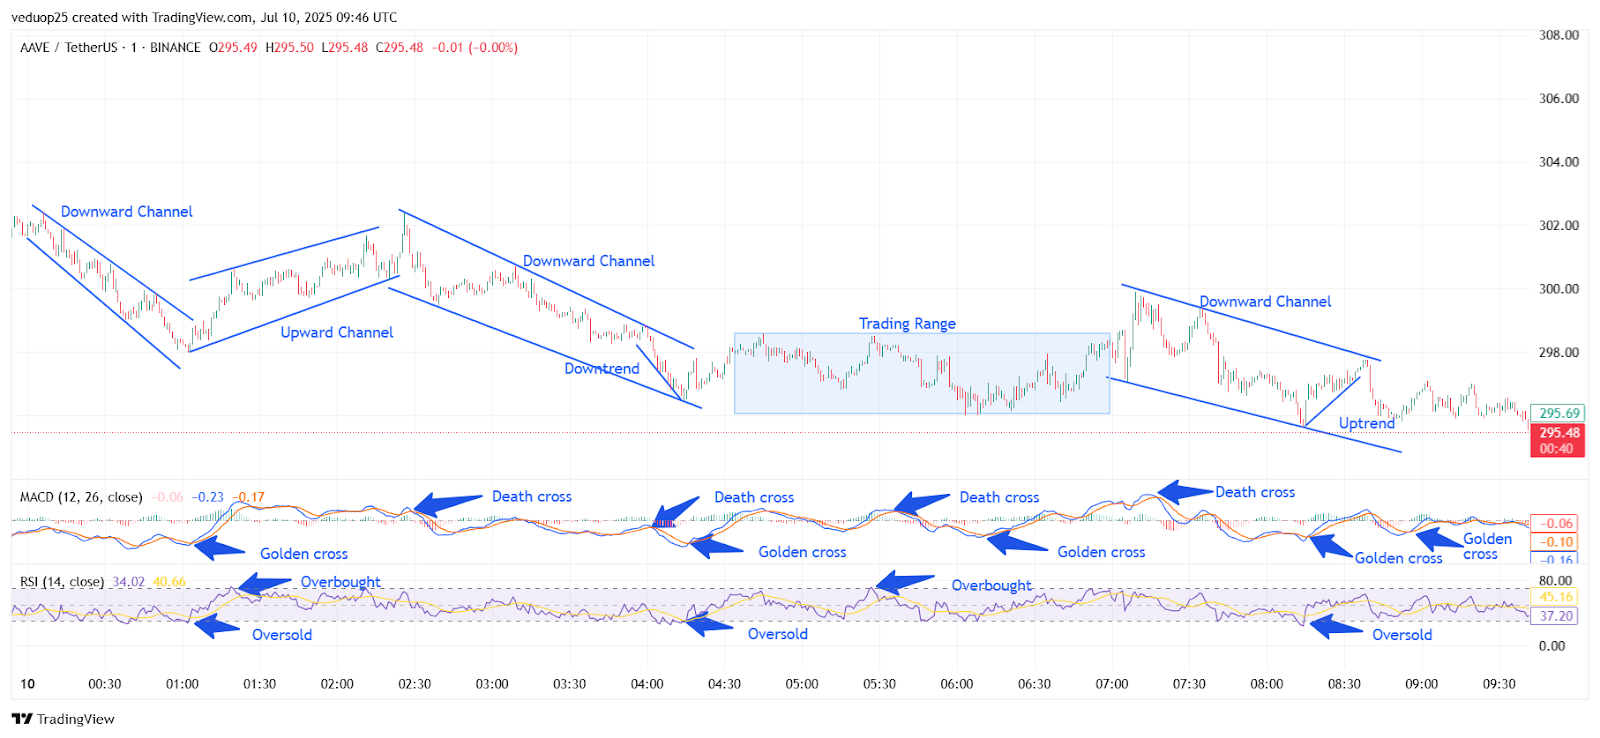
Chart 3- AAVE/USDT M1 Chart, Analysed By Anushri Varshney, Published on TradingView, July 10, 2025
The uptrend lost steam shortly after. Around 02:30 UTC, a death cross on the MACD indicated to us that a new downward channel was beginning. The AAVE token went into a steady decline from 02:30 to 03:30 UTC. Weak momentum followed as RSI continued to move lower, and the MACD generated persistent bearish signals. A minor bounce came near 03:45 UTC but was short-lived as another death cross followed quickly.
AAVE Slips Below $294 Before Short-Lived Rebound and Range Lock
From 04:00 to 05:30 UTC, price action consolidated into a narrow range of trading. In this period, RSI was neutral, and MACD had alternating golden crosses and death crosses, confirming low volatility. There was no clear breakout attempt during this range, and the AAVE price moved sideways between $295 and $297. A fresh breakdown came after 06:00 UTC as AAVE entered another downward channel. This bearish stretch lasted until 08:15 UTC, with lower highs and lower lows keeping bulls away. RSI fell back toward oversold levels, and multiple death crosses kept momentum negative.
The token bottomed near $294 before finally showing signs of reversal. At 08:30 UTC, a clean MACD golden cross and a bounce from oversold RSI kicked off a short uptrend. The AAVE token climbed back toward $296, supported by rising momentum. However, gains stalled after 09:00 UTC as the move lacked strong volume.
AAVE Struggles to Maintain Momentum After Repeated Selloffs
The price of AAVE experienced price instability in today’s session, as many upside and downside movements were noticeable with decent trends and clear momentum stirred. Following a first push to the price from the initial downward channel that saw the AAVE token start at early losses, there were short recoveries with the help of MACD golden crosses and bounces on the RSI. While we can appreciate a small uptrend around 08:30 UTC, the impulse the price found wanting never truly materialized into a proper bullish breakout.
More specifically, momentum indicators like the RSI and MACD traded largely neutral or bearish for the session, indicating poor impulsive buying support. A definitive AAVE breakout above the symbolic $297 level with confirmation from momentum indicators would change the current price arrangements. Conversely, until that stronger directional indicator occurs, AAVE remains beneath resistance with short-term bears slightly in control and buyers awaiting a greater directionality signal. Traders should watch for another MACD golden cross on the chart to confirm upside strength.


