

If you want to invest in or buy Algorand and wonder what the right price to start accumulating ALGO is, then you are at the right place. As we go through the analysis, we will determine different patterns and how ALGO reacts to them. We will also see support and resistance, which is a good area for any instrument to buy or sell. Without any further delay, let’s dive into Algorand price analysis and explore different opportunities arising from it.
Algorand Price Analysis of May 3, 2025
An expanding triangle appeared in the price of Algorand, which marked the high for the day at $0.2238. The expanding triangle pattern broke to the downside at 03:15 UTC, supported by a death cross of MACD. The ALGO price dipped to the downside and formed a downward-moving channel. The downward-moving channel broke out to the upside at 05:05 UTC, but the upside ALGO breakout failed, and the price formed a range. The range broke out to the downside at 06:40 UTC, supported by a death cross of MACD. Price dipped to the downside and formed a support zone at $0.2150 and a resistance area at $0.2170.

Chart 1: Analysed by vallijat007, published on TradingView, May 3, 2025
Price broke to the upside at 12:35 UTC, supported by a golden cross of MACD. Price spiked to the upside and formed an upward-moving channel, which is a traditional pattern for a strong trend. But the upward-moving channel broke out to the downside at 15:05 UTC, supported by a bearish signal, and formed another upward-moving channel. The upward-moving channel broke to the downside at 16:25 UTC, supported by the cross of MACD. Price dipped to the downside and formed an expanding triangle pattern.
ALGO’s Expanding Triangle Breakdown: How Low Can It Go?
That expanding triangle pattern broke out to the downside at 19:05 UTC, supported by the cross of the MACD. Price moved to the downside and formed a support area at $0.2130. In the meantime, at 19:45 UTC, RSI dropped below the level of 30, indicating oversold market conditions and suggesting a reversal or at least a pullback. A resistance zone developed at the level of $0.2160.
Price broke to the downside from the support area at 00:50 UTC, supported by a death cross of MACD. Price dipped to the downside and marked the low for the day at $0.2110. In the meantime, RSI again dropped below the level of 30, indicating oversold market conditions, suggesting a reversal or at least a pullback. If the ALGO breakout fails, then the price may rise to the level of $0.2160, and if the breakout succeeds, then the price may drop to the level of $0.2000.
Key Levels to Watch Before Accumulating ALGO
Algorand price is currently showing a high-frequency pattern of failed breakouts and brief trends, with price action largely confined to a tightening range. The $0.2130–$0.2160 zone has proven reactive, while the daily low at $0.2110 highlights strong bearish pressure. Repeated RSI dips below 30 signal potential reversal zones, but without strong follow-through, buyers remain cautious. If the ALGO price holds above $0.2110 and breaks $0.2160 with momentum, a short-term recovery could follow. However, a confirmed breakdown below $0.2110 could open the door to a deeper slide toward $0.2000. Traders should wait for confirmation before taking directional positions.
Algorand (ALGO) Price Analysis of May 7, 2025
The session marked the daily high at $0.2023. The market has a sharp decline to form a support of around $0.1950. At 08:15 UTC, the RSI dipped under 30, indicating oversold conditions and implying a possible reversal or at least a corrective bounce. When the Algorand support broke at 10:00 UTC, selling pressure picked up and was reinforced by a Death Cross on the MACD; this caused a sharp dip, lowest at $0.1909. Now, the ALGO price action is experiencing a brief consolidation phase, setting the stage for perhaps a recovery or continued weakness depending upon volume and breakout confirmation.

Chart 2: ALGO/USDT M5 Chart, Analysed by vallijat007, published on TradingView, May 7, 2025
Algorand marked the high for the day at $0.2023, and the price dropped to the downside, marking the support area at the level of $0.1950. In the meantime, at 08:15 UTC, the RSI dropped below the level of 30, indicating oversold market conditions and suggesting a potential reversal or at least a short-term pullback.
The support area broke to the downside at 10:00 UTC, supported by a Death Cross of the MACD. This bearish signal led to a sharp price spike to the downside, marking the low for the day at $0.1909. Following the drop, price action stabilized and formed a small range. This range broke out to the upside at 14:00 UTC, supported by a Golden Cross of the MACD. The ALGO price spiked upward but failed to establish a sustained trend or form a new channel structure. Instead, a new support area formed at the $0.1915 level, which acted as a key pivot later in the session.
Can $0.1915 Support Withstand Another Push?
At 21:35 UTC, the Algorand price again visited Algorand support at $0.1915 and bounced sharply with a spike into the initiation of the ascending channel. In this ascending move, the channel would not have been able to rise above resistance at $0.2020. That upside channel reversal eventually occurred on the downside at 01:55 UTC, again supported by the Death Cross of MACD.
If this downside breakout sustains, Algorand could retest $0.1915 support. If it fails to sustain, the Algorand price may even go down to test the recent lows at about $0.1900. Essentially, these two levels, at $0.1915 support and $0.2020 resistance, will be crucial. Breaking beyond either one decisively could set the level of directional bias for the next move of Algorand. Until we witness a strong and confident volume-backing break of either level, the asset might just continue to consolidate in choppy, range-bound price action.
ALGO Squeezed in Tight Range: 0.1915 vs 0.2020
Presently, the Algorand price traded with tight consolidation bands between $0.1915 and $0.2020, both being vital support-resistance zones. A breakdown below $0.1915 could cause a retest at $0.1900 lows, whereas breakouts to the upside beyond $0.2020 will allow testing of the recent highs. The MACD and RSI continue to conflate, indicating indecision and a wait-and-see attitude within the markets. Traders should wait for clear confirmation of the breakout before positioning; until then, the range-bound price action with short-term volatility will continue.
Algorand (ALGO) Price Analysis of May 16, 2025
Algorand (ALGO) showed a volatile trading session marked by repeated shifts between bearish and bullish structures, yet with a clear downside bias dominating overall momentum. The session began with a breakdown from an upward-moving channel after marking the day’s high. This was followed by a series of range breakdowns and death crossovers on the MACD, reinforcing the bearish tone. Oversold RSI conditions briefly triggered an upside ALGO breakout from an expanding triangle, but bullish momentum failed to hold. The pattern repeated throughout the day; each upside attempt reversed quickly, leading to lower formations and further breakouts. A large converging triangle now defines the structure.

Chart 3: ALGO/USDT M5 Chart, Analysed by vallijat007, published on TradingView, May 16, 2025
An upward-moving channel appeared in the price of Algo, which broke out to the downside after marking the high for the day at $0.2396. Price broke out to the downside at 01:10 UTC, supported by a death crossover of MACD. Price spiked to the downside and formed a range. The range broke out to the downside at 03:45 UTC, supported by a death crossover of MACD. Price failed to form a spike; instead, another range followed. The second range again broke out to the downside at 05:10 UTC, supported by a death crossover of MACD. Price spiked to the downside and formed an expanding triangle pattern.
Double Bottom Forming? $0.2198 Low Holds as Critical Support
In the meantime, at 05:55 UTC, RSI dropped below the level of 30, indicating an oversold market condition. The expanding triangle pattern broke out to the upside at 08:30 UTC, supported by a golden crossover of MACD. The Algorand price spiked and formed a minor range. The range broke out to the downside at 09:30 UTC, supported by a death crossover of MACD. Price spiked to the downside and formed another expanding triangle pattern.
The expanding triangle pattern again broke out to the downside at 13:35 UTC, supported by a death crossover of MACD. Algorand price spiked to the downside and formed a converging triangle pattern, which marked the low for the day at $0.2198. The converging triangle pattern broke out to the upside at 14:55 UTC, supported by a golden crossover of MACD. ALGO Price spiked to the upside, but the upside trend did not sustain for long, and formed a range.
The range broke out to the downside at 21:00 UTC, supported by a death crossover of the MACD. The Algorand price spiked to the downside but failed to drop below the previous low. A large converging triangle pattern appeared in the price, which broke out to the upside at 02:00 UTC, supported by a golden crossover of MACD. If the ALGO breakout succeeds, then the price may rise to the level of $0.2500. If the breakout fails, then the ALGO price may drop to the level of $0.2100.
Converging Triangle Showdown: Breakout or Fakeout?
Algorand price remains at a pivotal point, trading within a large converging triangle after a session dominated by downside moves and short-lived rebounds. While a golden MACD crossover supports the current upside breakout, the failure of previous bullish attempts warns of weak buying momentum. A confirmed breakout could drive price toward the upper target zone, but failure here may resume the broader downtrend. RSI and MACD offer early clues, but price must hold above the breakout level for trend validation. Traders should be cautious and look for strong volume and momentum before trading, as ALGO still faces the risk of slipping into another correction.
Algorand (ALGO) Price Analysis of May 21, 2025
Algorand’s session began with a clear bearish tone, as the Algorand price steadily declined after hitting the daily high of $0.2275. A series of downside Algorand breakouts from ranges and patterns, each supported by MACD death crossovers, confirmed strong selling pressure in the first half of the day. This led to a session low at $0.2161. However, once RSI signaled oversold conditions, a sharp V-shaped recovery followed, shifting the momentum to the upside. The recovery lifted the ALGO price into a broader range, reflecting a balance between recent bearish momentum and renewed buyer interest.
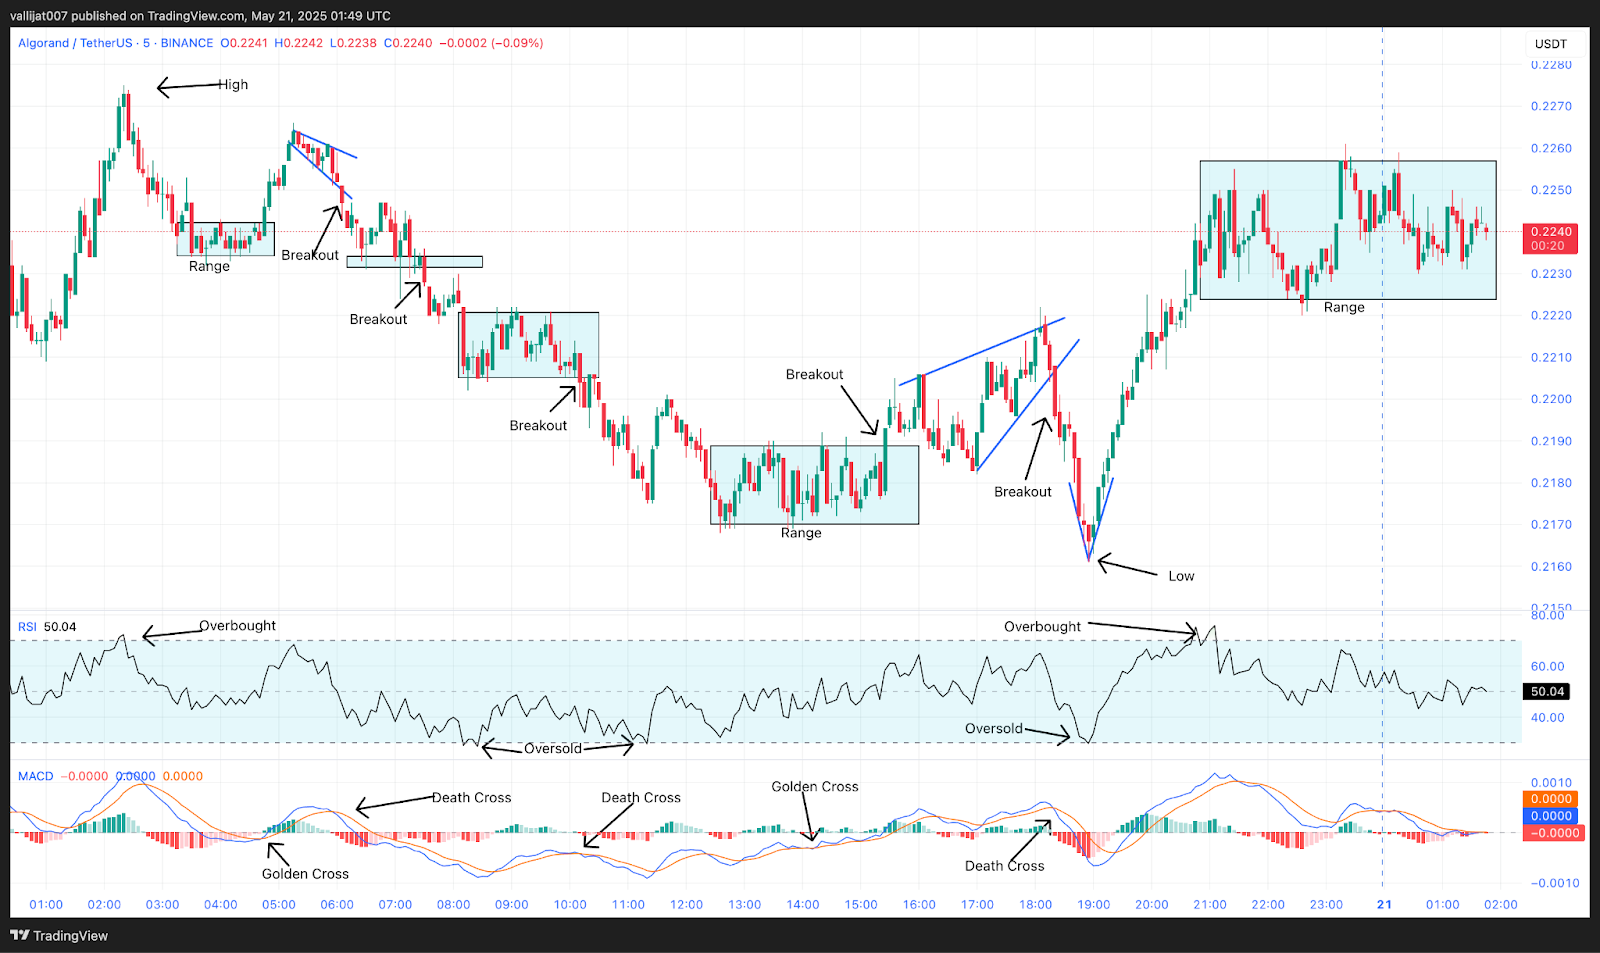
Chart 4: ALGO/USDT M5 Chart, Analysed by vallijat007, published on TradingView, May 21, 2025
After marking a high for the day at $0.2275, the Algorand price dropped to the downside and formed a small range. The range broke out to the upside at 04:45 UTC, supported by a golden crossover of MACD. Price spiked to the upside and formed a minor expanding triangle pattern. The minor expanding triangle pattern broke out to the downside at 06:05 UTC, supported by a death crossover of the MACD. Price moved to the downside and formed a support area at the level of $0.2230.
V-Shaped Recovery, Bulls Defend Critical $0.2161 Support
The support broke to the downside at 07:30 UTC, supported by a death crossover of the MACD. Price moved further down and formed a range. The range broke out to the downside at 10:10 UTC, supported by a death crossover of MACD. The Algorand price moved to the downside and formed another range. This range broke out to the upside at 15:25 UTC, supported by a golden crossover of MACD. Price spiked to the upside and formed a converging triangle pattern.
The converging triangle pattern broke out to the downside at 18:20 UTC, supported by a death crossover of MACD. Price spiked to the downside, marking the low for the day at $0.2161. In the meantime, at 18:55 UTC, RSI dropped below the level of 30, indicating oversold market conditions, suggesting a reversal or at least a pullback. The market reversed to the upside in a V-shaped recovery, pushing the price higher. Price formed a large range with a resistance area at $0.2255 and a support area at $0.2220.
If the range breaks out to the upside, then the price may rise to the level of $0.2300. If the Algorand breakout of the range is to the downside, then the price may drop to the level of $0.2100. In the first half of the session, Algorand showed a downward trend, but after the V-shaped recovery, the ALGO price suddenly rose to the upside, showing strength in the bulls. There is a high chance that the market may consolidate for some time as both bulls and bears will fight for follow-through.
Algorand Enters Consolidation After Reversal
After a strong downward phase, Algorand staged a decisive recovery, forming a large consolidation range between $0.2255 and $0.2220. The earlier bearish trend lost steam as oversold RSI triggered a sharp reversal, and now the market appears to be stabilizing. With momentum indicators showing mixed signals, Algorand is likely to remain range-bound in the short term. A breakout above resistance could push the Algorand price toward $0.2300, while a move below support may expose it to further downside toward $0.2100. Traders should wait for a confirmed breakout before committing to new positions, as consolidation appears likely in the near term.


