
If you want to invest in or buy Amazon stock and wonder what the right price to start accumulating Amazon is, then you are at the right place. As we go through the analysis, we will determine different patterns and how Amazon reacts to them. We will also see support and resistance, which is a good area for any instrument to buy or sell. Without any further delay, let’s dive into the Amazon price analysis and explore different opportunities arising from it.
Amazon Price Analysis of May 3, 2025
Amazon began the session with a gap-up, opening at $191.48 above its previous close of $189.82. However, the initial upward sentiment quickly faded as price action reversed and moved lower, forming the day’s low at $186.75 by 13:50 UTC, confirmed by a death cross of MACD. Oversold signals followed as RSI dropped below 30, hinting at a short-term reversal or pullback. Price rebounded and began forming clear intraday structures such as channels and ranges, with momentum signals from MACD and RSI marking each turning point. The session unfolded with failed breakouts and limited follow-through, reflecting a consolidating and indecisive market.

Chart 1: Analysed by vallijat007, published on TradingView, May 3, 2025
The Amazon price opened at $191.48, which was above its previous close of $189.82, indicating a gap-up opening. The price quickly moved to the downside, marking the low for the day at 13:50 UTC, supported by a death cross of MACD. Amazon stock created a support zone at $186.75. In the meantime, at 13:45 UTC, RSI dropped below the level of 30, indicating oversold market conditions and suggesting a reversal or at least a pullback.
A price channel developed as the price increased. The breakout above occurred at 15:05 UTC as MACD produced its first golden crossover while providing support. The market prices grew rapidly to reach $192.88 as the daily high and established a resistance point at $192. RSI rose past 70 at 16:20 UTC, which revealed market conditions had become overbought, which signified that price might slow down or reverse direction.
Amazon’s False Breakout Trap: Traders Await Clear Direction
Amazon formed a small range, which broke out to the downside at 16:55 UTC, supported by a death cross of MACD. Price dipped and formed a minor downward-moving channel. The channel broke out to the upside at 17:25 UTC, but the Amazon breakout failed to produce a significant rally. Instead, another small range appeared, which again broke out to the upside at 18:05 UTC, supported by a golden cross of MACD. However, the price again failed to rally, and another range was formed.
This third range broke out to the downside at 18:45 UTC, supported by a death cross of MACD. Price dipped but failed to form a defined trend, and instead another narrow range appeared. The price closed within this range at $189.95. The Amazon price is currently consolidating between a resistance area at $192.50 and a support area at $186.50. For Amazon to establish a strong trend, one of these two critical levels must be broken with strong momentum. Until then, the stock is likely to remain in its consolidation phase.
The Patience Game Until Clear Breakout Emerges
The Amazon price action remains locked within a consolidation phase, oscillating between support at $186.50 and resistance at $192.50. Despite multiple Amazon breakouts from patterns like channels and ranges, the price failed to sustain any directional move. Repeated MACD crossovers and RSI extremes have fueled short-term fluctuations, but not enough to trigger a trend. The repeated failure of upside momentum and lack of sustained downside pressure indicate a market awaiting a catalyst. A breakout beyond either key level, $186.50 or $192.50, with strong volume and momentum will be necessary to establish a clear trend. Until then, range-bound trading is expected to persist.
Amazon (AMZN) Price Analysis of May 7, 2025
The Amazon price opened at $184.60, below the previous close of $186.20, signaling early bearish pressure. The price dropped to an intraday low of $183.80, with RSI dipping below 30 at 13:30 UTC, indicating oversold conditions. A bounce followed, and the price ranged between $186.15 support and $187 resistance. A brief breakout at 16:10 UTC pushed the price to a high of $187.94, but the move failed, reinforcing resistance at $188. A downside breakout at 16:45 UTC, supported by a MACD Death Cross, led to an expanding triangle, which reversed upward at 18:15 UTC but again lost momentum. Amazon closed at $185, still range-bound.

Chart 2: AMZN M5 Chart, Analysed by vallijat007, published on TradingView, May 7, 2025
Amazon opened at $184.60, below its previous close of $186.20, indicating early bearish pressure. After the open, the Amazon price dropped and marked the low for the day at $183.80. At 13:30 UTC, RSI dipped below 30, signaling oversold market conditions and suggesting the possibility of a pullback or short-term reversal.
Price then shot upward and set a range, with resistance around $187 and Amazon support around $186.15. Amazon stock breached to the upside from this range at 16:10 UTC and recorded the highest for the day at $187.94. The breakout, however, could not hold, and the Amazon price fell quickly back into the initial range. This breakdown produced a greater resistance level at $188, which the price tried to breach for the rest of the session.
When Will the $185 − $188 Deadlock Break?
Shortly afterwards, at 16:45 UTC, the Amazon price broke to the downside from the same range, this time supported by a death crossover of MACD. The downward momentum formed an expanding triangle pattern, which is typically a signal of increased volatility and uncertainty in direction. At 18:15 UTC, the expanding triangle broke to the upside, this move being supported by a golden crossover of MACD.
Amazon stock spiked up again, showing brief strength, but failed to establish a consistent trend or upward-moving channel. Instead, a small consolidation range developed. Toward the end of the day, this narrow range broke out to the downside at 19:55 UTC, supported by another death crossover of MACD. The Amazon price closed at $185, just above intraday support but below the open, reflecting a lack of conviction from either bulls or bears.
Amazon’s intraday action shows a pattern of range-bound behavior, with both upward and downward breakouts failing to gain traction. The key levels to watch remain $188 as resistance and $185 as Amazon support. Until one of these levels is broken with strong momentum, Amazon is likely to continue consolidating within this narrow band. If the next market open occurs within this range, traders can expect further sideways movement unless driven by external catalysts or strong volume surges.
AMZN Stuck in Neutral: Will $185 Support or $188 Resistance Break First?
Amazon continues to trade between $185 support and $188 resistance, with multiple failed breakouts showing a lack of conviction on both sides. Indicators such as MACD and RSI reflect a neutral stance, supporting the view of consolidation. A decisive break above $188 could signal strength and open the way for further upside. Conversely, a breakdown below $185 might trigger a deeper pullback. Until one of these levels is breached with volume and indicator confirmation, Amazon is likely to remain stuck in its current range. Traders should stay patient and watch for a clean breakout before taking directional positions.
Amazon (AMZN) Price Analysis of May 16, 2025
The Amazon stock trading session reflected a classic range-bound structure, starting with a gap-down open that signaled initial bearish control. Though price attempted to recover and fill the gap, it stalled below previous levels, marking a modest intraday high. Early weakness established a key Amazon support zone, which temporarily gave way but lacked follow-through. Throughout the day, the price oscillated between clearly defined support and resistance areas, producing multiple patterns, including converging triangles and channels, most of which failed to establish momentum. Despite repeated breakout attempts, the market remained indecisive, highlighting buyer-seller equilibrium around short-term price zones.
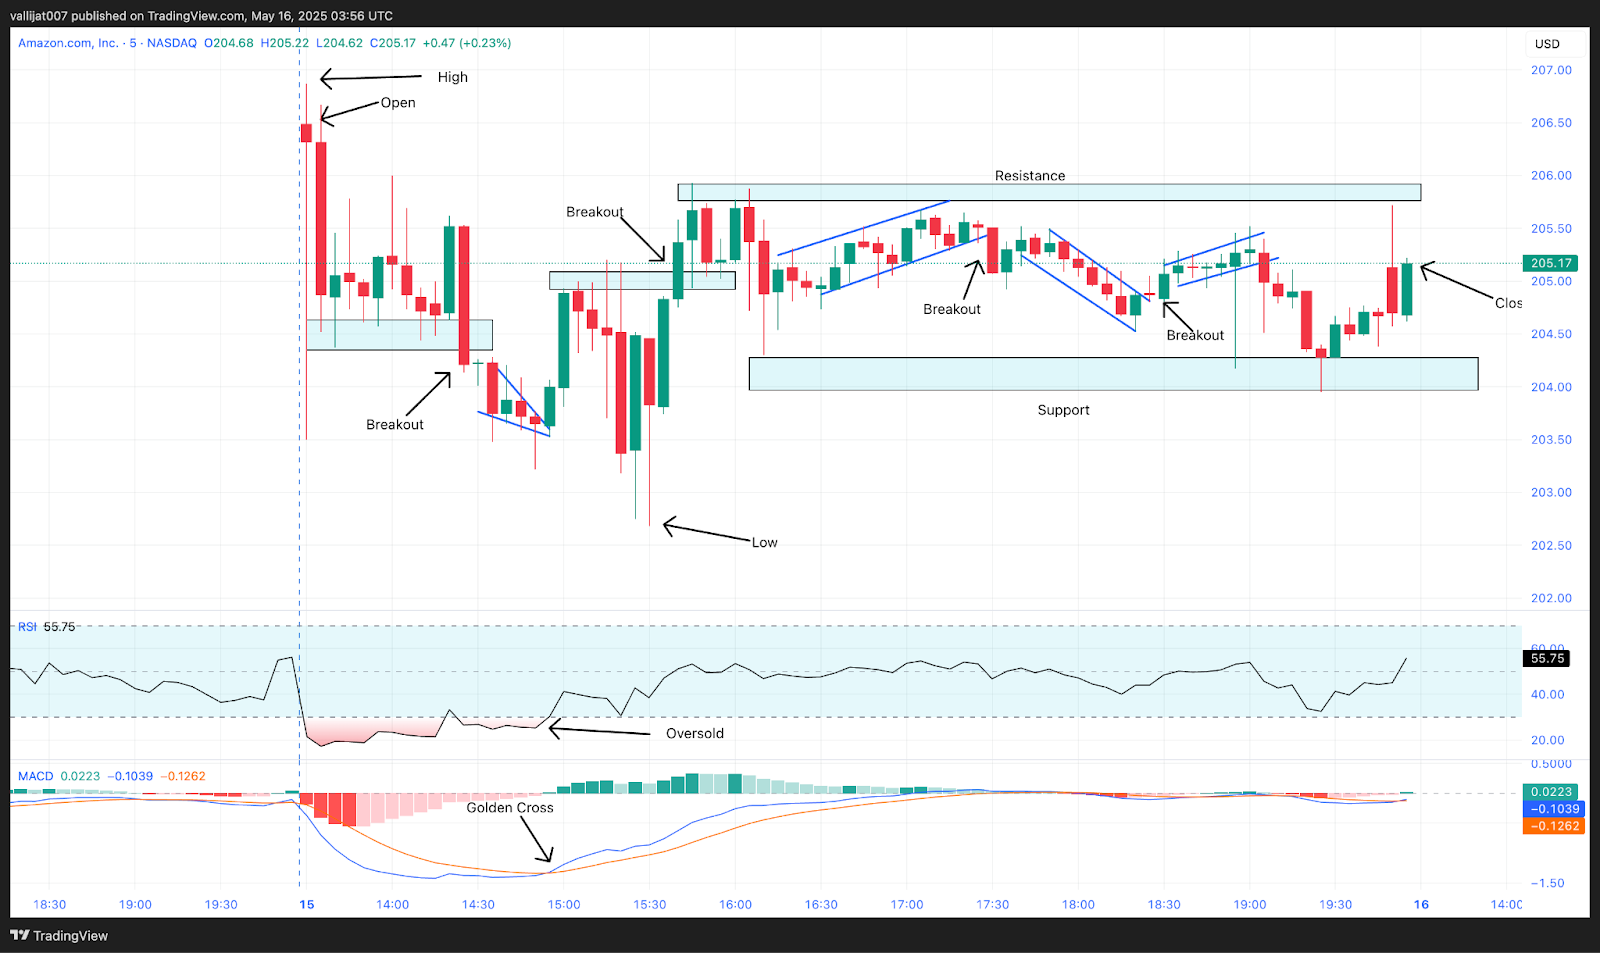
Chart 3: AMZN/USDT M5 Chart, Analysed by vallijat007, published on TradingView, May 16, 2025
The Amazon price opened at $206.49, which is below its previous close. The Amazon price moved to the upside in an attempt to fill the gap, marking the high for the day at $206.87, but the price failed to fill the gap. Price formed an Amazon support area at the level of $204.50. The support broke out to the downside at 14:25 UTC, supported by a death crossover of the MACD. Price moved back to the downside and formed a minor converging triangle. In the meantime, RSI dropped below the level of 30, indicating an oversold market condition, suggesting a reversal or at least a pullback.
Rangebound Battle: 204 Support vs. 205.70 Resistance Standoff
The minor converging triangle broke out to the upside at 14:55 UTC, supported by a golden crossover of MACD. Price spiked to the upside and formed a resistance area at $205. As price failed to break the resistance, it dropped to the downside, marking the low for the day at $202.68. At 15:40 UTC, the price moved through the resistance area, breaking it to the upside, but failed to form a strong trend.
Instead, another range appeared in the price at the level of $204.70, and a support area developed at the level of $204. A small upward-moving channel appeared between the resistance and support area, which broke out to the downside at 17:30 UTC, but the Amazon price failed to break the support area. Instead, a downward-moving channel appeared, which broke out to the upside at 18:30 UTC, which again failed to break the upper resistance area.
Another channel appeared, which broke out to the downside at 19:05 UTC but failed to break the support area. The Amazon price closed at the level of $205.17. The gap-down opening of the price shows the bearish control of the market. As the buyers stepped in, they held the price at the $204 support level, and sellers pushed the price to the downside, creating a resistance area at $205.70. The day is said to be a trading range day, with most of the breakouts failing to form a strong trend.
Amazon Stock Trapped in Tight Range Amidst Gap Pressure
The Amazon price ended the day confined within a narrow range, where most breakouts lacked strength and reversed quickly. The session was shaped by a bearish gap that went unfilled, confirming sellers’ early influence. Buyers managed to protect the $204 support level, but persistent selling near $205.70 created a ceiling for upward movement. With RSI and MACD both meandering to their base level, the market stayed in balance, producing no sustained trend. Unless price decisively breaks above resistance or below support with volume and confirmation, Amazon may continue this sideways movement. Caution is warranted, as false breakouts remain a key feature in this setup.
Amazon (AMZN) Price Analysis of May 21, 2025
Amazon’s session opened with bearish pressure, gapping down from the previous close and failing to recover fully. Despite an early spike attempting to fill the gap, the price topped at $205.59 before sellers regained control. The rest of the session was characterized by a series of bearish patterns, including multiple downside Amazon breakouts from ranges and converging triangles, all supported by MACD death crossovers. While oversold RSI readings prompted occasional recoveries, none had sustained momentum. Despite several pullback attempts, Amazon stock remained in a downward trend and closed below its opening level, highlighting continued weakness.
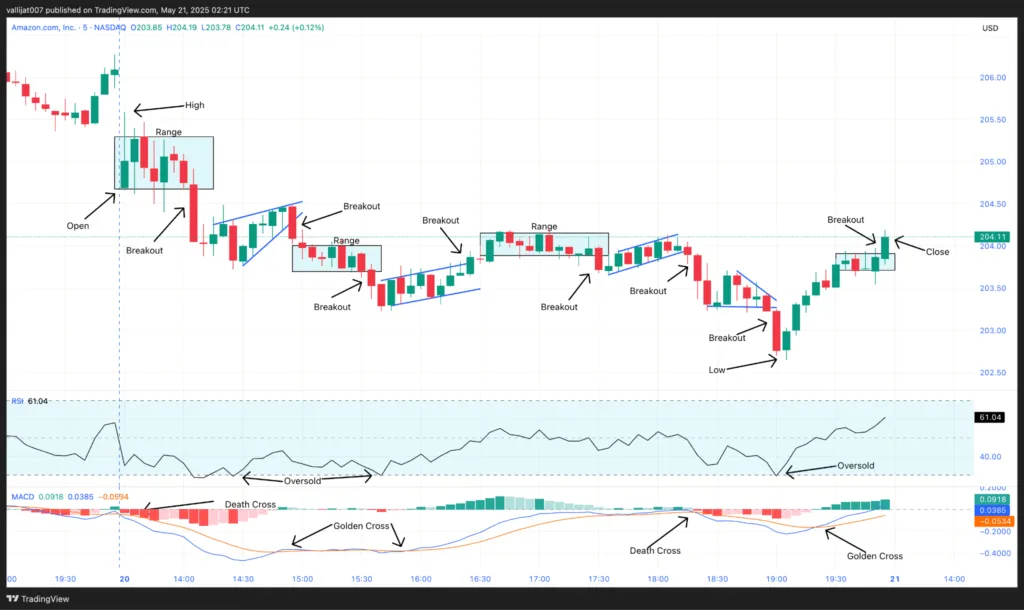
Chart 4: AMZN/USDT M5 Chart, Analysed by vallijat007, published on TradingView, May 21, 2025
The Amazon price opened at $204.69, which is below its previous closing price. After the open, price spiked to the upside in an attempt to fill the gap-down opening, marking the high for the day at $205.59. But the Amazon price failed to fill the gap, showing strong bearish conviction to push the price lower. Amazon formed a small range after the open. The range broke out to the downside at 14:05 UTC, supported by a death crossover of MACD. In the meantime, at 14:10 UTC, RSI dropped below the level of 30, indicating oversold market conditions, suggesting a reversal or at least a pullback.
Closing Below Open: Weakness Persists Despite Late-Session Bounce
A converging triangle pattern appeared in the Amazon price, which broke out to the downside at 14:55 UTC, supported by a death crossover of MACD. Price spiked to the downside and formed a range. The range again broke out to the downside at 15:35 UTC, but the price failed to have follow-through. Instead, an upward-moving channel appeared in the price. In the meantime, at 15:40 UTC, RSI dropped below the level of 30, indicating oversold market conditions, suggesting a reversal or at least a pullback. The upward-moving channel broke out to the upside at 16:25 UTC, supported by a golden crossover of MACD.
Price spiked to the upside and formed a range. The range broke out to the downside at 17:30 UTC, supported by a death crossover of MACD, but the price failed to have follow-through. Instead, a downward-moving channel appeared in the price. The downward-moving channel broke out to the downside at 18:15 UTC, supported by a death crossover of MACD. Price spiked to the downside and formed a converging triangle pattern. The converging triangle pattern broke out to the downside at 18:55 UTC, supported by a death crossover of MACD.
Price dropped to the downside and marked the low for the day at $202.65, but failed to have follow-through. In the meantime, at 19:00 UTC, RSI dropped below the level of 30, indicating oversold market conditions, suggesting a reversal or at least a pullback. After marking the low, the price spiked to the upside and formed a range. The range broke out to the upside at 19:55 UTC, supported by a golden crossover of MACD. The Amazon price closed at $204.11, which is below its open price.
Amazon Struggles Below Gap as Sellers Dominate
Amazon stock closed the session below its opening price, confirming bearish dominance throughout the day. While oversold RSI levels triggered temporary reversals, each bounce was short-lived and quickly followed by further selling. The price consistently failed to maintain any upside Amazon breakouts, reinforcing the downward bias. With multiple MACD death crossovers and weak follow-through on bullish attempts, momentum favored the sellers. As long as the gap remains unfilled and key support levels are under pressure, Amazon may continue to trade with a bearish tilt. A decisive shift in momentum or volume will be needed to reverse this short-term downtrend.
Amazon (AMZN) Price Analysis of June 21, 2025
Amazon price opened at $214.70, gapping above its previous close and setting an early high for the day at $214.88. The session began with bullish energy but quickly turned choppy as price action shifted into a series of ranges and expanding triangle patterns. Momentum indicators like MACD and RSI played a key role in confirming breakouts and reversals throughout the day. As the session progressed, downside pressure increased, eventually pushing Amazon stock to a session low of $208.288. The stock closed at $209.61 after several failed breakouts and reversals, reflecting a day dominated by indecision.
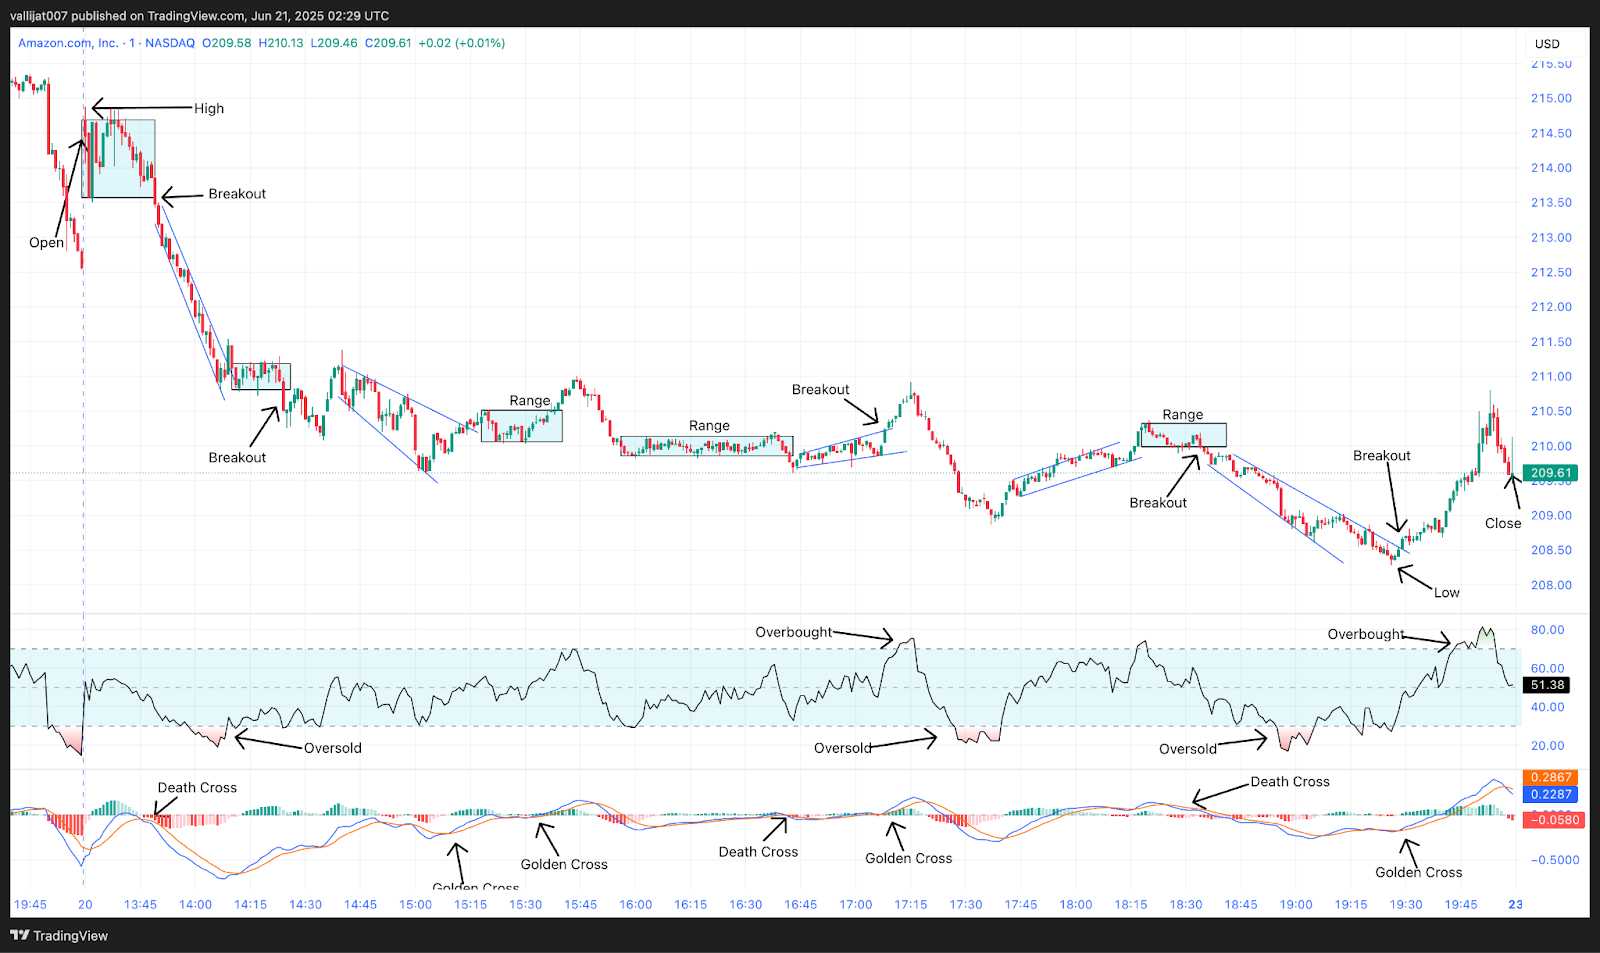
Chart 5: AMZN/USDT M1 Chart, Analysed by vallijat007, published on TradingView, June 21, 2025
The Amazon price opened at $214.70, which is above its previous close. After the gap-up opening, the price marked the high for the day at $214.88 and formed a range. The range broke out to the downside at 13:49 UTC, supported by a death crossover of MACD, with price moving back to the downside and forming a tight downward-moving channel. The channel tried to break out to the upside at 14:09 UTC, supported by a golden crossover of MACD, but the breakout failed, and the Amazon trend formed another range.
Daily Low Established at $208.288 Within Expanding Triangle Pattern
The range broke to the downside at 14:24 UTC, supported by the death crossover of MACD, forming an expanding triangle pattern. The expanding triangle broke out to the upside at 15:04 UTC, supported by a golden crossover of MACD, with price spiking, but a range followed. The range broke to the upside at 15:39 UTC, supported by a golden crossover of MACD. But the momentum faded, and the price dropped to the downside, forming another range.
The range broke out to the downside at 16:42 UTC, supported by MACD, and an expanding triangle formed. The expanding triangle failed to maintain momentum, and the Amazon price dropped to the downside at 17:15 UTC, where RSI dropped below the level of 30, indicating oversold market conditions, suggesting a reversal or at least a pullback. Amazon trend then formed an upward-moving channel, but the channel failed to break out on either side, and a range followed.
The range broke out to the downside at 18:34 UTC, supported by MACD, and at 18:55 UTC, RSI indicated oversold conditions. The expanding triangle pattern marked the low for the day at $208.288. The triangle broke out to the upside at 19:19 UTC, supported by a golden crossover of MACD, with a spike to the upside. Price closed at $209.61. At 19:45 UTC, RSI rose above the level of 70, indicating overbought market conditions. The Amazon price is currently consolidating. Traders and investors should be cautious before placing a breakout trade in Amazon.
$208.288 Support and $214.88 Resistance, the AMZN’s Consolidation Zone
The Amazon stock trading session was marked by a steady decline in momentum following its early high at $214.88. Despite multiple upside breakouts confirmed by golden MACD crossovers, most lacked strength and failed to hold. Repeated dips below RSI 30 underscored bearish pressure, culminating in a low of $208.288. The RSI reading at 19:45 UTC above 70 suggested an overbought situation, while a late recovery raised the Amazon price to $209.61 close. Amazon seems to be trapped in a strict consolidation phase with support near $208.00 and resistance at $215.00. Before assuming directional positions, traders should let a clear breakout from this zone first.
Amazon (AMZN) Price Analysis of June 28, 2025
Amazon stock opened higher at $219.98, signaling a bullish start to the session. Early trading saw the formation of a converging triangle pattern, which broke down at 14:24 UTC, triggering a drop and setting a bearish tone. RSI dipped below 30 shortly after, indicating oversold conditions and potential for a bounce. Amazon price action remained choppy throughout the day with multiple failed breakouts and repeated triangle patterns. Despite continued volatility, Amazon eventually rebounded and staged a strong upward move into the close.

Chart 6: AMZN/USDT M1 Chart, Analysed by vallijat007, published on TradingView, June 28, 2025
Amazon price opened at $219.98 after a gap-up. The price formed a converging triangle pattern. The converging triangle pattern broke out to the downside at 14:24 UTC, supported by a death crossover of MACD, with price spiking to the downside and forming a range. At 14:31 UTC, RSI dropped below the level of 30, indicating oversold market conditions, suggesting a reversal. The range tried to break out to the downside at 14:51 UTC, supported by a death crossover of MACD, but the downside Amazon breakout failed, and the Amazon price formed a converging triangle pattern.
Failed Upside Breakout at 16:51 UTC Despite Golden Cross
The converging triangle pattern failed to break out to either side, and another converging triangle formed. The second converging triangle broke out to the upside at 16:51 UTC, supported by a golden crossover of MACD, but the breakout failed, and the price formed a downward moving channel. The downward-moving channel broke out to the upside at 17:40 UTC, but the breakout failed, and the price dropped to the downside, forming a range. The range broke out to the downside at 17:55 UTC, supported by a death crossover of MACD, and formed another range.
At 18:05 UTC, RSI dropped below the level of 30, indicating oversold market conditions, suggesting a reversal. The range broke out to the downside at 18:21 UTC, supported by a death crossover of MACD, and formed an expanding triangle pattern. The expanding triangle pattern marked the low for the day at $216.75. The expanding triangle pattern broke out to the upside at 19:00 UTC, supported by a golden crossover of MACD, and formed an upward-moving channel.
At 19:10 UTC, RSI moved above the level of 70, indicating overbought market conditions, suggesting a reversal. The upward-moving channel broke out to the downside at 19:42 UTC, supported by a death crossover of MACD, and formed a range. The range broke out to the upside at 19:50 UTC, supported by a golden crossover of MACD, with price spiking to the upside and marking the high for the day at $223.25, and closing at $223.16.
$223.25 High-Capped Amazon’s Recovery After Early Dip
After bottoming at $216.75 within an expanding triangle pattern, Amazon stock recovered sharply in late trading. Supported by a golden MACD crossover, the Amazon breakout at 19:00 UTC resulted in an upward moving channel and a rush to the high of $223. 16 for the session. Overbought territory was indicated by an RSI above 70 at 19:10 UTC; although a quick pullback followed, the stock closed close to its high at $223. 16. This intraday reversal underlines robust buying interest, but the overbought signals imply that short-term consolidation or a slight dip is probable before any sustained rally.