

Are you watching Advanced Micro Devices (AMD) and wondering where the stock could be headed next? Then you’re in the right place. Let’s break down the recent AMD price performance and assess what it may signal for the short term. As of May 6, 2025, AMD stock is trading near $100.59, down around 17% year-to-date. This decline in value comes after decreased revenue from the GPU exports due to tighter U.S. chip export rules.
Despite these issues, AMD remains a strong player in the AI and PC chip space. The company has product launches lined up, which investors think could ignite momentum for AMD. Investors and traders are closely watching how the company navigates market headwinds, especially in a competitive semiconductor landscape. Let’s take a closer look at what the charts reveal.
Advanced Micro Devices (AMD) Price Analysis for May 6, 2025
Advanced Micro Devices opened at a price of $99. The stock began the session with a bullish push, forming a strong green candle to $100.37. Right after, the AMD price quickly entered an upward trend, going up to $101.23. This rise was short-lived as the price faced resistance at that point and turned downward, forming a downward trend to $100.33 by 14:30 UTC. However, it found support at that level, initiating another upward trend with several short green candles indicating a gradual bullish trend.

AMD M-5 Price Chart, analyzed by raodevansh18, published on TradingView, May 6, 2025
After a brief retracement to $100.7 marked by the bearish candle at 15:00 UTC, the price again gained slightly to reach $101.13. However, the death cross on the MACD led the price to test the support again. The AMD stock started another upward trend with a clear series of higher highs and higher lows at 15:45 UTC. The price climbed to $100.88. A short red candle was observed at 16:30 UTC. However, the bullish momentum remained stable as the price steadily climbed, eventually breaking the $101.7 resistance.
Once AMD approached the $102 mark, the candles began consolidating sideways, forming a tight trading range just below resistance. This sideways movement persisted until 18:50 UTC, suggesting indecision among buyers and sellers. Eventually, bears regained control, pushing the price out of the consolidation range. A downward trend followed, marked by multiple red candles, dragging the price closer to the lower support zone once again.
Technical Indicators Paint Bearish Picture for AMD
The MACD indicator provided confirmation for the bearish trends throughout the session. An early golden cross coincided with the start of the first upward trend, while a subsequent death cross aligned with the price dip. A second golden cross near the middle of the chart confirmed the recovery phase, again followed by a death cross, which came before the final downward slide.
The RSI also hovered above the 70 level for most of the session. It touched overbought levels during the sharp upward move and again during the range formation near resistance, both of which signaled potential reversals. Toward the end, the RSI dropped into the oversold territory, indicating weakening selling pressure.
Short Comeback Likely, More Retracement to Come for AMD Price After
Looking ahead, the technical indicators suggest a mixed outlook for the next trading day. The RSI’s position in the oversold zone could imply a short-term bounceback, especially near the support level. However, the latest death cross on the MACD hints at a continuation of bearish momentum unless bulls step in early.
If the AMD stock holds above the current support around $100, a sideways to slightly bullish recovery may occur. Otherwise, a breakdown below this zone could invite further selling pressure. Traders may look for confirmation via volume spikes and MACD convergence to determine the direction of the next strong move. As it stands, caution remains warranted going into the next session.
Advanced Micro Devices (AMD) Stock Price Analysis for May 8
Trading opened with the AMD stock priced at $100.74. The session opened with a bullish candle, taking the price up to $102.5. However, heavy bearish momentum followed as the AMD stock plunged sharply in a well-defined downward channel, sliding from above $102.54 to near $98 within the first hour of trading. The price consistently touched lower highs and lower lows after the bullish opening candle. The red candles dominated early price action, showing firm control by the bears. This steep fall set a bearish tone for the coming hours.

AMD, NASDAQ M-5 chart, analyzed by raodevansh18, published on TradingView, May 8,2025
Following this, the AMD price started recovering steadily, entering a structured upward channel. This shift indicated the beginning of a gradual comeback. Higher lows and consecutive bullish candles helped the stock reclaim the $99.5 level. However, the upward momentum hit a ceiling as the AMD price approached resistance at $99.6. The market faced a brief rejection here, as the price slumped to $97.47 by 15:35, reflecting the strong bearish grip. However, the price managed a strong comeback, going up to $99.80 in the next 20 minutes.
AMD Dips Below Support, Stages Remarkable Recovery
Around the same time, the stock shifted into a short-term downtrend, pulling back toward $98.30. The price found support well above earlier lows, hinting at a bullish resurgence. The price, building bullish pressure, attempted a reversal by 16:35 UTC. This reversal led the price up to $99.55. But, a second downward trend quickly followed at 17:10, dragging the AMD price to the lower support level at $97.9. This decline, however, found a firm base near $97.88 at 17:35. For the next half an hour, some consolidations occurred as short candles formed, reflecting market indecision. The bearish candle at 18:00 UTC pulled the price below the $97.9 support, with the AMD price now at $97.06.
From 18:15 UTC, Advanced Micro Devices saw renewed bullish activity. The AMD stock rebounded strongly, forming an upward trend to 98.44. The price entered a tight trading range between $98 and $98.50. Eventually, around 19:30 UTC, the bulls regained control, breaking out of the range with consecutive strong green candles that lifted the AMD price to $100.7 by 19:40. A short corrective candle did form, but the price continued to move up to reach $100.37 by the session’s close, reclaiming the key resistance zone.
Indicators Corroborate Price Movements, Suggest Bullish Opening
Technical indicators validated most of the observed AMD trends. Early in the session, the MACD flashed a death Cross, which aligned with the steep opening decline. A golden cross near 16:00 UTC provided early confirmation of the upward recovery. Another death cross appeared around 18:00 UTC before the final breakout was supported by a third golden cross, in sync with bullish momentum. The RSI was overbought at the start of the session, aligning with the ensuing downtrend. For the rest of the session, it has been between the normal 30-70 levels. However, it climbed steadily to near overbought levels by session close, hinting at growing buyer strength.
Buyers May Push Price Up Early, Short-Term Reversals Highly Probable
With the AMD stock closing above the $100 resistance zone, the market sentiment is cautiously bullish. The MACD’s recent golden cross and the rising bars on the price chart reflect growing bullish momentum. The RSI is also nearing 70, indicating strength but also potential exhaustion if the bulls overextend. The market sentiment is cautiously bullish with the AMD stock closing above the $100 resistance zone. It will be worth noting whether the AMD price can hold above $99.50. Sustained buying could push Advanced Micro Devices toward $101.50–$102, while rejection might send the AMD price back toward the $98.20–$97.80 range.
Advanced Micro Devices (AMD) Price Analysis for May 12, 2025
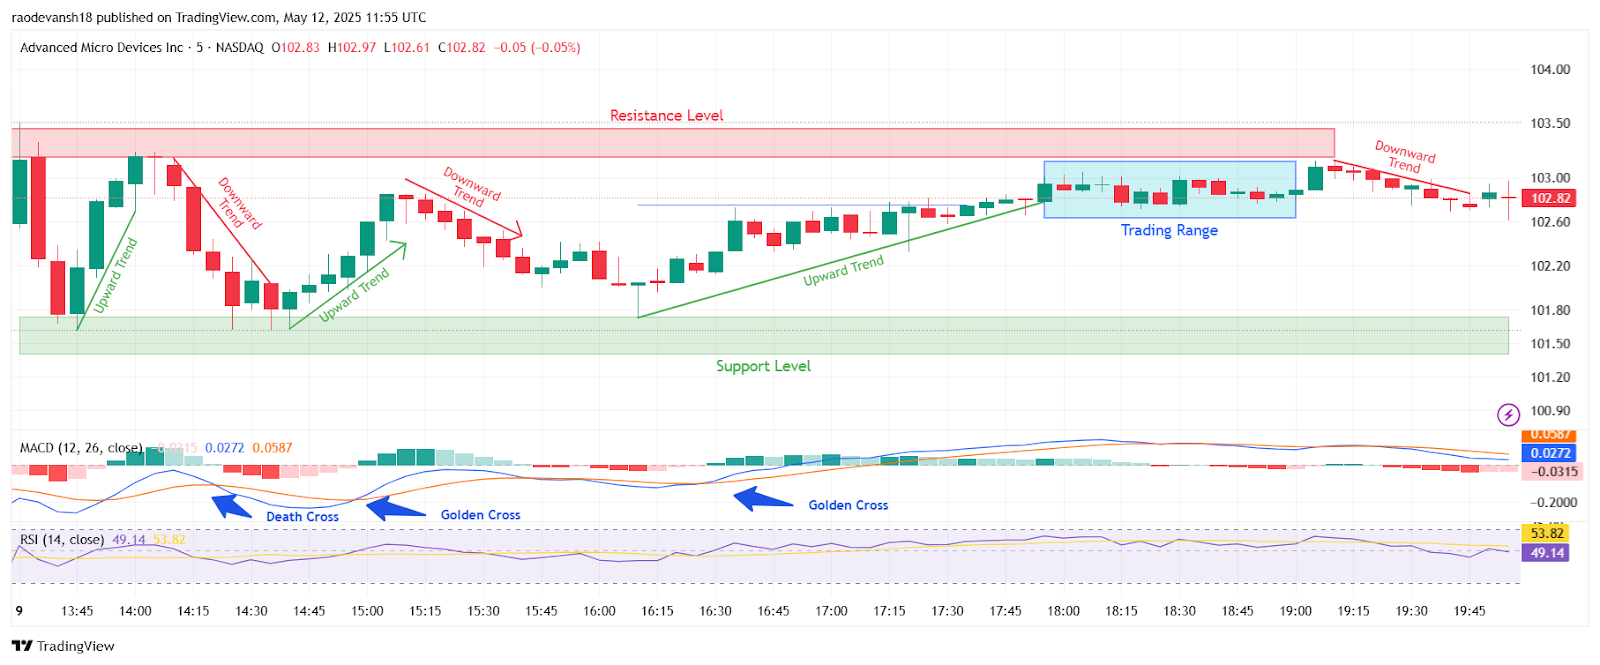
The trading session for Advanced Micro Devices Inc. (AMD) showcased volatile price action within well-defined support and resistance levels. AMD’s price movements went through multiple brief trends before consolidating in a narrow trading range. The resistance around $103.20 and the support zone near $101.60 served as crucial boundaries throughout the session. The AMD stock opened at $102.58.
The session began with a bullish candle, leading the price close to the $103.2 resistance. This rise was met by a strong reversal to $101.7 by 13:40 UTC. An upward trend followed, pushing AMD’s price closer to the resistance level. This rally, however, met strong rejection at $103.20, initiating a swift downward reversal. A bearish trend followed, marked by consecutive red candles pulling the price back down to $101.8MACD confirmed the shift with a visible death cross at 14:20 UTC. This technical signal indicated a loss of bullish momentum.. The RSI also began its descent, reflecting increased bearish influence as the price approached the $102.00 zone again.
AMD, NASDAQ M-5 Chart, analyzed by raodevansh18, published on TradingView, May 12, 2025
AMD Stages Slow Mid-Session Recovery
The bears lost steam near the support level. From this point, the AMD price saw a significant rebound, launching another upward trend. A sequence of green candles confirmed renewed bullish interest. This upward push was validated by a MACD golden cross. At the same time, the RSI shifted back above the midline, showing a return to bullish momentum. However, the AMD price could not reclaim the earlier highs near resistance and capped near the $102.85 level. Another downward trend formed, dragging the price into a slightly lower high at $102.12.
At 16:10 UTC, the EMAs started converging and formed a golden cross soon. A slow and steady upward trend forms, pushing the price up to $102.8 by 17:45 UTC. From 17:45 UTC onward, AMD entered into a consolidation phase, moving sideways within a narrow band. This trading range reflected the indecision between buyers and sellers. While minor green and red candles alternated, neither side managed to break out of the horizontal channel decisively.
During this phase, the MACD remained relatively flat with minor fluctuations, and the RSI hovered around the midline, corroborating the lack of a directional movement. This range suggested that the market was awaiting for a decisive move or volume surge.
AMD Musters Final Resistance Test Near Closing, Rejected Again
Post 19:00 UTC, the Advanced Micro Devices stock took one final dig at the resistance with a bullish candle. But another rejection followed, pulling the price from the top of the range back below $103.00. The EMAs started converging towards the end of the session, suggesting bearish exhaustion. AMD closed the session at $102.82, slightly below the midpoint of the trading day, indicating neutral to mild bearish sentiment.
AMD Awaits Breakout After Range-Bound Session
The recent AMD price action has been defined by alternating short trends and a tight trading range. While bulls managed to push prices up from support levels twice, the resistance around $103.30 held firm. Momentum shifted between the bulls and the bears but lacked strong conviction in either direction by session close. If AMD can maintain the temporary support above $102, a bullish breakout could follow. Otherwise, further pullbacks may lead to renewed support retests.
Are you watching Advanced Micro Devices (AMD) and wondering where the stock could be headed next? Then you’re in the right place. Let’s break down the recent AMD price performance and assess what it may signal for the short term. As of May 6, 2025, AMD stock is trading near $100.59, down around 17% year-to-date. This decline in value comes after decreased revenue from the GPU exports due to tighter U.S. chip export rules.
Despite these issues, AMD remains a strong player in the AI and PC chip space. The company has product launches lined up, which investors think could ignite momentum for AMD. Investors and traders are closely watching how the company navigates market headwinds, especially in a competitive semiconductor landscape. Let’s take a closer look at what the charts reveal.
Advanced Micro Devices (AMD) Price Analysis for May 6, 2025
Advanced Micro Devices opened at a price of $99. The stock began the session with a bullish push, forming a strong green candle to $100.37. Right after, the AMD price quickly entered an upward trend, going up to $101.23. This rise was short-lived as the price faced resistance at that point and turned downward, forming a downward trend to $100.33 by 14:30 UTC. However, it found support at that level, initiating another upward trend with several short green candles indicating a gradual bullish trend.
AMD M-5 Price Chart, analyzed by raodevansh18, published on TradingView, May 6, 2025
After a brief retracement to $100.7 marked by the bearish candle at 15:00 UTC, the price again gained slightly to reach $101.13. However, the death cross on the MACD led the price to test the support again. The AMD stock started another upward trend with a clear series of higher highs and higher lows at 15:45 UTC. The price climbed to $100.88. A short red candle was observed at 16:30 UTC. However, the bullish momentum remained stable as the price steadily climbed, eventually breaking the $101.7 resistance.
Once AMD approached the $102 mark, the candles began consolidating sideways, forming a tight trading range just below resistance. This sideways movement persisted until 18:50 UTC, suggesting indecision among buyers and sellers. Eventually, bears regained control, pushing the price out of the consolidation range. A downward trend followed, marked by multiple red candles, dragging the price closer to the lower support zone once again.
Technical Indicators Paint Bearish Picture for AMD
The MACD indicator provided confirmation for the bearish trends throughout the session. An early golden cross coincided with the start of the first upward trend, while a subsequent death cross aligned with the price dip. A second golden cross near the middle of the chart confirmed the recovery phase, again followed by a death cross, which came before the final downward slide.
The RSI also hovered above the 70 level for most of the session. It touched overbought levels during the sharp upward move and again during the range formation near resistance, both of which signaled potential reversals. Toward the end, the RSI dropped into the oversold territory, indicating weakening selling pressure.
Short Comeback Likely, More Retracement to Come for AMD Price After
Looking ahead, the technical indicators suggest a mixed outlook for the next trading day. The RSI’s position in the oversold zone could imply a short-term bounceback, especially near the support level. However, the latest death cross on the MACD hints at a continuation of bearish momentum unless bulls step in early.
If the AMD stock holds above the current support around $100, a sideways to slightly bullish recovery may occur. Otherwise, a breakdown below this zone could invite further selling pressure. Traders may look for confirmation via volume spikes and MACD convergence to determine the direction of the next strong move. As it stands, caution remains warranted going into the next session.
Advanced Micro Devices (AMD) Stock Price Analysis for May 8
Trading opened with the AMD stock priced at $100.74. The session opened with a bullish candle, taking the price up to $102.5. However, heavy bearish momentum followed as the AMD stock plunged sharply in a well-defined downward channel, sliding from above $102.54 to near $98 within the first hour of trading. The price consistently touched lower highs and lower lows after the bullish opening candle. The red candles dominated early price action, showing firm control by the bears. This steep fall set a bearish tone for the coming hours.
AMD, NASDAQ M-5 chart, analyzed by raodevansh18, published on TradingView, May 8,2025
Following this, the AMD price started recovering steadily, entering a structured upward channel. This shift indicated the beginning of a gradual comeback. Higher lows and consecutive bullish candles helped the stock reclaim the $99.5 level. However, the upward momentum hit a ceiling as the AMD price approached resistance at $99.6. The market faced a brief rejection here, as the price slumped to $97.47 by 15:35, reflecting the strong bearish grip. However, the price managed a strong comeback, going up to $99.80 in the next 20 minutes.
AMD Dips Below Support, Stages Remarkable Recovery
Around the same time, the stock shifted into a short-term downtrend, pulling back toward $98.30. The price found support well above earlier lows, hinting at a bullish resurgence. The price, building bullish pressure, attempted a reversal by 16:35 UTC. This reversal led the price up to $99.55. But, a second downward trend quickly followed at 17:10, dragging the AMD price to the lower support level at $97.9. This decline, however, found a firm base near $97.88 at 17:35. For the next half an hour, some consolidations occurred as short candles formed, reflecting market indecision. The bearish candle at 18:00 UTC pulled the price below the $97.9 support, with the AMD price now at $97.06.
From 18:15 UTC, Advanced Micro Devices saw renewed bullish activity. The AMD stock rebounded strongly, forming an upward trend to 98.44. The price entered a tight trading range between $98 and $98.50. Eventually, around 19:30 UTC, the bulls regained control, breaking out of the range with consecutive strong green candles that lifted the AMD price to $100.7 by 19:40. A short corrective candle did form, but the price continued to move up to reach $100.37 by the session’s close, reclaiming the key resistance zone.
Indicators Corroborate Price Movements, Suggest Bullish Opening
Technical indicators validated most of the observed AMD trends. Early in the session, the MACD flashed a death Cross, which aligned with the steep opening decline. A golden cross near 16:00 UTC provided early confirmation of the upward recovery. Another death cross appeared around 18:00 UTC before the final breakout was supported by a third golden cross, in sync with bullish momentum. The RSI was overbought at the start of the session, aligning with the ensuing downtrend. For the rest of the session, it has been between the normal 30-70 levels. However, it climbed steadily to near overbought levels by session close, hinting at growing buyer strength.
Buyers May Push Price Up Early, Short-Term Reversals Highly Probable
With the AMD stock closing above the $100 resistance zone, the market sentiment is cautiously bullish. The MACD’s recent golden cross and the rising bars on the price chart reflect growing bullish momentum. The RSI is also nearing 70, indicating strength but also potential exhaustion if the bulls overextend. The market sentiment is cautiously bullish with the AMD stock closing above the $100 resistance zone. It will be worth noting whether the AMD price can hold above $99.50. Sustained buying could push Advanced Micro Devices toward $101.50–$102, while rejection might send the AMD price back toward the $98.20–$97.80 range.
Advanced Micro Devices (AMD) Price Analysis for May 12, 2025
The trading session for Advanced Micro Devices Inc. (AMD) showcased volatile price action within well-defined support and resistance levels. AMD’s price movements went through multiple brief trends before consolidating in a narrow trading range. The resistance around $103.20 and the support zone near $101.60 served as crucial boundaries throughout the session. The AMD stock opened at $102.58.
The session began with a bullish candle, leading the price close to the $103.2 resistance. This rise was met by a strong reversal to $101.7 by 13:40 UTC. An upward trend followed, pushing AMD’s price closer to the resistance level. This rally, however, met strong rejection at $103.20, initiating a swift downward reversal. A bearish trend followed, marked by consecutive red candles pulling the price back down to $101.8MACD confirmed the shift with a visible death cross at 14:20 UTC. This technical signal indicated a loss of bullish momentum.. The RSI also began its descent, reflecting increased bearish influence as the price approached the $102.00 zone again.
AMD, NASDAQ M-5 Chart, analyzed by raodevansh18, published on TradingView, May 12, 2025
AMD Stages Slow Mid-Session Recovery
The bears lost steam near the support level. From this point, the AMD price saw a significant rebound, launching another upward trend. A sequence of green candles confirmed renewed bullish interest. This upward push was validated by a MACD golden cross. At the same time, the RSI shifted back above the midline, showing a return to bullish momentum. However, the AMD price could not reclaim the earlier highs near resistance and capped near the $102.85 level. Another downward trend formed, dragging the price into a slightly lower high at $102.12.
At 16:10 UTC, the EMAs started converging and formed a golden cross soon. A slow and steady upward trend forms, pushing the price up to $102.8 by 17:45 UTC. From 17:45 UTC onward, AMD entered into a consolidation phase, moving sideways within a narrow band. This trading range reflected the indecision between buyers and sellers. While minor green and red candles alternated, neither side managed to break out of the horizontal channel decisively.
During this phase, the MACD remained relatively flat with minor fluctuations, and the RSI hovered around the midline, corroborating the lack of a directional movement. This range suggested that the market was awaiting for a decisive move or volume surge.
AMD Musters Final Resistance Test Near Closing, Rejected Again
Post 19:00 UTC, the Advanced Micro Devices stock took one final dig at the resistance with a bullish candle. But another rejection followed, pulling the price from the top of the range back below $103.00. The EMAs started converging towards the end of the session, suggesting bearish exhaustion. AMD closed the session at $102.82, slightly below the midpoint of the trading day, indicating neutral to mild bearish sentiment.
AMD Awaits Breakout After Range-Bound Session
The recent AMD price action has been defined by alternating short trends and a tight trading range. While bulls managed to push prices up from support levels twice, the resistance around $103.30 held firm. Momentum shifted between the bulls and the bears but lacked strong conviction in either direction by session close. If AMD can maintain the temporary support above $102, a bullish breakout could follow. Otherwise, further pullbacks may lead to renewed support retests.
Advanced Micro Devices (AMD) Stock Analysis for May 14, 2025
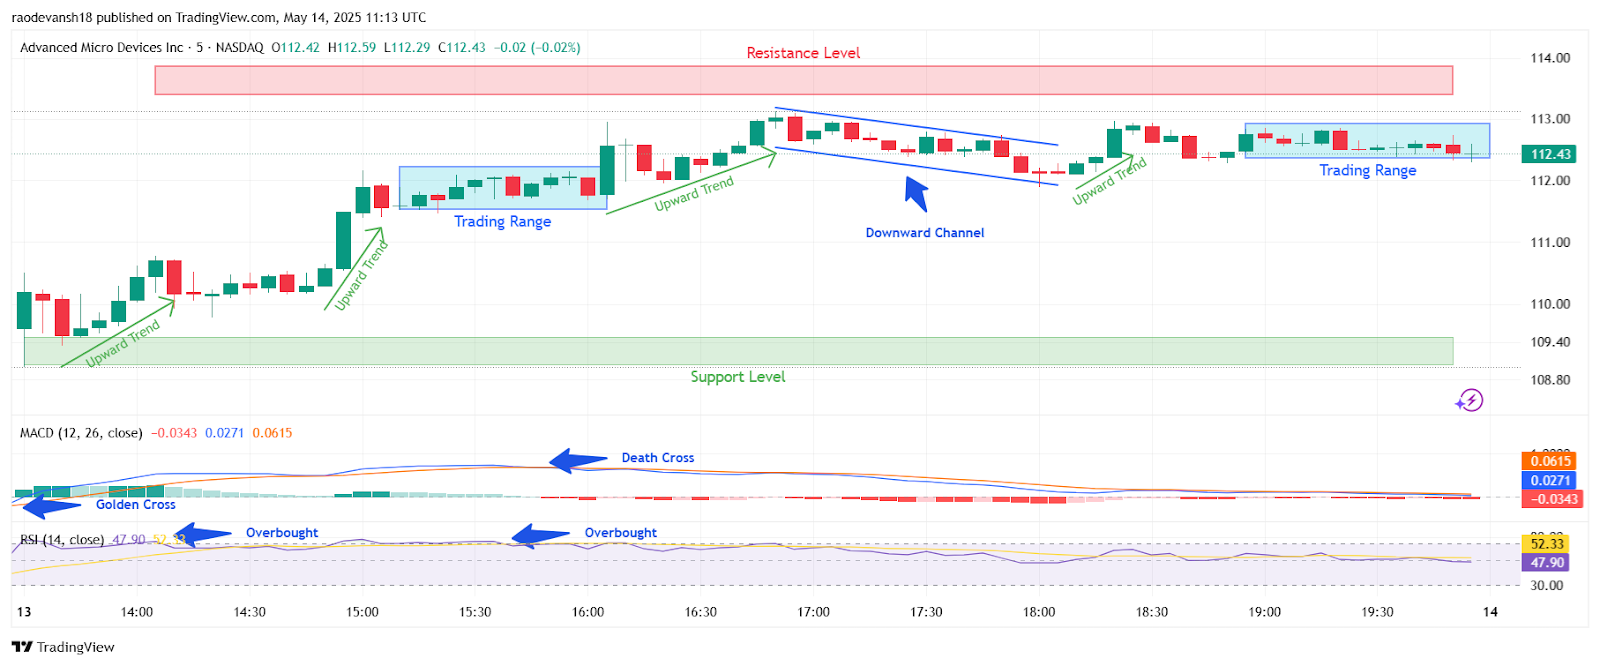
The trading session for Advanced Micro Devices (AMD) on May 14, 2025, showed price behavior dominated by clear trend phases and range-bound movements. The AMD stock opened with bullish momentum, but faced rejection at $113, and later faced corrective pressure in a descending channel. The technical indicators corroborated the price action accurately.
Upward Trends Establish Early Bullish Control
The Advanced Micro Devices stock opened at $109.60. In the early hours of the session, AMD stock retraced to $109.50 with red candles by 13:40 UTC. It soon began with a bullish move, climbing consistently through a clearly visible upward trend, going to $110.70 by 14:05 UTC. A slight correction occurred five minutes later, followed by a slow climb as AMD stood at $110.59 at 14:50 UTC. Further bullish movement was supported as the RSI entered the overbought zone, confirming heightened buying activity. As a result, AMD stock formed successive higher highs, reflecting bullish strength until the price hit resistance just below $112 at 15:00 UTC.
AMD – NASDAQ, M-5 Chart, analyzed by raodevansh18, published on TradingView, May 14, 2025
Following the initial push, the AMD price entered a sideways trading range. This phase indicated short-term indecision, as traders waited for further directional cues. The candles within this range fluctuated between $112.20 and $111.55, exhibiting consolidation despite the previously strong buying sentiment. During this period, both the RSI and MACD indicators flattened out, suggesting a temporary neutral stance. The MACD line ultimately formed a golden cross, which indicated a bullish trend. The price soon broke out upward at 16:05 UTC with a bullish candle, and an uptrend ensued, as the AMD stock went on to test the $113 resistance level by 16:50 UTC.
$113 Resistance Poses Strict Ceiling, AMD Consolidates Around $112
The bearish crossover finally caught up to the AMD price action, leading to a decline at 16:50 UTC. Shortly after the trading range, the AMD price began to decline, entering into a defined downward channel. This pullback brought the stock back toward the $112.00 level by 18:00 UTC. The pattern was marked by a series of lower highs and lower lows, indicating persistent selling pressure. The MACD histogram turned negative during this downtrend, and RSI moved closer to the neutral 50 line, reflecting cooling momentum.
This correction phase did not fully erase earlier gains, but it did reverse any bullish continuation. Despite occasional green candles, the price stayed confined within the descending channel until a breakout occurred closer to the end of the session, at 18:10 UTC. Post-breakout, the AMD price showed signs of recovery, climbing again in a brief upward trend. However, this rebound lacked the earlier conviction and soon entered another tight trading range near the $112.90 mark. Price consolidation resumed, with narrow-bodied candles and reduced volume indicating fatigue among both buyers and sellers. These technical conditions suggest that AMD stock may be setting up for a breakout or breakdown in the next session, depending on broader market cues and volume.
Advanced Micro Devices Sees Mixed Momentum, Awaits Breakout
Advanced Micro Devices (AMD) stock has shown short phases of bullish strength, but the price action has been heavily range-bound. Trading closed at $112.43, and the death cross looks to be widening towards the end of the day. This suggests bearish forces acting on the price. Given that, a slow downtrend may ensue early on. If some voluminous bullish strength ensues early tomorrow, AMD may soon test the resistance and break out above it.
Advanced Micro Devices (AMD) Stock Price Analysis for May 16
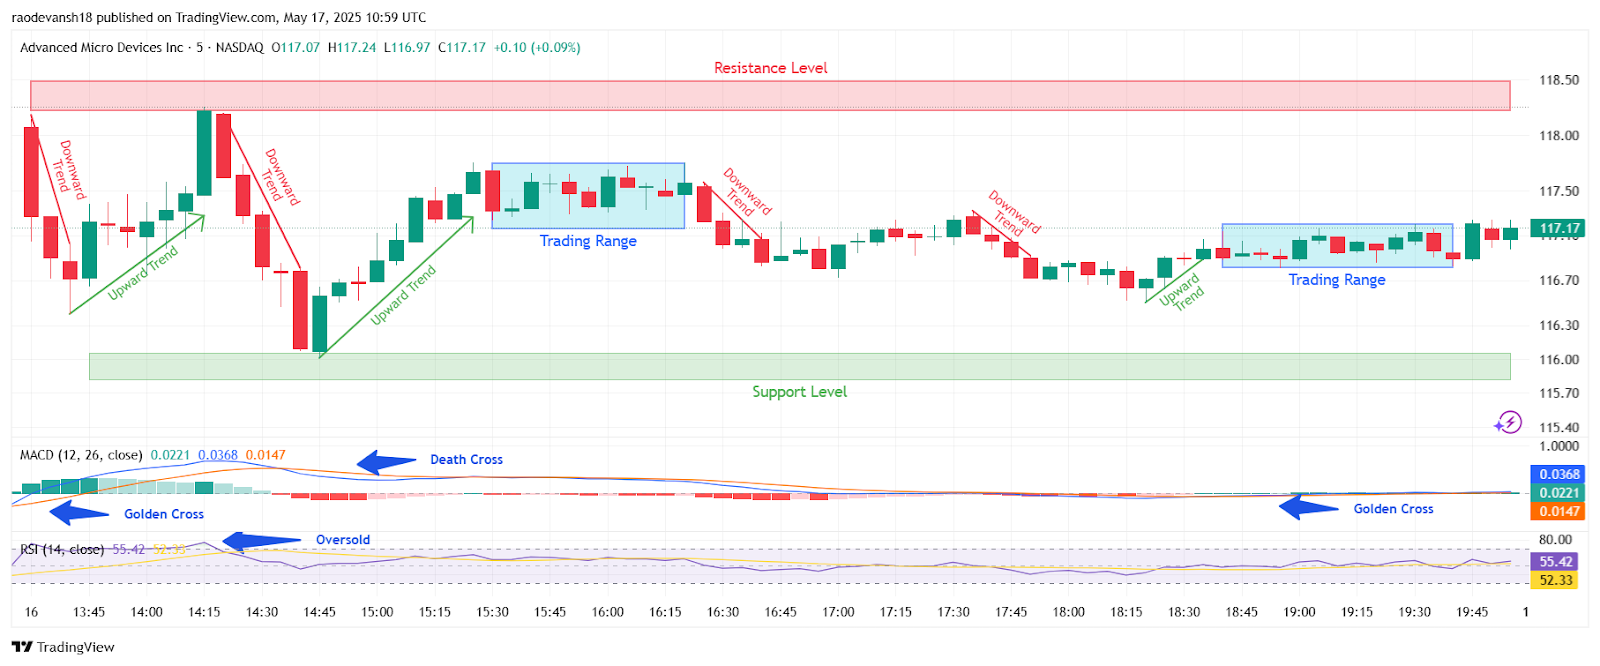
The Advanced Micro Devices (AMD) for May 16 displayed sharp intraday shifts as buyers and sellers battled around key zones. The session kicked off with a quick downward trend, as the AMD price dipped from the opening high near $117.30 and fell rapidly toward the $116.4 mark. However, bulls stepped in soon after, sparking an upward trend that reversed the early losses and lifted the AMD price back toward the $118.23 area. AMD’s advances were rejected at this level
The recovery was short-lived, as a downward trend took hold. This wave of selling sent the price plunging further, taking it to the session’s low near the strong support level at $116. The candle structure at this point showed a potential bullish reversal, and the AMD price began rebounding from the oversold zone. What followed was a clean upward trend, pushing price back to $117.67, marking a considerable gain off the low.
AMD, NASDAQ, M-5 Chart, analyzed by raodevansh18, published on TradingView, May 17, 2025
AMD Fails to Test Resistance Again, Strong Resistance at $117.75
The AMD price then entered a tight trading range between $117.15 and $117.75, where consolidation ensued for the next 45 minutes. During this period, AMD stock failed to move toward resistance, hinting at exhaustion on both sides. This was broken by another brief downward trend at 16:35 that took the AMD price closer to $116.80, though it did not touch the earlier low, finding a higher support.
Some gains came from this support as AMD rose to $117.30 by 17:30 UTC. But with the death cross on the MACD, it returned to $116.63 by 18:15 UTC. From 18:30 onward, the price again turned upward. A modest upward trend lifted the stock, and AMD entered another trading range at 18:40, oscillating tightly between $116.80 and $117.20. The final candles indicated a mildly bullish tone as the price closed near $117.17, reflecting a small but steady recovery post the mid-session drop.
Indicators Influence Price Action, Short-Term Bullish Action Expected
The MACD indicator showed a Golden Cross early in the session, accurately predicting the initial recovery. However, a Death Cross soon followed, coinciding with the price dip toward the $116 support. Another Golden Cross emerged near the close, supporting the late upward trend.
The RSI dropped below 30 during the midday dip, signaling oversold conditions around the $116 area. This aligned with the price rebound and confirmed buyer re-entry. Throughout the session, RSI remained within 30–70, reflecting no extreme conditions.
Potential Market Moves for AMD
Technical indicators on AMD stock point toward a cautiously bullish setup heading into the next session. The late Golden Cross on the MACD and the price’s ability to hold above the support level around $116 suggest that the downside might be limited in the short term. If momentum builds and volume picks up, the AMD price could attempt a move toward the resistance level near $118, which has rejected prior rallies.
On the other hand, if AMD fails to maintain strength above $117, a return to the $116.30–$116.00 zone remains possible. The RSI’s stable reading indicates there’s room for movement in either direction without being overextended. Traders should monitor MACD momentum and range breaks to determine intraday direction.
Overall, Advanced Micro Devices seems poised for consolidation with a slight bullish tilt. The previous session’s structure hints at accumulation, and a decisive close above $117.40 could confirm renewed buyer interest. Until then, expect the AMD price to hover within the familiar range, with minor surges and pullbacks as market participants position for the next breakout.


