

Are you someone who is contemplating investing in Aptos and is watching the charts regularly? Then let’s discover the latest Aptos price trends and see what technical indicators tell us about the Aptos blockchain’s native token. The start to 2025 has been sluggish for Aptos, losing close to 34% since January. The beginning of Q2, though, has shown immense promise for the Layer-1 blockchain. In addition, Aptos displays strong network fundamentals. Recent institutional interest has also boosted investor confidence in this relatively young ecosystem. Let’s dive into the latest Aptos token action and discern what’s next.
Aptos Price Analysis for May 1, 2025
The price consolidation on the Aptos chart is a clear case of market indecisiveness. The bulls and the bears are closely watching market action, looking for the best moment to act. The trading session commenced with the Aptos price at $5.408. Some stabilization was seen early, but Aptos slowly dropped to $5.344 by 1:45 UTC. The RSI also momentarily dipped into the oversold zone, calling for a potent bullish trend reversal. Aptos did start climbing the charts shortly after, but faced a stern ceiling at $5.445.

Chart 1: analyzed by raodevansh18, published on TradingView, May 1, 2025
The bullish Aptos trend lost steam, and the EMAs coincided as a trading range developed. Sideways consolidation occurred with the upper limit at $5.445 and the lower boundary at $5.391. This trend lasted till 7:20 UTC, when a downward Aptos breakout was finally seen, thanks to the death cross on the MACD at the same point. Aptos slipped to $5.36. This slight downturn led the RSI below 30.
Aptos Price Retracement Deepens Amid Resistance Rejections
Another Aptos trend reversal followed, a gentle uptrend going up to test the $5.445 resistance at 11:40 UTC. However, this test also turned out to be futile. The bearish crossover at noon confirmed the rejection, and a sharp downturn transpired. This downturn drove the APT price to $5.175 in the next two hours. The RSI also dipped as low as 18. Conditions were ripe for a strong bullish trend set off by the 14:10 golden cross.
The Aptos price climbed rapidly at first but faced several pullbacks. An upward channel formed as the price consistently touched higher highs and higher lows, going all the way up to $5.411 by 20:20 UTC. The RSI veered closer to the 70 mark, hinting at incoming bearish pressure. Twenty minutes later, a death cross formed, as Aptos stabilized. By midnight, the APT price stood at $5.362.
APT Price Finds Support Close By, $5.445 Resistance Break Imminent?
The stroke of midnight brought along a bullish crossover on the MACD, sparking a bullish Aptos trend. This uptrend pushed the price up to test the resistance by 2:30 UTC today. However, this attempt to break was also rejected. Having risen to the overbought zone, the RSI called for a bearish reversal. But, the ensuing reversal could only take Aptos to $5.372. Aptos has stabilized at this level as support and has been attempting to find enough bullish pressure to test the resistance. As of press time, Aptos was trading at $5.418.
What Do the Indicators Suggest for Aptos?
The RSI has spent most of its time above the midline, which suggests building bullish pressure. However, at the same time, it has failed to predict the intensity of the bullish trends. The same cannot be said about the downtrends. The sharp downturn continued yesterday evening despite the RSI showing heavily oversold conditions.
The MACD has effectively signaled trends promptly, except on a few occasions. The signal line has failed to move far above the MACD line. In the meantime, sustained death crosses have been seen. On some occasions, Aptos has resisted a death cross-induced downtrend with consolidatory phases.
Possible Scenarios for Aptos Price Today
As of the latest update, a golden cross has been seen. However, it does not look potent enough to cause a resistance break. This thesis is further corroborated by the fact that the RSI is already knocking at the door of the overbought zone. This means a reversal is due, and Aptos may soon see some retracement. If the APT price can hold on to a level near $5.350, a resistance test later in the day may be plausible. Otherwise, the $5.170 support may soon be in question.
Aptos (APT) Price Analysis for May 13, 2025
The Aptos price action has been confined to a range between $5.5 and $6.1 for the most part. Although some early bullish movement was seen, the APT price has failed to break beyond key resistance at $6.1, leading it to establish support at $5.5. The native token of the Layer-1 blockchain system has lacked decisive bullish pressure. The price stood at $5.870 as the trading session commenced. A golden cross formed early on, leading to a slight rise in prices. Aptos moved up to $5.99 by 1:00 UTC. However, a potent correction came with the slight death cross on the MACD. and Aptos returned to $5.810.
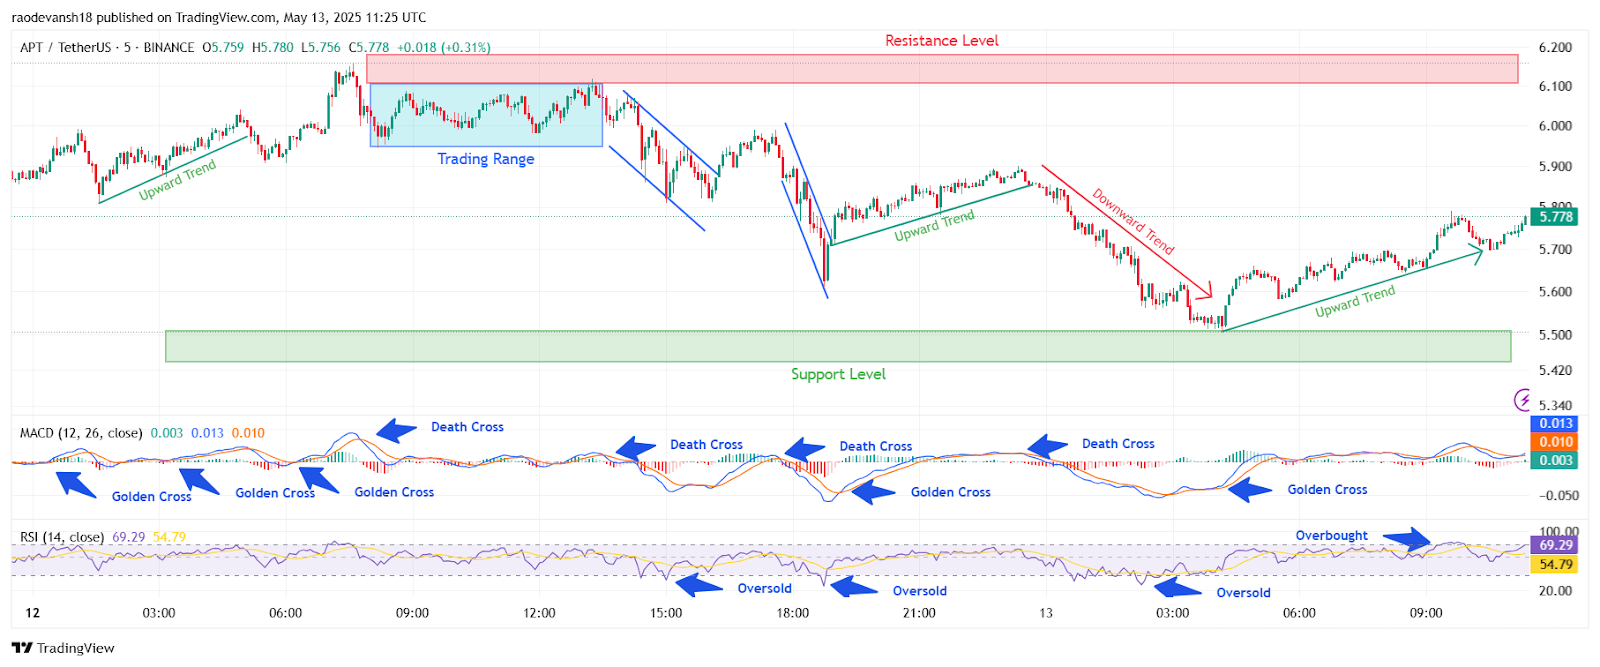
APT/USDT, analyzed by raodevansh18, published on TradingView, May 13, 2025
A slow but long uptrend started at this point, thanks to multiple golden crosses on the MACD. By 5:00 UTC, the price had risen to $6.025. The RSI was nearly overbought at this point, prompting a slight reversal. A short reversal to $5.900 did follow, but the price continued to climb to $6.137 by 7:00 UTC. The RSI spiked into the overbought region momentarily, followed by this rise, leading to a reversal to $5.950. A golden cross did form at this point, but the Aptos price movement was capped at the $6.1 level.
A long trading range formed, as the APT price failed to showcase a directional breakout. The upper boundary held strong at $6.080. At 13:10 UTC, the Aptos price tested the resistance again, but faced another rejection. This led to the bears regaining control over the price action. A downward channel ensued, and the price fell to $5.815 by 16:05 UTC. The RSI also forayed into the oversold region.
Rejection at $6.1 Leads to Strong Downtrend for APT Price
Investors expected a strong bullish comeback, but Aptos could only ascend to $5.990. Another channel formed as the APT price touched lower highs and lower lows consistently, bringing the price down to $5.61 by 18:45 UTC. The RSI displayed oversold conditions again, and a short bullish reversal to $5.77 was seen. The golden cross lasted till 22:55 UTC as the cautious bulls pushed the price slowly up to $5.900 by 23:30 UTC. At the same point, a death cross appeared, and the price started declining, signalling an extended downtrend.
Aptos Fails to $5.5 Support, Fails to Muster Strong Comeback
At midnight, the price stood at $5.830. The strong bearish trend pulled the price down incessantly. By 2:10 UTC, the price fell to $5.560. The RSI also dipped below 30, showing oversold conditions. However, the bulls did not capitalize on these conditions as a trading range formed. The downward APT breakout from this range led the price to establish support at $5.500. At 4:15 UTC, a wide golden crossover appeared on the MACD indicator, and the APT price found a slow, stable uptrend, leading the price up to $5.770. A slight correction has been made since, and the price stands at $5.769 as of the latest update.
Buyers Treading Cautiously, $5.5 Support Retests Possible for Aptos
Currently, the RSI is closing in on the overbought territory, which means that this slow uptrend is reaching exhaustion. If the bears regain control, a stable downtrend to the support level is highly likely. If a downward APT breakout below the support can be avoided, further gains will be easier to make for the token. Otherwise, conditions look ripe for the bears to reign supreme. In that case, $5.4 wil be a key level to watch.


