

Are you watching the Aptos market after today’s early breakout? The APT price surged from $5.70 to above $6.05 in a strong bullish wave, hinting at a possible continuation, until sellers took control near $6.10. A swift reversal followed, pushing the Aptos price back below key levels like $5.95. Technical indicators like RSI and MACD have since turned bearish, signaling a shift in sentiment. If you’re tracking APT Breakout patterns or looking for fresh entry zones, let’s walk through the key levels and market behavior over the last 24 hours.
Aptos (APT) Price Analysis For May 23, 2025
The APT price analysis shows a strong bullish push early in the day that eventually gave way to consistent selling pressure, as the Aptos price failed to maintain its momentum beyond the $6.10 level. The market started quietly, with APT consolidating within a narrow trading range of around $5.70 by 01:00 UTC. Momentum remained neutral during this phase, with the RSI holding steady and MACD showing a slight bearish bias through a death cross. Around 01:30 UTC, the APT price broke out of the range, marking a clean APT breakout. A sharp upward move followed, and the price entered an upward channel until 03:30 UTC.

Chart 1- APT/USDT M1 Chart, Analysed By Anushri Varshney, Published on TradingView, May 23, 2025
This bullish leg pushed the Aptos price steadily higher, from $5.70 to a peak above $6.05. During this uptrend, the MACD triggered multiple golden crosses, while RSI moved into overbought territory twice; once at 02:00 and again just before the top. However, signs of weakness started creeping in by 03:45 UTC. A rejection near $6.10 triggered a sharp shift. The MACD crossed bearish, and the RSI pulled back from overbought levels. The Aptos price began to unravel as the bullish momentum faded after 04:00 UTC.
APT Price Drops Below $5.95, Finds Support at $5.76 Amid Bearish Shift
By 04:00 UTC, APT had lost steam, sliding out of its upward channel. A short-lived attempt to regain control around 04:30 UTC led to another upward channel formation, but it failed to gain traction. From 05:00 UTC onward, the tone shifted decisively bearish. APT price broke below $5.95 and started forming lower highs and lower lows.
This marked the beginning of a larger downward channel that has continued into the present. Several death crosses on the MACD between 05:30 and 07:00 UTC reinforced the weakness, while the RSI consistently dropped into oversold zones around 25. By 07:45 UTC, APT touched intraday support near $5.76 and continues to hover just above that level. Despite brief attempts at bouncing, the indicators remain weak. With RSI holding below 30 and MACD still trending lower, buyers remain inactive.
APT Breakout Fails to Hold as Aptos Price Slips Into Bearish Zone
Despite an early APT breakout that pushed the Aptos price above $6.05, bullish momentum couldn’t hold through the session. Repeated rejections near $6.10 and a series of death crosses on the MACD signaled fading strength as the market shifted into a bearish trend. The downward channel that formed in the latter half of the day clearly shows sellers are now in control, with the APT price struggling to stay above key support at $5.76. RSI consistently dipping into the oversold region highlights the weakness, and unless a strong reversal emerges, any bounce is likely to face immediate resistance near $5.90 and $6.00.
Traders should watch for a MACD golden cross or a clean breakout above the descending channel before anticipating a recovery. Until then, the APT price remains vulnerable, and short-term sentiment leans bearish. The next move will likely depend on whether bulls can defend $5.70 or if further downside opens toward $5.65.
Aptos (APT) Price Analysis For May 30, 2025
The APT price analysis showcased a volatile session with sharp movement early on, followed by sideways consolidation and a late-stage recovery attempt. The Aptos price opened the day weak near the $5.15 mark before facing heavy selling pressure. A strong breakdown occurred just after 00:20 UTC, pushing the pair below key support at $5.00. This move triggered a clear APT Breakout to the downside, with the price dropping sharply to $4.78 within minutes.
At the same time, the MACD printed a death cross, and RSI dipped below 30, confirming an oversold zone around 00:30 UTC. Buyers stepped in quickly at the $4.78 support level, and a rebound followed. By 01:00 UTC, the Aptos price had climbed back toward the $4.94 zone, but the recovery stalled under fresh resistance at $5.05.
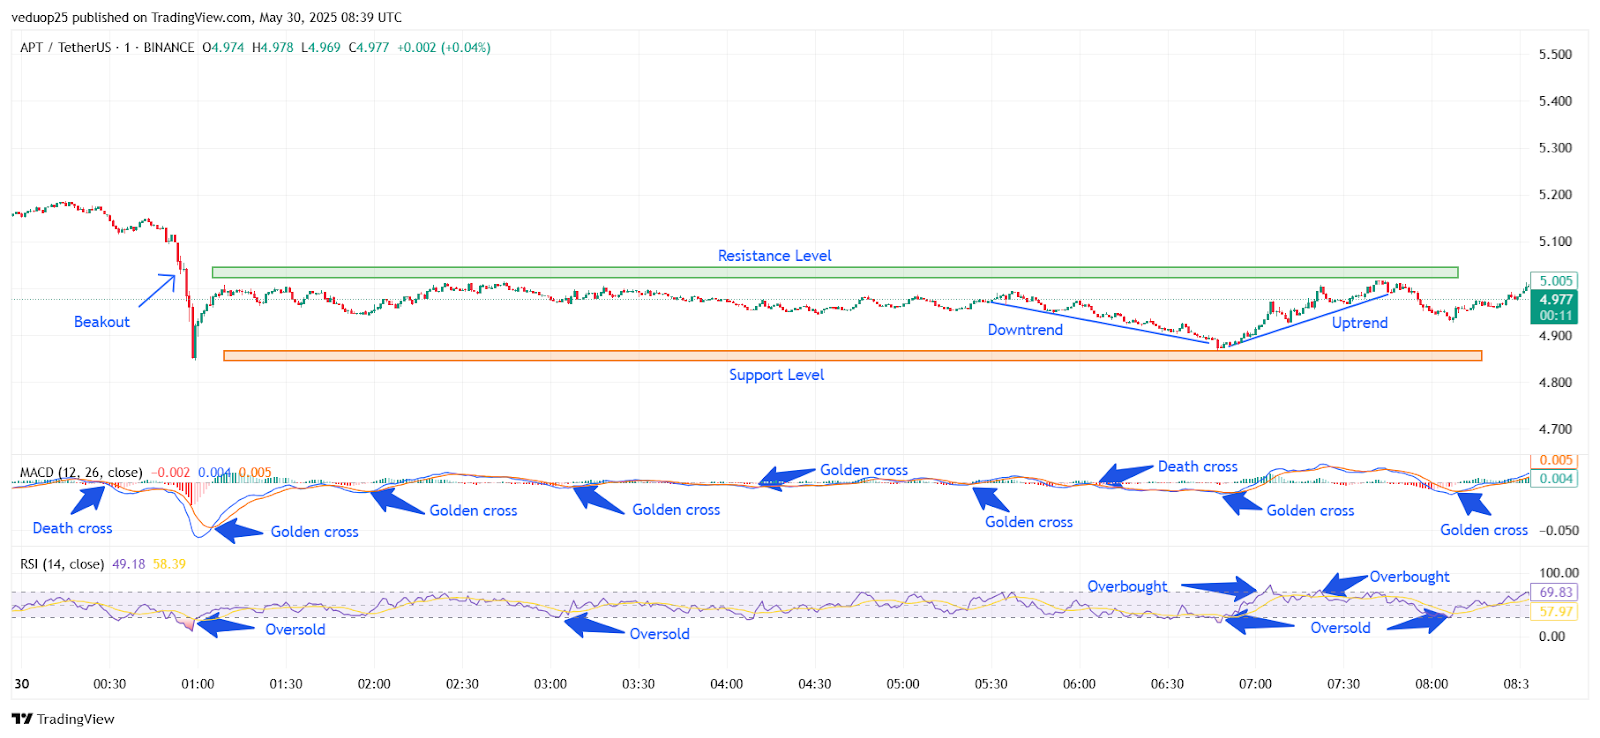
Chart 2- APT/USDT M1 Chart, Analysed By Anushri Varshney, Published on TradingView, May 30, 2025
From 01:30 to 05:00 UTC, APT traded in a narrow range between $4.92 and $5.02. The chart showed frequent MACD golden crosses, but no major volume confirmed the moves. RSI stayed near 50, reflecting indecision in the market. During this period, bulls and bears struggled for control while the price remained capped below the resistance.
APT Price Rebounds from $4.88 to $5.00
A slow decline started building from 05:15 UTC as APT slipped from $5.00 to $4.88 by 06:15 UTC. This mini downtrend formed after another MACD death cross and a weakening RSI. Price action touched the lower support band once again, but no new low was made, showing that buyers were still active around $4.88.
From 06:30 UTC onward, the APT price began forming a gradual uptrend. With back-to-back MACD golden crosses and rising RSI values, momentum returned. The price moved steadily from $4.88 back toward $5.00. RSI briefly entered overbought territory at 07:15 UTC and again at 08:00 UTC, signaling strong buying pressure. By 08:30 UTC, the Aptos price tested the $5.00 mark, attempting a reversal from the earlier breakout zone. Although resistance still holds between $5.03 and $5.07, the bullish momentum is building, with MACD staying positive and RSI near 70.
APT Key Levels in Focus After Volatile Session
The Aptos price closed the day with signs of recovery after a sharp early drop and steady consolidation. The major APT Breakout to the downside early in the session tested strong support near $4.78, which held firm throughout the day. Bulls pushed the APT price back toward the $5.00 zone, signaling growing strength, but the resistance between $5.03 and $5.07 continues to block further upside. MACD is now in positive territory, and RSI remains elevated near 70, suggesting momentum is leaning bullish heading into the next session.
For any real progress, the Aptos price must break and hold above the $5.07 resistance. If it fails to do so, the price could revisit the support range near $4.88. Overall, the market structure is shifting gradually in favor of the bulls, but confirmation will only come with a sustained APT Breakout above resistance backed by stronger volume.
Aptos (APT) Price Analysis For June 3, 2025
Today’s Aptos Price opened near $4.86 and moved in well-defined phases through the session. At 00:15 UTC, APT broke out from a narrow range, climbing steadily into an upward channel. This APT Breakout was backed by a golden cross on the MACD and rising RSI. The price touched $4.91 by 00:45 UTC. A second golden cross followed before 01:00 UTC, confirming bullish momentum.
Between 01:00 and 02:00 UTC, the Aptos Price hovered near the channel’s top. But by 02:15 UTC, the price reversed from $4.93, entering a downward channel. MACD turned bearish with a death cross at 02:20 UTC, followed by another at 03:30 UTC, keeping selling pressure high. RSI dipped below 30 during this stretch, confirming oversold momentum.
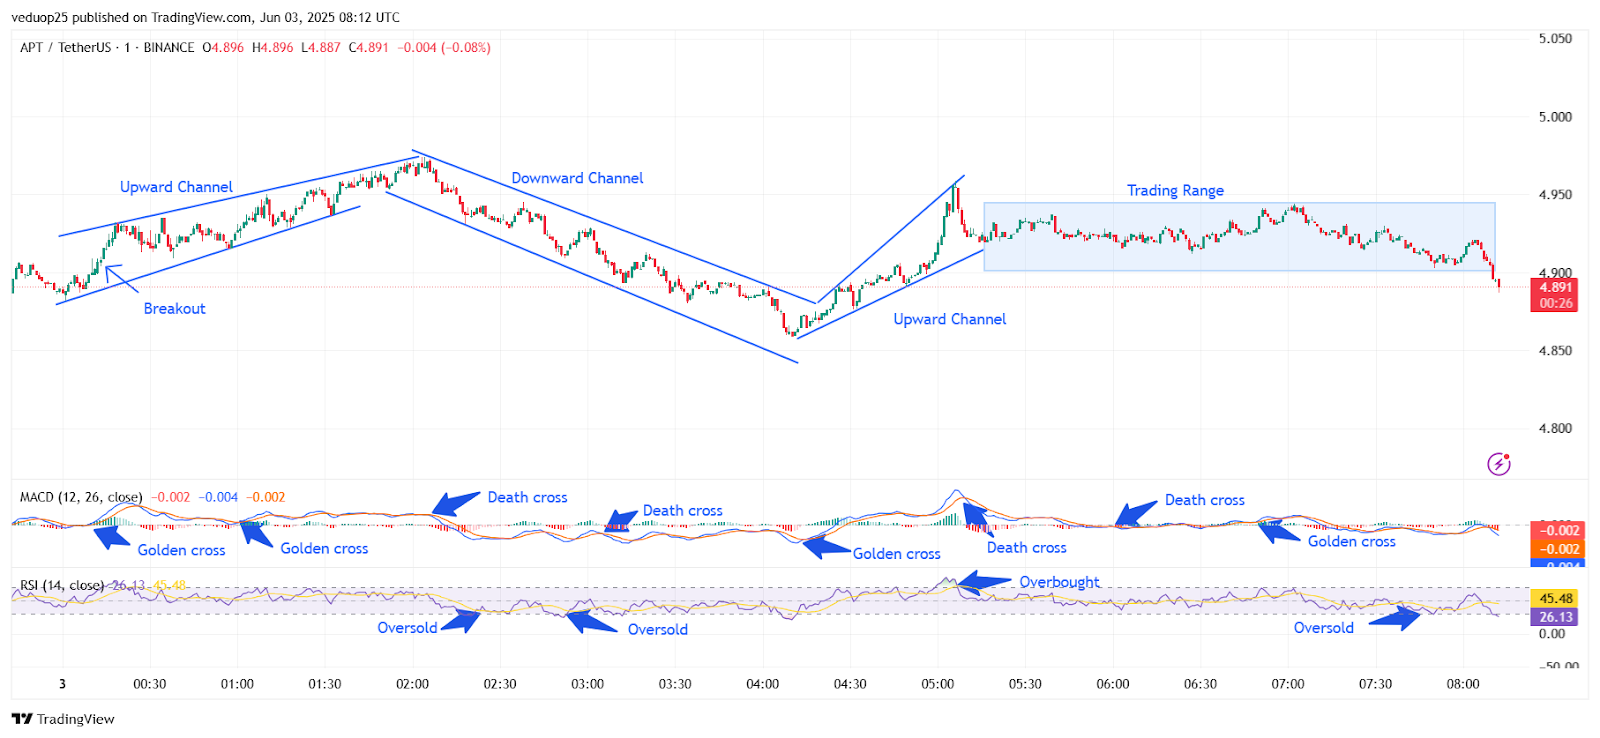
Chart 3- APT/USDT M1 Chart, Analysed By Anushri Varshney, Published on TradingView, June 3, 2025
A second death cross formed at 03:30 UTC, keeping pressure on the market. The price touched a session low of $4.87 at 04:00 UTC. However, buyers stepped in shortly after. Another golden cross and a fresh upward channel formed by 04:30 UTC. RSI recovered, pushing the price back above $4.92.
APT Price Pulls Back After $4.97 Spike, Slips Into Sideways Zone
By 05:00 UTC, APT spiked to $4.97. RSI hit overbought territory, and MACD gave a final golden cross. This was the peak of the recovery. A quick pullback followed. By 05:30 UTC, a sharp candle dropped the Aptos Price below $4.92. MACD flipped into a death cross again.
From 06:00 UTC onward, APT price moved sideways in a narrow range between $4.89 and $4.95. This range continued for several hours with low momentum. RSI hovered around 45, and MACD gave multiple weak crosses, signaling low conviction and volatile market behavior. At 07:30 UTC, RSI again touched the oversold line but bounced slightly. By the end of the session at 08:00 UTC, APT traded at $4.891, near the lower edge of its intraday range. The coin closed with little change, as early gains from the APT breakout faded through the session’s second half.
APT Price Stalls After Volatile Session
The APT Price ended the session with no clear direction after a day of sharp swings. The early APT Breakout triggered strong momentum, but the move could not hold above $4.97. A clean upward channel formed early, followed by a steep drop that created a downward channel through the mid-session. RSI moved between overbought and oversold multiple times, showing unstable sentiment. MACD crosses aligned well with each trend shift, confirming the price action. The Aptos Price eventually settled into a tight trading range between $4.89 and $4.95 for the final few hours.
This reflects low conviction from both buyers and sellers. With support near $4.87 and resistance near $4.97, the next move will depend on a breakout from this range. Traders should watch for another APT breakout backed by rising RSI and a MACD golden cross before entering. Until then, the price is likely to remain sideways.
Aptos (APT) Price Analysis For June 5, 2025
The APT price analysis shows a clean sequence of patterns, with steady shifts between ranges, channels, and key indicator signals. The Aptos price opened around $4.79 and moved sideways inside a tight trading range to 00:30 UTC. No strong momentum was present during this phase. At 00:35 UTC, APT entered an upward channel after a golden cross formed on the MACD. RSI began rising and crossed 70, pushing the Aptos price above $4.83 by 00:50 UTC. But this rally didn’t last. A quick reversal followed as a death cross appeared around 01:15 UTC. APT shifted into a downward channel, and the RSI dipped toward the oversold zone. This move continued until 01:50 UTC, where the APT price bottomed near $4.74.
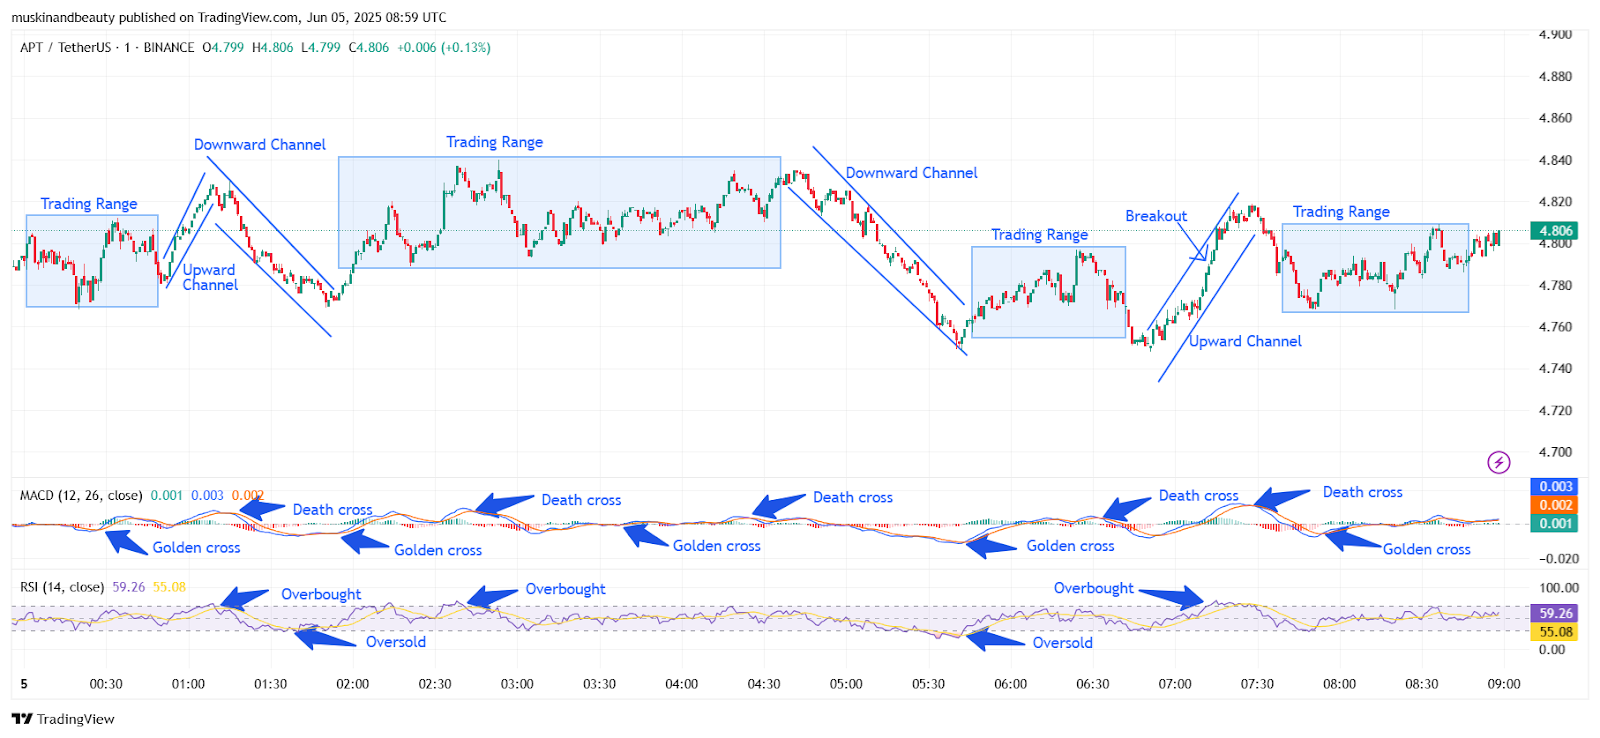
Chart 4- APT/USDT M1 Chart, Analysed By Anushri Varshney, Published on TradingView, June 5, 2025
From 02:00 UTC, the pair entered a broader trading range between $4.74 and $4.80. It stayed inside this range for over 90 minutes. During this period, MACD gave mixed signals, two golden crosses and two death crosses, while the RSI remained mostly flat at around 50, showing indecision. Another downward channel began forming around 04:30 UTC. This drop was backed by a fresh death cross on the MACD and RSI falling below 30. The APT price slid to a session low of around $4.72 by 05:45 UTC. But the recovery came quickly. At 06:00 UTC, he RSI moved out of oversold territory, and a golden cross appeared.
Sharp APT Breakout Followed by Range-Bound Cooldown
A clean APT breakout happened at 06:30 UTC. The price broke out from the range with strength, supported by rising volume and multiple bullish candles. The Aptos price surged from $4.73 to $4.83 in 30 minutes, forming a sharp upward channel. RSI once again touched overbought, confirming momentum. However, from 07:15 UTC, the rally lost steam. By 07:30 UTC, a death cross appeared, and the price settled back into a narrow trading range between $4.77 and $4.81. This range persisted through the rest of the session. MACD showed mixed signals again, and RSI hovered near 55.
By 08:59 UTC, the APT price is holding around $4.806 with a slight daily gain. The session featured sharp reversals, one solid APT breakout, and clean technical formations. Momentum is still moderate, and $4.83 now stands as the short-term resistance to watch going into the next session.
APT Price Holds Steady After Breakout and Reversal
The Aptos price wrapped up the day near $4.806 after well-formed moves across trading ranges and channels. The most notable moment came during the sharp APT breakout at 06:30 UTC, which briefly pushed the APT price back toward $4.83 before momentum faded. Indicators like MACD and RSI aligned well with each trend shift, especially during the early upward push and the later recovery phase.
However, the inability to hold above $4.83 shows resistance is still strong at that level. The repeated appearance of trading ranges throughout the session also suggests caution among traders. Overall, the Aptos price remains in a neutral-to-slightly bullish position as long as it stays above the $4.74 support. For a stronger continuation, the bulls need a clean close above $4.83 with volume. Until then, the APT price is likely to trade sideways with short bursts of volatility around key zones.
Aptos (APT) Price Analysis For June 7, 2025
The APT price analysis shows a clean pattern of upward momentum, short pullbacks, and well-defined channels. The Aptos price started the day at around $4.68, with early signs of strength forming inside a rising channel. By 01:15 UTC, the price moved steadily from $4.68 to $4.75. APT formed a strong upward channel, supported by a golden cross on MACD and an RSI push toward the overbought zone. This was the first sign of bullish control. By 01:20 UTC, the trend reversed briefly as a downward channel emerged.
Between 01:20 and 01:50 UTC, the price dipped back to $4.715, with RSI nearing oversold and a temporary cool-off in momentum. Momentum picked up again around 01:55 UTC. A clean APT breakout occurred inside a new upward channel. Between 02:00 and 03:15 UTC, the Aptos price moved sharply from $4.715 to $4.79.
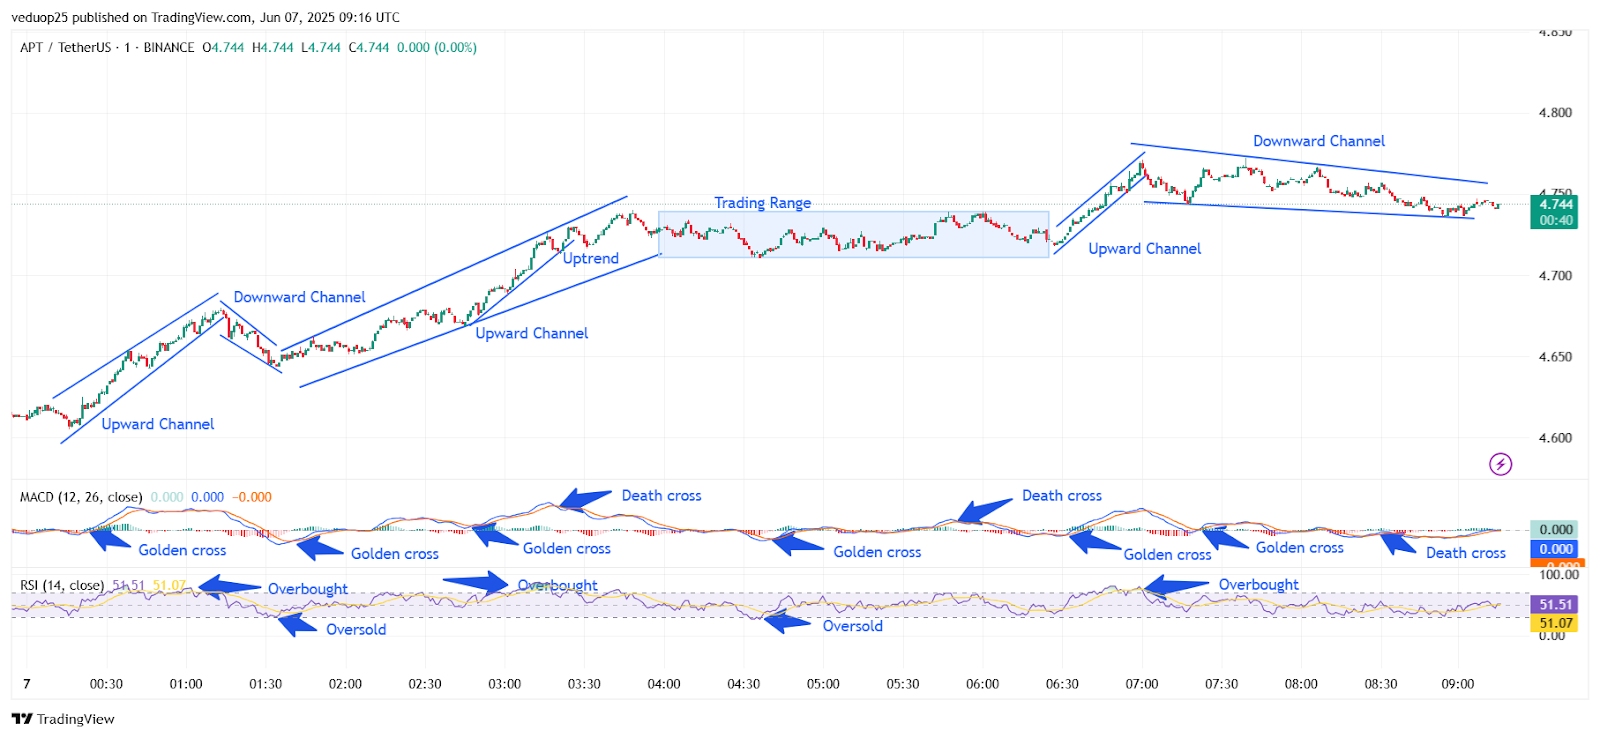
Chart 5- APT/USDT M1 Chart, Analysed By Anushri Varshney, Published on TradingView, June 7, 2025
MACD confirmed strength with another golden cross, and RSI touched overbought levels again. This was the most aggressive upward move of the session. From 03:20 to 05:30 UTC, the APT price entered a sideways trading range between $4.77 and $4.79. A minor death cross formed, but price action stayed stable, indicating a consolidation phase.
APT Breakout Fades as Price Slides into Downward Channel
Around 05:35 UTC, buyers stepped back in. A short APT breakout occurred between 05:45 and 06:15 UTC, sending the price from $4.76 to $4.81 inside a new upward channel. RSI briefly crossed into overbought, and MACD showed a small bullish crossover. After peaking at $4.81, the Aptos Price started drifting lower inside a wide downward channel. From 06:20 to 09:00 UTC, the price steadily declined from $4.81 to $4.73, facing resistance on each bounce attempt.
A final death cross appeared on MACD near 08:50 UTC, and RSI dropped back toward the midline. The final stretch between 09:00 and 00:00 UTC saw a narrow range forming between $4.73 and $4.75, showing low volatility. MACD stayed flat, and RSI hovered near 51, reflecting balanced pressure on both sides.
APT Forms Multiple Channels with Precise APT Breakouts
The APT price showed strong technical structure throughout the session, forming three upward channels, two downward channels, and a defined trading range. The first APT breakout came early, followed by a sharper move during the second breakout phase around 02:00 UTC. These moves were well-supported by golden crosses on the MACD and overbought signals on the RSI. Later in the day, the Aptos price slowed down inside a tight range before forming another upward channel, briefly touching $4.81.
However, selling pressure increased, pulling the APT price into a downward channel in the final hours. Multiple death crosses and neutral RSI confirmed the weakening momentum. By the end of the day, the Aptos price settled near $4.744, with indicators showing balance. If support holds above $4.73, another APT breakout is possible. But failure to reclaim $4.81 may keep the APT price in a near-term range.
Aptos (APT) Price Analysis of June 11, 2025
The APT price analysis highlighted a clean shift from weakness to strength. Aptos price started the day at $5.18 but quickly turned lower. From 00:00 to 01:45 UTC, the pair dropped inside a sharp downward channel. APT price fell from $5.18 to $5.06 as consistent selling pressure took over. RSI confirmed an oversold reading by 01:15 UTC, and a MACD golden cross at 01:30 UTC hinted at a possible reversal.
By 01:45 UTC, the trend flipped. APT price entered an upward channel and climbed from $5.06 to $5.15 by 03:00 UTC. The MACD showed a second golden cross, while RSI reached overbought levels near 02:45 UTC. However, the bulls couldn’t hold momentum. After 03:00 UTC, Aptos price fell again, starting another downtrend. From 03:00 to 04:30 UTC, the pair dropped from $5.15 to $5.04. MACD flashed two death crosses during this decline, while RSI dipped near oversold around 04:30 UTC.
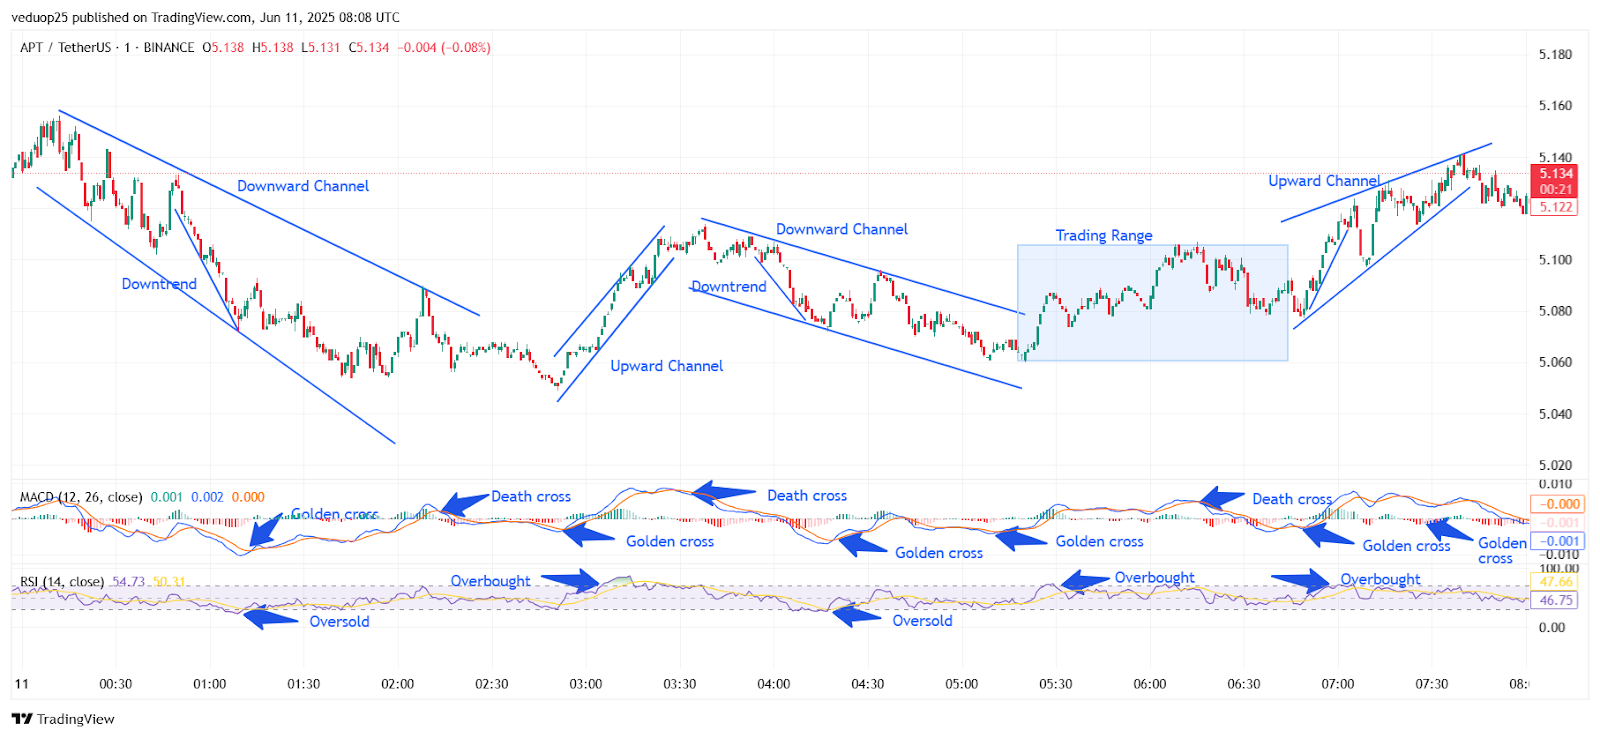
Chart 6- APT/USDT M1 Chart, Analysed By Anushri Varshney, Published on TradingView, June 11, 2025
Between 04:30 and 05:30 UTC, APT price moved sideways in a tight trading range between $5.04 and $5.10. This period stayed flat as both MACD and RSI showed no strong momentum. A golden cross on the MACD right before 05:30 UTC marked the start of the next move. The APT breakout began at 05:30 UTC. Aptos broke out of the range and moved into a fresh upward channel. Price rose steadily from $5.08 to $5.14 between 05:30 and 07:30 UTC. The RSI entered overbought territory multiple times, at 06:00, 07:00, and again near 07:15 UTC.
APT Breakout Holds Above $5.08 as Bulls Eye $5.18
MACD showed two golden crosses during this phase, signaling strong bullish pressure. There was a brief death cross at 06:45 UTC, but price action stayed unaffected. From 07:30 to 08:00 UTC, the rally slowed. APT price slightly pulled back from $5.14 to $5.13 as RSI cooled down. MACD stayed flat, reflecting neutral sentiment at the end of the session. After falling into two downward channels, the price formed a tight range and finally broke out upward. Momentum from the APT breakout remains strong as long as $5.08 holds as support. If bulls reclaim $5.14 with volume, the next move could test $5.18 again.
APT Eyes Higher Levels After Breakout
The Aptos price structure over the last 24 hours reflected a strong recovery after early selling. The first half of the day was dominated by two clean downtrends, both marked by oversold RSI signals and MACD death crosses. However, momentum began to shift after 04:30 UTC, as the APT price moved into a stable range. The breakout that followed post-05:30 UTC was backed by rising RSI, multiple MACD golden crosses, and steady volume. This breakout took APT from $5.08 to a high of $5.14 before cooling slightly.
The APT breakout remains valid if the price is above the $5.08 support zone. Current momentum looks healthy, but bulls must reclaim and hold above $5.14 to target the $5.18 level again. If RSI remains steady and MACD stays positive, Aptos could extend gains in the next session. Traders should watch the next move closely for $5.08 support and $5.15 resistance.
Aptos (APT) Price Analysis For June 16, 2025
The APT price analysis shows a clean mix of reversals, steady trends, and breakout strength across multiple zones. The APT price opened near $4.58 and started slipping inside a downward channel. By 01:45 UTC, sellers kept control. Price gradually fell from $4.58 to $4.50. Momentum stayed weak, but a golden cross formed on MACD around 01:30 UTC. RSI was near oversold, hinting at a possible bounce. That bounce turned into a sharp APT breakout at 01:45 UTC. Price shot up from $4.50 to $4.63 in just 30 minutes. A strong upward channel formed, backed by another golden cross and an RSI spike to overbought. This marked the first major bullish wave in the Aptos price movement.
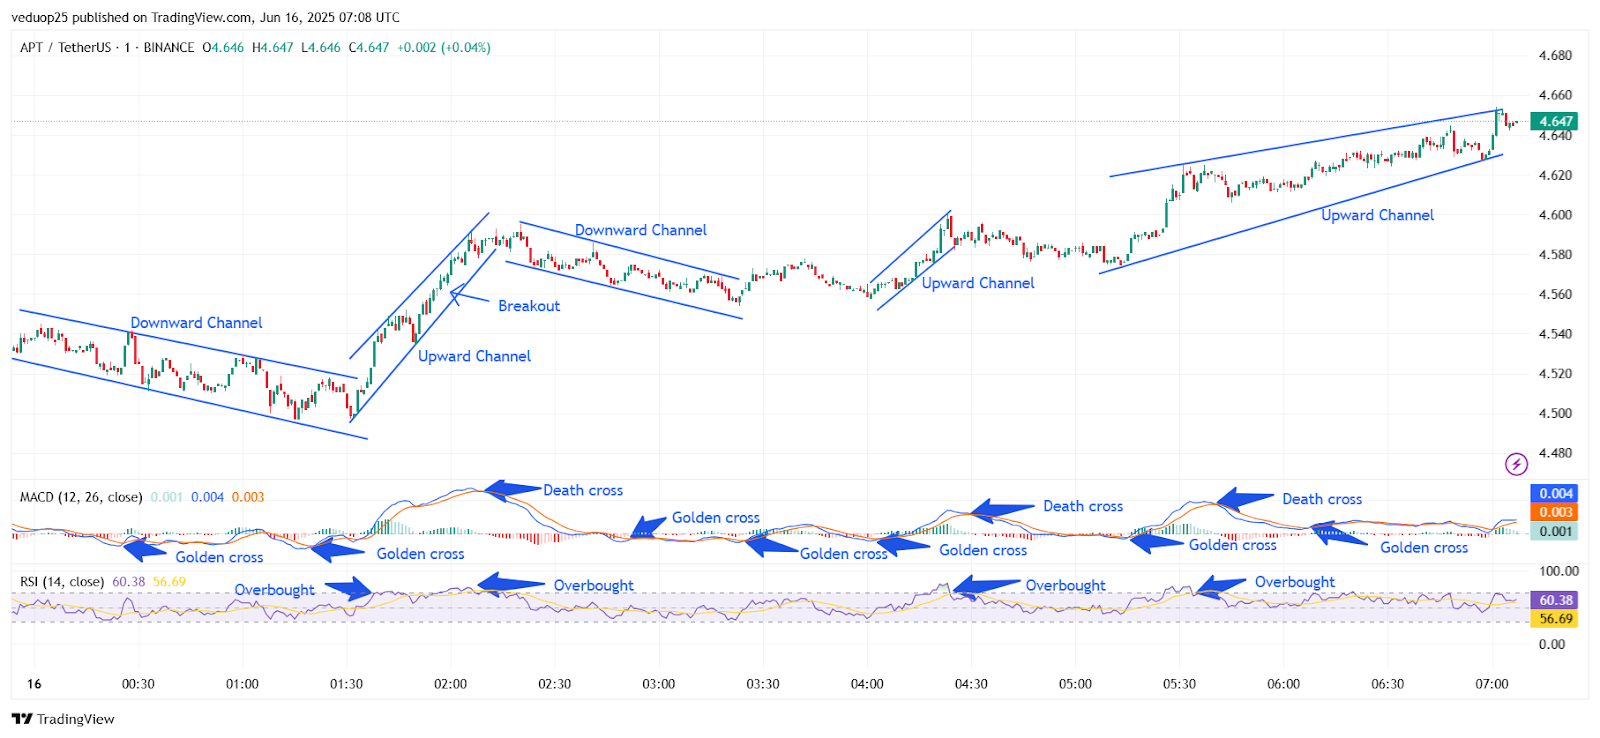
Chart 7- APT/USDT M1 Chart, Analysed By Anushri Varshney, Published on TradingView, June 16, 2025
But by 02:30 UTC, the momentum slowed. A small death cross appeared on the MACD, and the price pulled back into a second downward channel. Between 02:30 and 03:15 UTC, APT dipped from $4.63 to $4.55. RSI cooled below 60, but no panic selling appeared. Buyers came back strong around 03:15 UTC. A golden cross showed up again, and the price started moving in a new upward channel. From 03:15 to 04:00 UTC, the APT price climbed from $4.55 to $4.60. MACD showed steady bullish signals, and RSI slowly climbed higher.
APT Price Holds Steady in Rising Channel with Strong Bullish Signals
From 04:00 to 04:45 UTC, the price held steady near $4.60. Another golden cross reinforced buyer control. The next leg came at 04:45 UTC, with a clean rise from $4.60 to $4.62. RSI entered overbought again, confirming fresh demand. Between 05:00 and 06:00 UTC, APT traded inside a wider upward channel. Price slowly pushed from $4.62 to $4.66. A final golden cross came around 05:45 UTC. RSI held above 70 again, reflecting consistent bullish interest. From 06:00 to 07:00 UTC, the Aptos price stayed stable inside the rising channel. Price hovered between $4.64 and $4.66. MACD momentum remained green, and RSI stayed above 60. Buyers remained in control.
APT Breakout Holds as Bulls Maintain Control
The APT price closed the session strong, riding a clean upward channel after multiple golden crosses and RSI overbought signals. Each move by Aptos price showed strength in every move up as buyers came back in each time it dipped, only to find their strength quickly bought back up. The APT breakout move from $4.50 to $4.63 was an indication of a change in momentum for the rest of the trading session. The bullish momentum remained in place, even in the briefest periods of consolidation, with RSI consistently above the 60 level. The Aptos price maintained itself above the $4.62 level in the final moments before the end of the next trading session. This move indicates buyers still have confidence in the APT price,
If the APT price continues to respect the rising channel, bulls could be looking at levels of $4.70 next. A sudden MACD death cross or a slip in RSI below 50 could be the first signs of some short-term weakness. Overall, the trend remains positive as long as the support level of $4.62 holds. The bias remains bullish heading into the next period or trading session, as long as that $4.62 level holds in support, then the APT breakout structure remains intact.


