

If you want to invest in or buy Arbitrum and wonder what the right price to start accumulating the Arbitrum token is, then you are at the right place. As we go through the analysis, we will determine different patterns and how Arbitrum reacts to them. We will also see support and resistance, which is a good area for any instrument to buy or sell. Without any further delay, let’s dive into the Arbitrum price analysis and explore different opportunities arising from it.
Arbitrum (ARB) Price Analysis of May 27, 2025
ARB opened the session with a sharp reversal from the high, set within an expanding triangle pattern. A series of downside breakouts followed, each supported by death crossovers on the MACD, driving the Arbitrum price to the day’s low at $0.3798. This sell-off established a support zone, which eventually gave way, leading to rapid volatility as the price formed and broke through multiple triangle and channel formations. Throughout the session, MACD and RSI provided critical signals, with frequent golden crossovers triggering recovery spikes and repeated RSI extremes hinting at the market’s instability.

Chart 1: ARB/USDT M1 Chart, Analysed by vallijat007, published on TradingView, May 27, 2025
The ARB price formed an expanding triangle pattern, which marked the high for the day at $0.3944 and broke out to the downside at 00:20 UTC, supported by a death crossover of MACD. Price moved lower and formed a downward-moving channel. The downward-moving channel broke out to the downside at 00:51 UTC, again supported by a death crossover of MACD, but failed to create a breakout spike. A support area was established at $0.3882. This support level broke to the downside at 01:01 UTC, supported by a death crossover of MACD, pushing the price to the low for the day at $0.3798 and forming a minor range.
Failed Channel Breakout Leads to Triangle Pattern
The minor range broke out to the upside at 01:24 UTC, supported by a golden crossover of MACD. Price spiked to the upside and formed a converging triangle pattern. At 01:50 UTC, the converging triangle pattern broke higher, supported by a golden crossover of the MACD. The price rose sharply and created an expanding triangle pattern. At 02:21 UTC, the expanding triangle broke out higher, supported by a golden crossover of MACD. The price rose sharply and then formed a range.
At 02:25 UTC, the RSI went above 70, which suggests the market is overbought and may reverse or at least pull back. The range moved higher at 03:03 UTC, supported by a golden crossover of MACD. The price rose sharply and then formed a channel that moved downward. At 04:07 UTC, the downward channel attempted to breakout to the upside, but the attempt failed and price formed a triangle pattern. At 04:55 UTC, the converging triangle broke down, following a death crossover of MACD.
A minor range is formed in the ARB price. The minor range broke out to the downside at 05:05 UTC, supported by a death crossover of MACD, and another range followed. At 05:17 UTC, RSI dropped below 30, indicating oversold market conditions and suggesting a reversal or at least a pullback. The range broke out to the upside at 05:35 UTC, supported by a gold crossover of MACD. If the breakout succeeds, the Arbitrum price may rise to $0.4000. If it fails, the price may drop to $0.3750.
Momentum Builds as ARB Token Tests Directional Breakout
After a volatile session of false breakouts and quick reversals, the ARB price now sits at an inflexion point. The recent breakout to the upside from the range, backed by a golden MACD crossover and occurring just after RSI hit oversold levels, suggests bullish recovery potential. If follow-through develops, the Arbitrum price could rally toward the $0.4000 resistance zone. However, failure to sustain the move could send ARB back toward $0.3750, testing prior support. Traders should look for confirmation before entering trades. Clean breakouts with volume will be key to defining the next leg of price direction.
Arbitrum (ARB) Price Analysis June 3, 2025
Arbitrum price action on June 3 reflected a day of mixed signals and failed momentum. The session opened with a breakout from a downward-moving channel supported by a golden crossover of MACD, briefly lifting the price into an upward-moving channel. However, RSI quickly crossed into overbought territory, warning of exhaustion. The ARB price reached a high of $0.3692 during this rally before turning lower. A series of sharp reversals followed, with MACD signaling both bullish and bearish crossovers throughout. Eventually, the price fell to a low of $0.3557, showing signs of weakness. Ranges dominated, with little sustained trend direction. Currently, the Arbitrum price is trading at $0.3630.
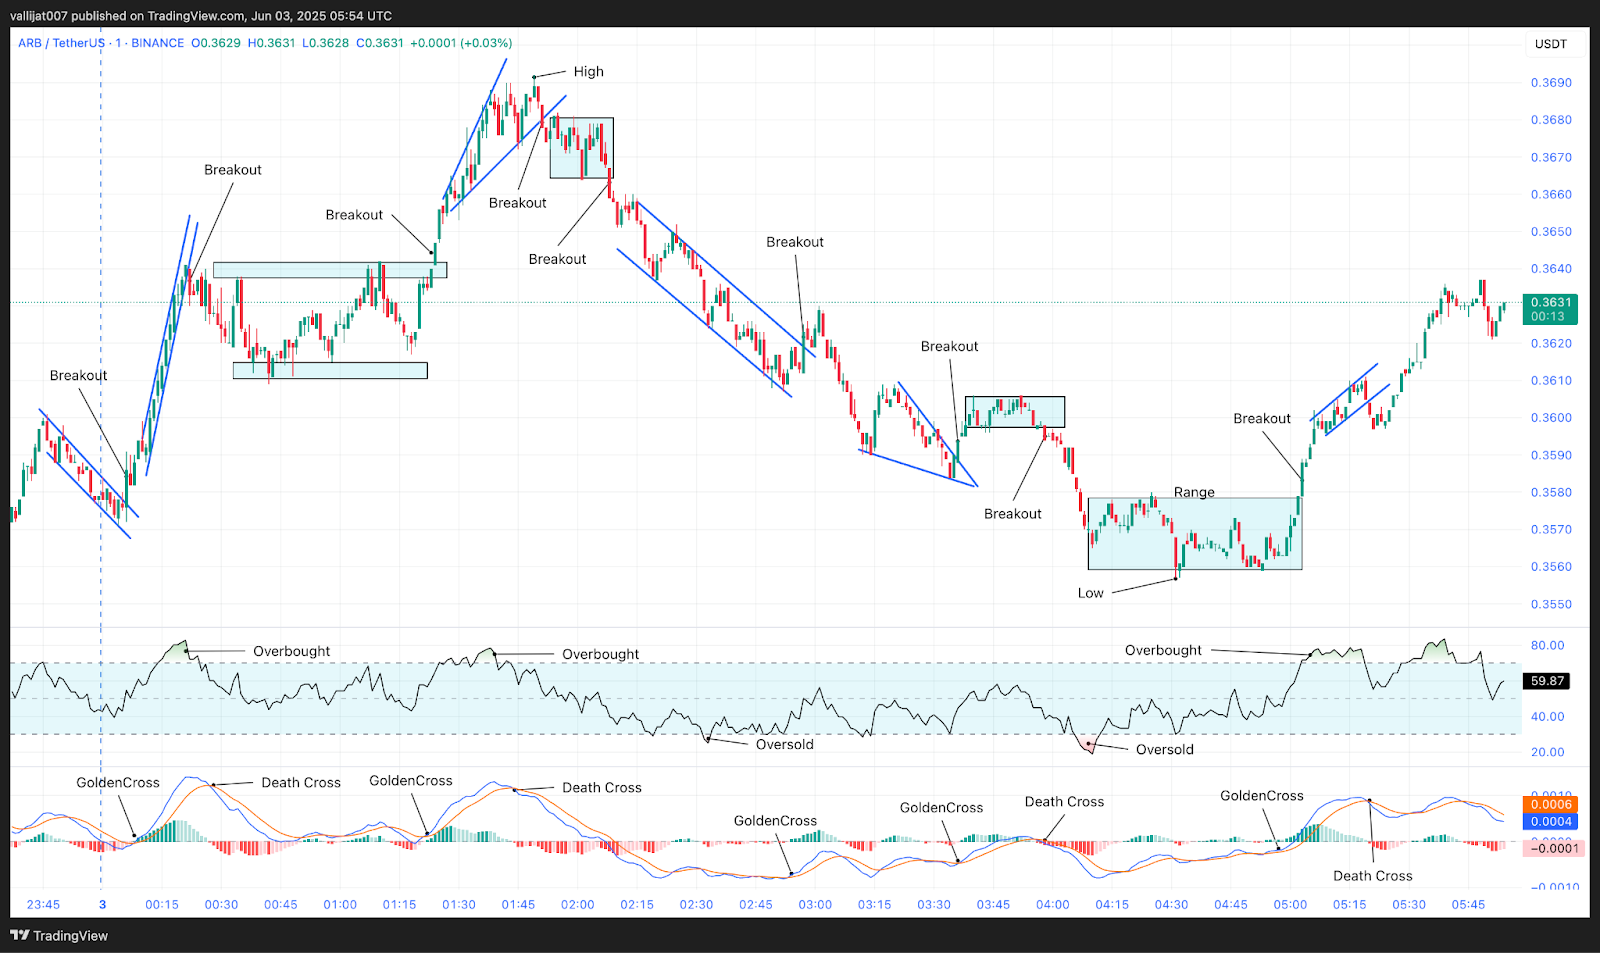
Chart 2: ARB/USDT M1 Chart, Analysed by vallijat007, published on TradingView, June 3, 2025
The Arbitrum price formed a downward-moving channel, which broke out to the upside at 00:06 UTC, supported by a golden crossover of MACD. The price spiked to the upside and formed an upward-moving channel. Meanwhile, at 00:20 UTC, RSI rose above the 70 level, pointing toward overbought market circumstances, implying a reversal or at least a pullback. Driven by a death crossover of MACD, the channel broke out to the downside at 00:22 UTC, and the price built a support region at the level of $0.3610 and a resistance area at $0.3640.
Expanding Triangle Rejection at $0.3692 High
The Arbitrum price broke out from the resistance area to the upside at 01:24 UTC, supported by a golden crossover of MACD, and formed an expanding triangle pattern. The expanding triangle pattern marked the high for the day at $0.3692 and broke out to the downside at 01:51 UTC, supported by a death crossover of MACD. The Arbitrum token dropped to the downside and formed a range. The range broke out to the downside at 02:08 UTC, supported by a death crossover of MACD, and formed a downward-moving channel.
At 02:33 UTC, RSI dropped below the level of 30, indicating oversold market conditions, suggesting a reversal or at least a pullback. The downward-moving channel broke out to the upside at 02:57 UTC, supported by a golden crossover of MACD, but the upside breakout failed, and the ARB price dropped to the downside, forming a converging triangle pattern. The converging triangle pattern broke out to the upside at 03:36 UTC, supported by a golden crossover of MACD, and a range followed.
The range broke out to the downside at 03:58 UTC, supported by a death crossover of MACD, marking the low for the day at $0.3557. After marking the low, the Arbitrum price formed a range that broke out to the upside at 05:03 UTC, supported by a golden crossover of MACD, and an upward-moving channel followed. In the meantime, at 05:05 UTC, RSI moved above the level of 70, indicating overbought market conditions. The upward-moving channel broke out to the downside at 05:20 UTC, supported by a death crossover of MACD, but the downside breakout failed.
Momentum Conflicts Keep ARB in Check
Arbitrum price showed indecisive movement, marked by frequent MACD crossovers and extreme RSI readings. Most breakout attempts failed to hold, reflecting a lack of follow-through in both directions. The high and low of the day were both made during short-lived moves, pointing to reactive, not proactive, market behavior. While support at $0.3560 and a resistance zone at $0.3690 are defined, the absence of clear trend momentum leaves the Arbitrum token vulnerable to whipsaws. Unless a breakout is supported by volume and sustained momentum, price may continue to fluctuate within its established range. Traders should wait for confirmation before positioning, especially given the choppy and unstable structure seen today.
Arbitrum (ARB) Price Analysis – June 7, 2025
Arbitrum trend opened the session in a narrow trading range, which established the low of the day at $0.3346. The range broke to the upside early, supported by a golden crossover of MACD, initiating an upward-moving channel. However, this bullish momentum was short-lived as multiple subsequent patterns, ranging from channels to triangles, struggled to sustain direction. Price action became volatile, alternating between breakouts and reversals. RSI signals fluctuated between oversold and overbought throughout the session, reflecting indecisiveness in the market. The session high was recorded at $0.3458, but momentum faded quickly afterward, with the ARB price re-entering consolidation territory.
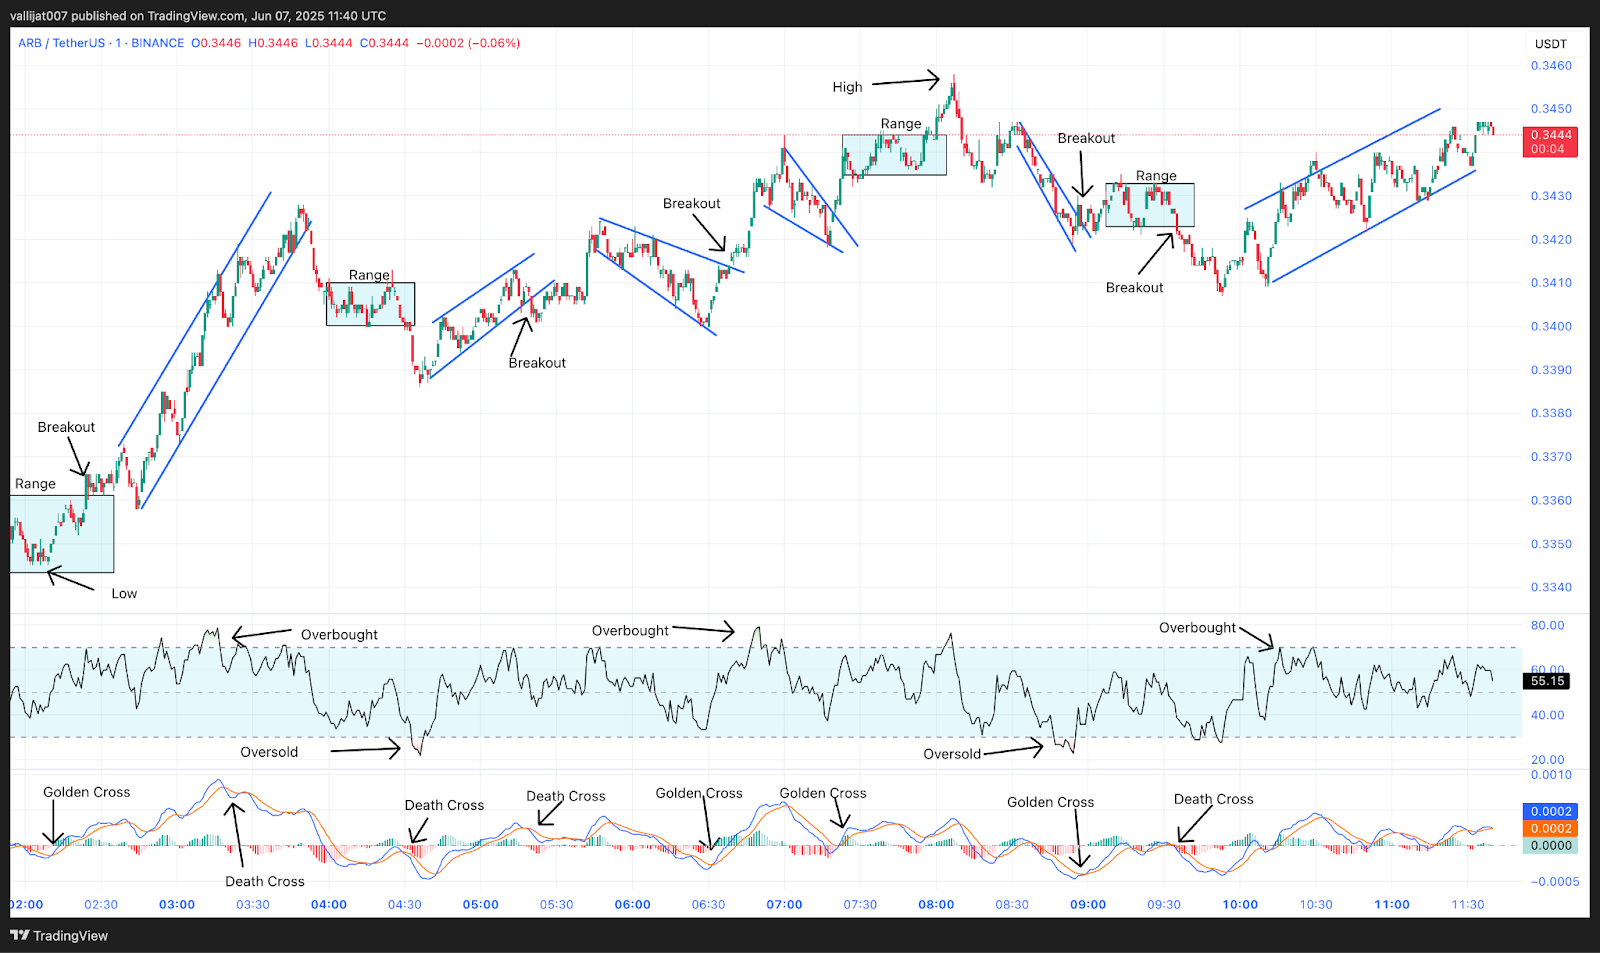
Chart 3: ARB/USDT M1 Chart, Analysed by vallijat007, published on TradingView, June 7, 2025
The Arbitrum price formed a range, which marked the low for the day at $0.3346. The range broke out to the upside at 02:40 UTC, supported by a golden crossover of MACD, and formed an upward-moving channel. The upward-moving channel broke out to the downside at 03:53 UTC, supported by a death crossover of MACD, and formed another range. This range broke out to the downside at 04:32 UTC, again supported by a death crossover of MACD.
RSI Ping-Pong: Trading ARB’s 30-70 Extremes in Choppy Markets
At 04:35 UTC, the RSI dropped below 30, indicating oversold market conditions and suggesting a reversal or at least a pullback. An upward-moving channel then appeared. That channel broke out to the downside at 05:20 UTC, supported by a death crossover of MACD, but the downside breakout failed to sustain. The ARB price rose to the upside and formed an expanding triangle pattern. The expanding triangle pattern broke out to the upside at 06:39 UTC, supported by a golden crossover of MACD, and led to a converging triangle pattern.
In the meantime, at 06:50 UTC, the RSI moved above 70, indicating overbought market conditions and suggesting a reversal or pullback. The converging triangle pattern broke out to the upside at 07:20 UTC, supported by a golden crossover of MACD. A range followed, which broke out to the upside at 08:00 UTC, again supported by a golden crossover of MACD, and marked the high for the day at $0.3458. The Arbitrum trend then formed a downward-moving channel, which broke out to the upside at 09:00 UTC, supported by a golden crossover of MACD.
However, momentum was weak, and the Arbitrum price developed a range. That range broke out to the downside at 09:35 UTC, supported by a death crossover of MACD, and formed another upward-moving channel. If the upward channel breaks out to the upside, the price may rise to $0.3500. If it breaks to the downside, the price may drop to $0.3300. Traders and investors should be cautious before placing breakout trades, as Arbitrum is currently in a consolidation phase.
$0.3500 Resistance Key for ARB’s Next Move
Arbitrum price action signals a market lacking conviction, oscillating between breakout attempts and rapid reversals. While the high of $0.3458 shows that buyers have tested higher ground, follow-through has been weak. If the current upward-moving channel breaks to the upside, the next major target is $0.3500, a psychological and technical resistance. On the downside, a break below the current structure could lead ARB toward the $0.3300 support. Given the mixed signals from RSI and MACD, traders should wait for a confirmed breakout or breakdown before initiating new positions. Consolidation remains the dominant trend in the short term.
Arbitrum Price Analysis of June 12, 2025
On June 12, 2025, Arbitrum (ARB) experienced a volatile trading session, swinging between sharp technical patterns and frequent MACD crossovers. The Arbitrum trend began with a converging triangle breakdown and continued through a sequence of expanding and converging formations. The session’s high was marked at $0.4266, while the low touched $0.3896. RSI oscillated across key thresholds, dropping below 30 multiple times to signal oversold conditions and rising above 70, pointing to temporary overbought states. While several golden and death crossovers suggested trend shifts, the market struggled to maintain momentum, leaving Arbitrum in a state of indecision and consolidation throughout the day. Currently, ARB price is trading at $0.3900.
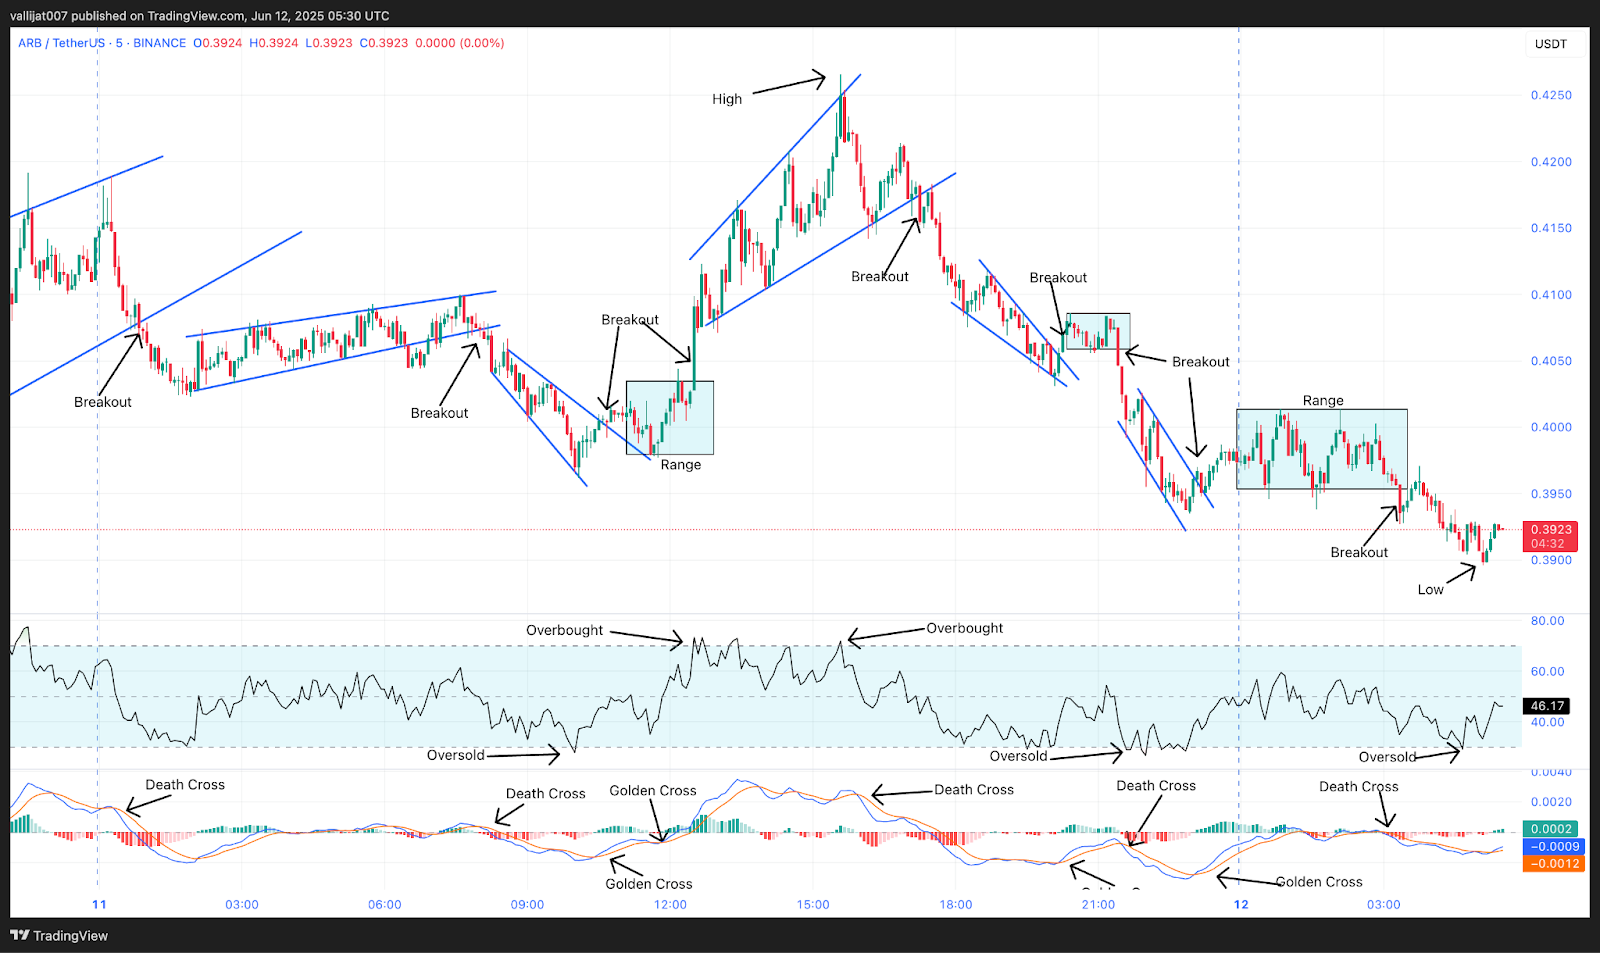
Chart 4: ARB/USDT M5 Chart, Analysed by vallijat007, published on TradingView, June 12, 2025
Arbitrum price formed a converging triangle pattern. The converging triangle pattern broke out to the downside at 00:50 UTC, supported by a death crossover of MACD. However, the momentum soon faded, and the price formed another upward-moving converging triangle pattern. The second converging triangle pattern broke out to the downside at 08:05 UTC, supported by a death crossover of MACD. Price then formed an expanding triangle pattern. At 10:00 UTC, RSI dropped below the level of 30, indicating an overall oversold market condition and suggesting a reversal or at least a pullback.
Upside Breakout of Expanding Triangle at 10:45 UTC
The expanding triangle pattern broke out to the upside at 10:45 UTC, supported by a golden crossover of MACD. However, as seen earlier, the momentum quickly faded, and the Arbitrum price formed a range. Supported by a golden MACD crossover, the range broke to the upside at 12:30 UTC to create another expanding triangle pattern. RSI rose over the 70 level at 13:25 UTC, pointing to overbought market circumstances and implying a turnaround or at least a correction.
Daily High Established at $0.4266 Before Downside Breakout
The expanding triangle pattern marked the high for the day at $0.4266. It then broke out to the downside at 17:15 UTC, supported by a death crossover of MACD, and formed a downward-moving converging triangle pattern. The converging triangle pattern broke out to the upside at 20:15 UTC, supported by a golden crossover of MACD, and formed a range. The range broke out to the downside at 21:25 UTC, supported by a death crossover of MACD, and formed a downward-moving channel.
At 22:00 UTC, RSI dropped below the level of 30, indicating oversold market conditions and suggesting a potential reversal or at least a pullback. The downward-moving channel broke out to the upside at 23:20 UTC, supported by a golden crossover of MACD. Finally, the range broke out to the downside at 03:20 UTC on June 12, 2025, supported by a death crossover of MACD, marking the low for the day at $0.3896.
$0.3896 Low Signals Fragile Support as Breakouts Struggle for Traction
Despite a series of patterns and technical signals, the Arbitrum trend failed to sustain direction. Multiple MACD-driven breakouts, both up and down, fizzled shortly after forming. RSI extremes added to the indecision, pointing to frequent overextensions without conviction. After hitting a high of $0.4266, sellers pushed the ARB price lower, eventually marking the day’s low at $0.3896. The final hours saw a downward-moving channel give way to a modest upside attempt, but the market lacked follow-through. If the Arbitrum price fails to reclaim key levels above $0.4100, bearish sentiment may continue. A confirmed move above resistance could restore bullish momentum.


