

In the Last 24 hours, Bitcoin traded within a well-defined range, showing active intraday movement but lacking a decisive breakout. After marking a low near $92,800, BTC formed an expanding triangle that evolved into multiple ranges. Successive Golden Crosses on the MACD supported breakouts to the upside, pushing price to a session high of $95,630. However, the momentum faded, and the range reversed with a downside break. RSI dropped into oversold territory, triggering a recovery within an upward-moving channel. BTC then transitioned into a minor downward channel, breaking to the upside. The price action reflected a trending range environment. Let’s take a look at Bitcoin price analysis to see how it reacted to the patterns.
Bitcoin Price Analysis for April 29, 2025
After marking the day’s low at $92,800, Bitcoin formed an expanding triangle pattern, which developed into a minor range. The minor range broke out to the upside at 05:50 UTC, supported by a Golden Cross of MACD. BTC formed another range, which again broke out to the upside at 10:30 UTC, supported by a Golden Cross of MACD. BTC price spiked to the upside, marking the day’s high at $95,630 and forming a resistance area at $95,500 and a support area at $95,000. The range broke to the downside at 13:30 UTC, supported by a Death Cross of MACD.

Chart 1: Analysed by vallijat007, published on TradingView, April 29, 2025
Price dropped to the downside, and an upward-moving channel appeared. In the meantime, at 13:50 UTC, RSI dropped below 30, indicating oversold market conditions. The upward-moving channel broke out to the upside at 19:00 UTC, supported by a Golden Cross of MACD. Price moved to the upside and formed a minor downward channel, which broke out to the upside at 21:50 UTC, supported by a Golden Cross of MACD. The Bitcoin price spiked and formed a channel. Bitcoin is traded in a ranging market, within which strong minor trends have appeared.
Rangebound to $95,500 or $92,800 Break?
The morning opened with expanding triangles, but the market moved downward at 01:55 UTC following an MACD Death Cross. A successful downside breakout of Bitcoin might result in BTC falling to reach prices at $92,800. The unsuccessful outcome of the breakout would enable BTC to surpass its current resistance point at $95,500. A successful Bitcoin breakout from resistance could push BTC up toward $98,000, thus reaching the measured value of its present trading zone. Achieving an established trend for BTC requires successful price movements above $95,500 or below $92,800. Bitcoin will stay within its existing price range until a breakthrough occurs.
BTC Needs Breakout for Directional Clarity
BTC price consolidates between key levels, with resistance at $95,500 and support at $92,800. A confirmed Bitcoin breakout above resistance could trigger a move toward $98,000, aligning with the width of the current range. Conversely, a breakdown below $92,800 would bring increased bearish momentum. Until either level is broken decisively, BTC is expected to continue trading within this range. MACD and RSI show mixed signals, reinforcing the need for confirmation before directional trades. For now, BTC remains in a coiled setup, primed for a breakout but still lacking commitment from market participants.
Bitcoin Price Analysis of May 1, 2025
Bitcoin began the session with a range breakout to the upside at 02:15 UTC, supported by a Golden Cross of MACD. Price spiked to $95,200 and formed a downward-moving channel, which later broke upward at 08:50 UTC. Another upside Bitcoin breakout followed from a narrow range at 11:25 UTC, marking the session high at $95,230 and establishing a key resistance zone. However, a failed breakout from the earlier range led to a downside move at 12:30 UTC, bringing the price down to $92,900. Let’s take a look at Bitcoin price analysis to understand the formation.
BTC’s Volatile Session: $95.2K Resistance Holds After Multiple Breakout Attempts
A range was formed in Bitcoin, which broke out to the upside at 02:15 UTC, supported by a Golden Cross of MACD. The price spiked to the upside at $95,200, and a downward-moving channel formed. The downward-moving channel broke out to the upside at 08:50 UTC, supported by a Golden Cross of MACD. Price spiked to the upside and formed a narrow range, which again broke out at 11:25 UTC, supported by a Golden Cross, and marked the high for the day at $95,230. This created a resistance area at the level of $95,200.

Chart 2: Analysed by vallijat007, published on TradingView, May 1, 2025
After the failed Bitcoin breakout to the upside, the narrow range broke out to the downside at 12:30 UTC, supported by a Death Cross of MACD. The price dropped to the downside and was marked as the low for the day at $92,900. In the meantime, at 12:40 UTC, RSI dropped below 30, indicating oversold market conditions and suggesting a reversal or at least a pullback. After marking the low for the day, Bitcoin recovered in a V-shape, a conventional pattern for strong recovery, and formed an expanding triangle pattern. The day for Bitcoin price is considered to be a trading range day.
Bitcoin Consolidates Near $95,200 Resistance – Breakout Imminent?
Yesterday’s expanding triangle pattern failed to break out in either direction. A small converging triangle pattern appeared in the price near the resistance level of $95,200. If the converging triangle pattern breaks out to the upside, then the immediate resistance may hamper the potential rise in Bitcoin. If Bitcoin can break the resistance level, the BTC price may rise to $96,000, a psychological level for Bitcoin. However, if the converging triangle fails to break out to the upside or breaks to the downside, then Bitcoin might mark another low below the level of $92,900.
BTC Price Awaits Directional Break Near Resistance
Bitcoin price is now coiling near a converging triangle just below resistance at $95,200. If the triangle breaks to the upside and clears resistance, price could climb toward the psychological level of $96,000. Conversely, a failed breakout or a downside break may push BTC below $92,900, revisiting recent lows. Market conditions remain range-bound, with mixed signals from momentum indicators. Traders should be cautious near resistance and look for volume-supported confirmation. Until BTC decisively exits this range, choppy action between key support and resistance levels will likely persist.
Bitcoin (BTC) Price Analysis of May 5, 2025
The Bitcoin price has been moving in a tight range after posting a high of $96,305. Despite several breakout attempts, price action remains indecisive. A brief dip to $93,500 marked the day’s low, but the move lacked follow-through. Indicators like MACD and RSI are flashing mixed signals, showing oversold conditions and weak rebound momentum. This kind of behavior typically signals a market in consolidation. Traders are watching for a clear break from this zone, but until that happens, Bitcoin remains rangebound. With lower volatility and increasing false breakouts, the environment favors patience and disciplined trading over aggressive positioning.

Chart 3: BTC/USDT M5 Chart, Analysed by vallijat007, published on TradingView, May 5, 2025
After marking a high for the day at $96,305, Bitcoin dropped to $95,650, forming a support area there. This support broke to the downside at 08:30 UTC, supported by a death crossover of the MACD, but the BTC price failed to form a spike; instead, Bitcoin moved sideways. At the same time, the RSI dropped below 30, indicating oversold market conditions and suggesting a reversal or at least a pullback. A range appeared in the Bitcoin price, which attempted to break out to the upside at 20:25 UTC, supported by a Golden Cross of the MACD, but the upside breakout failed, and the price remained inside the range.
Death Cross Triggers Bitcoin Breakdown – But Will It Hold?
BTC then attempted to break down to the downside at 22:00 UTC, supported by MACD momentum, forming a new support area at $94,000. In the meantime, RSI again dropped below 30, indicating oversold conditions and suggesting a potential reversal or a pullback. The $94,000 support broke to the downside at 01:30 UTC, supported by a Death Cross of the MACD, but the downside Bitcoin breakout failed. Bitcoin marked a day low at $93,500.
A sustained recovery of the present low would drive BTC toward reaching $96,000. A break in support could potentially reduce Bitcoin to $92,000. The Bitcoin market is weak right now as it continually fails to maintain upward or downward breakthroughs. MACD and RSI momentum indicators display conflicting indications since they continue alternating between oversold territory and weak upward momentum. This market consolidation shows bearish forces soaking up resistance at support areas without sustained bullish support.
The upcoming BTC price movement will unfold from $93,500 to $96,000, with critical support and resistance. Bitcoin maintains itself within a compressing trading zone because traders are waiting for strong market signals indicating the next movement direction. BTC will likely stay in a consolidating pattern unless both trading volume rises or a substantial price breakout happens, producing frequent intraday price fluctuations and fake breakouts throughout the session. The current market requires both patience and confirmation to enter new positions.
When Will Bitcoin Escape Its Range? The Key Levels That Matter
The Bitcoin price showcases exhaustion in its market movement through multiple unsuccessful Bitcoin breakouts combined with weak price movement clarity. Price behavior does not match well with RSI alongside the MACD indicator, thus producing uncertain market projections for the coming sessions. A significant short-term support has formed at $93,500, and it functions as an essential obstacle before price moves upward, while $96,000 appears to be resisting price movement. The upcoming direction of Bitcoin’s market lies with price activity that breaches this defined price range. Market momentum remains low, demanding traders seek indicators and volume backing before executing major trading moves.
Bitcoin Price Analysis of May 8, 2025
Bitcoin price opened with a downward-moving channel, pushing price lower until 03:15 UTC, when RSI dropped below 30, signaling oversold conditions and a potential pullback. A range formed and broke to the upside, supported by a Golden Cross of MACD, triggering a BTC price spike. Another range followed, but the 14:05 UTC breakout attempt failed. BTC price reversed into another downward channel, marking the day’s low at $95,800. The channel broke to the upside at 20:40 UTC, and multiple bullish breakouts followed through the night, culminating in a strong rally to $99,419, the high for the day.

Chart 4: BTC/USDT M5 Chart, Analysed by vallijat007, published on TradingView, May 8, 2025
A downward-moving channel appeared in the Bitcoin price, which pushed the price lower, and at 03:15 UTC, RSI dropped below the level of 30, indicating an oversold market condition, suggesting a reversal or at least a pullback. Price formed a range that broke out to the upside at 07:15 UTC, supported by a golden crossover of MACD. The Bitcoin price spiked to the upside and formed another range.
In the meantime, at 07:55 UTC, RSI moved above the level of 70, indicating an overbought market condition, suggesting a reversal or at least a pullback. The second range tried to break out to the upside at 14:05 UTC, supported by the golden cross of MACD, but the upside breakout failed, and the price dropped to the downside in a downward-moving channel, marking the low for the day at $95,800.
BTC Charges Toward $100K: Golden Cross Breakouts Fuel Rally
The downward-moving channel broke out to the upside at 2040 UTC, supported by a golden crossover of MACD. Price spiked to the upside and formed a range. The range broke out to the upside at 00:55 UTC, supported by a golden crossover of MACD. The Bitcoin price spiked to the upside and formed a second range.
Meanwhile, at 01:00 UTC, RSI was moved above the 70 level, pointing to overbought market conditions and suggesting a reversal or even a pullback. The second range also broke out in an upward direction with the help of a golden crossover of MACD at UTC of 02:10. Price jumped to the upside and created another range.
This range also broke out to the upside at 03:40 UTC, supported by a golden crossover of MACD. Price spiked to the upside, marking the high for the day at $99,419. If the Bitcoin breakout succeeds, then the price may rise to the level of $100,000, which acts as a psychological level for BTC. If the Bitcoin breakout fails, then the price may drop to the level of $95,800. BTC is currently showing strong upward momentum, but traders should remain cautious around the $100K level, where profit-taking and psychological resistance may emerge.
$100,000 in Sight, but Risk of Rejection Remains
Currently, the price of Bitcoin is hovering slightly below the $100,000 psychological resistance level. If this bull momentum continues and price breaks 100K, it might kickstart further upside as the breakout traders and sentiment come into play. However, RSI over and over again moving into overbought levels sends a signal of possible profit-taking or fatigue. BTC could move back towards $95,800, the previous support level, if the breakout fails to break out. Participants in the market should be on the lookout for volume confirmation and MACD consistency before taking new positions. The Bitcoin price is increasing, but the next 24 hours may determine whether it breaches new highs or cools down into a consolidation.
Bitcoin (BTC) Price Analysis of May 9, 2025
Bitcoin started the session by forming a range at the daily low. A golden MACD crossover triggered an upside Bitcoin breakout, leading to successive ranges, each breaking upward and showing strong bullish momentum. RSI briefly signaled overbought conditions, but the price continued climbing. After several breakouts, a downward channel formed and was broken to the upside, establishing an upward-moving channel. This bullish structure persisted until late in the session. Despite a brief pullback, Bitcoin remained above support, marking the high of the day after breaking out from a converging triangle pattern on strong MACD confirmation.

Chart 5: BTC/USDT M5 Chart, Analysed by vallijat007, published on TradingView, May 9, 2025
A range appeared in the BTC price, which marked the low for the day at $96,880. The range broke out to the upside at 00:55 UTC, supported by a golden crossover of MACD. Price spiked to the upside and formed another range. The second range again broke out to the upside at 02:10 UTC, supported by a golden cross of MACD. Price spiked to the upside and formed a third range.
In the meantime, RSI moved above the level of 70, indicating overbought market conditions, suggesting a reversal or at least a pullback. The third range again broke out to the upside at 03:40 UTC, supported by a golden crossover of MACD. Price spiked to the upside and formed a downward-moving channel. The downward-moving channel broke out to the upside at 06:10 UTC, supported by a golden crossover. Price formed an upward-moving channel.
Will 105K Break or 100K Support Hold?
The upward-moving channel broke out to the downside at 10:30 UTC, supported by a death crossover of MACD. Price spiked to the downside and formed a range. This range broke out to the upside at 15:20 UTC, supported by a golden crossover of MACD. The Bitcoin price spiked to the upside and formed a converging triangle pattern. In the meantime, at 15:30 UTC, RSI moved above the level of 70, indicating overbought market conditions, suggesting a reversal or at least a pullback.
The converging triangle pattern broke out to the upside at 20:30 UTC, supported by a golden crossover of MACD. Price spiked to the upside, marking the high for the day at $104,145. In the meantime, RSI moved above the level of 70, again indicating overbought market conditions, suggesting a reversal or at least a pullback. The Bitcoin price pulled back and formed a range, which broke out to the downside at 03:40 UTC on 9th May 2025, supported by a death crossover of MACD.
There is a very low chance that the downside Bitcoin breakout will succeed because the Bitcoin price shows a clear trend. If the downside breakout does succeed, then it may drop to the level of $100,000, which acts as a psychological support level for BTC. If the downside breakout fails, then the BTC price may soon reach the level of $105,000.
BTC Faces Test of Trend Strength at Support
Bitcoin’s strong trend is being tested after a minor pullback supported by a MACD death cross. RSI remains elevated, signaling short-term exhaustion. However, the larger structure still favors bulls. If the current breakdown continues, the Bitcoin price may revisit psychological support near the recent milestone low. If support holds and momentum returns, BTC could rally to reclaim its high and challenge higher resistance. A failed downside move would confirm ongoing bullish control. Traders should watch for strong volume and MACD alignment as price approaches key levels. Until then, BTC remains in a bullish bias with potential for trend continuation.
Bitcoin (BTC) Price Analysis of May 12, 2025
Bitcoin’s recent price action has been marked by a series of failed breakouts and inconsistent momentum, reflecting a market struggling to find direction. After breaking out of a downward trendline, the price failed to hold gains and slipped into a broader expanding triangle pattern. A subsequent upside breakout sparked a short-lived rally, forming an upward channel that also failed to hold. Multiple breakouts from both triangles and ranges have followed, most of them reversing quickly. Despite occasional bullish signals, such as golden crossovers and RSI surges, the BTC price has struggled to sustain upward movement, reinforcing the view of a volatile, indecisive trading environment.
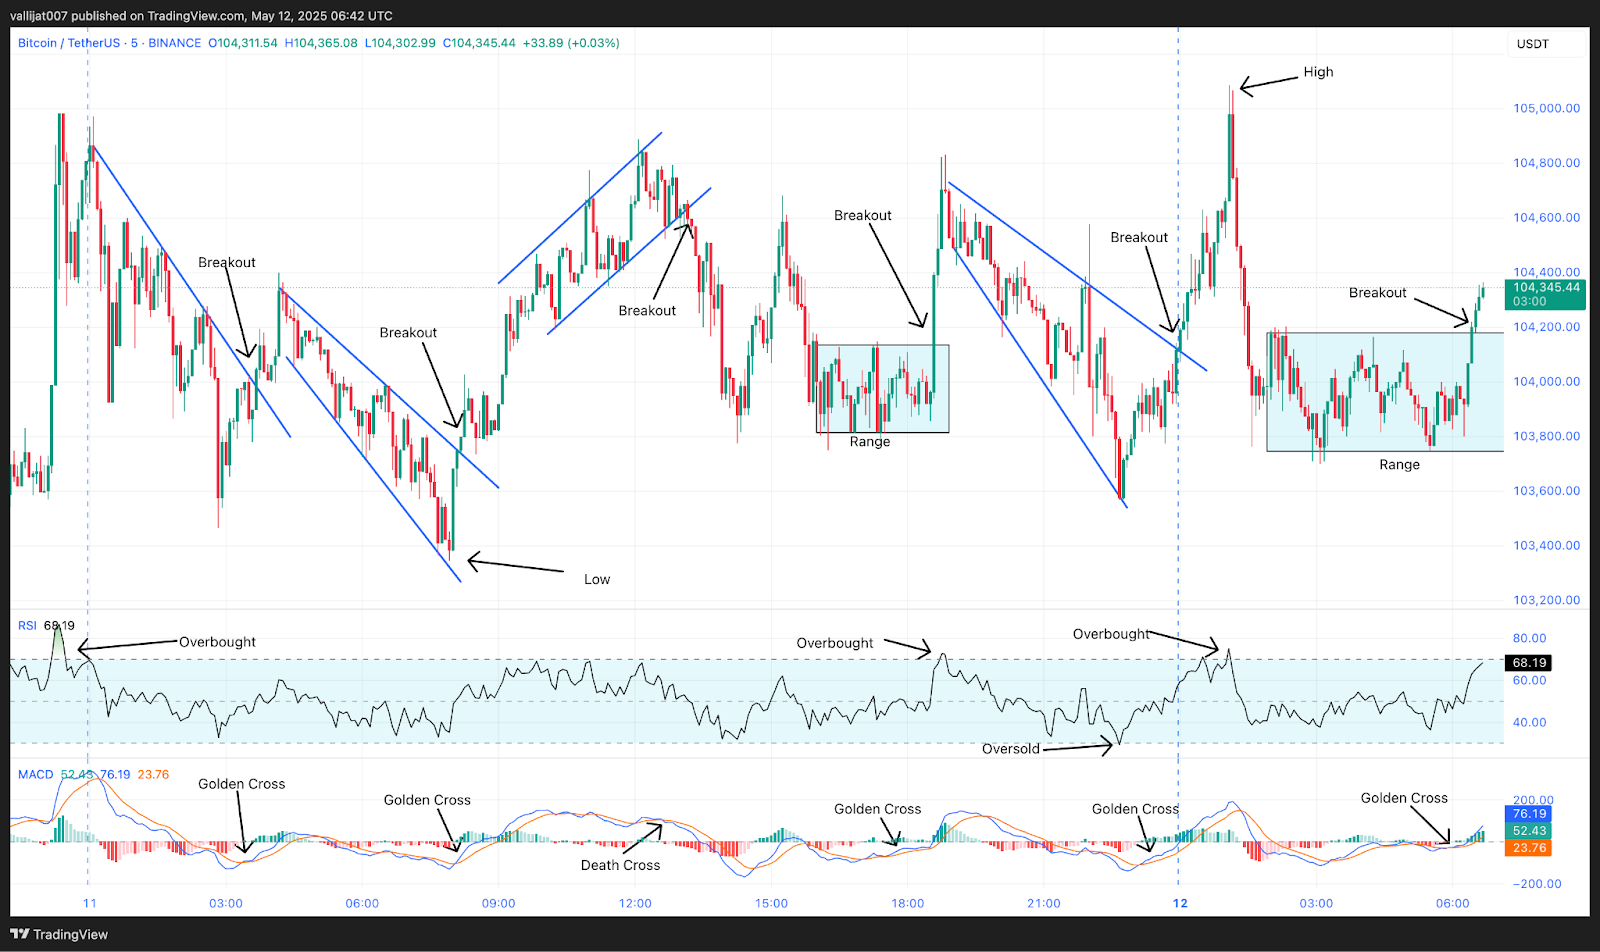
Chart 6: BTC/USDT M5 Chart, Analysed by vallijat007, published on TradingView, May 12, 2025
A downward-moving trendline appeared in BTC price, which broke out to the upside at 03:40 UTC, supported by a golden crossover of MACD, but the upside breakout failed, and the price formed a downward-moving expanding triangle pattern. The expanding triangle pattern broke out to the upside at 08:10 UTC, supported by a golden crossover of MACD. The Bitcoin price spiked to the upside and formed an upward-moving channel. The expanding triangle also marked the low for the day at $103,350.
Channel Breakdown & Range Formation: $103,800 Bitcoin Support Tested
The upward-moving channel broke out to the downside at 13:10 UTC, supported by a death crossover of MACD. The Bitcoin price dropped and formed a range with a support area at $103,800 and resistance at $104,120. This range broke out to the upside at 18:35 UTC, supported by a golden crossover of MACD. The price spiked again but failed to sustain the upside breakout and formed another expanding triangle pattern.
In the meantime, at 18:50 UTC, RSI moved above the level of 70, indicating overbought market conditions and suggesting at least a pullback. The expanding triangle pattern broke out to the upside at 00:00 UTC on 12 May 2025. The breakout spiked to the upside, marking the high for the day at $105,090, but the price was unable to sustain the breakout and dropped again, forming a range. This range has a Bitcoin support area at $103,750 and a resistance area at $104,200.
The range broke out to the upside at 06:25 UTC, supported by a golden crossover of MACD. If the breakout sustains, the price may reach the level of $105,200. However, if the breakout fails, the price may move back inside the range. If the range breaks to the downside, then the price may drop further. Traders and investors should be cautious, as Bitcoin is currently trading in a range where most breakout attempts have failed to establish a strong trend.
Golden Crosses Meet Hard Resistance: Why Bullish Signals Lack Conviction
The trading environment of Bitcoin remains volatile and marked by repeated reversals when Bitcoin price spikes occur, thus calling into question the validity of rising momentum. Even when such momentum signals as the RSI indicated extreme levels, these did not lead to sustained changes in direction. The Bitcoin price action is bouncing between a choppy range, yet continuing to search for the big support and resistance points. Directional trades should be traded with care so long as volume signals and technical indicators do not provide a genuine breakout. Consequently, traders need to be careful and undertake strenuous risk-management strategies.
Bitcoin (BTC) Price Analysis of May 13, 2025
The Bitcoin price action has been marked by false breakouts, short-lived trends, and a general lack of follow-through, signaling a choppy, indecisive market. After an early upside Bitcoin breakout supported by a golden MACD crossover, the BTC price spiked briefly but quickly lost momentum, slipping into a sequence of narrow ranges and trendline breakdowns. Multiple MACD death crossovers confirmed weakening momentum as the price continued to slide, eventually marking a new low for the day. Even a bullish breakout from a downward channel failed to generate clear direction. These repeated failures underline a broader range-bound structure and weak conviction across the board.
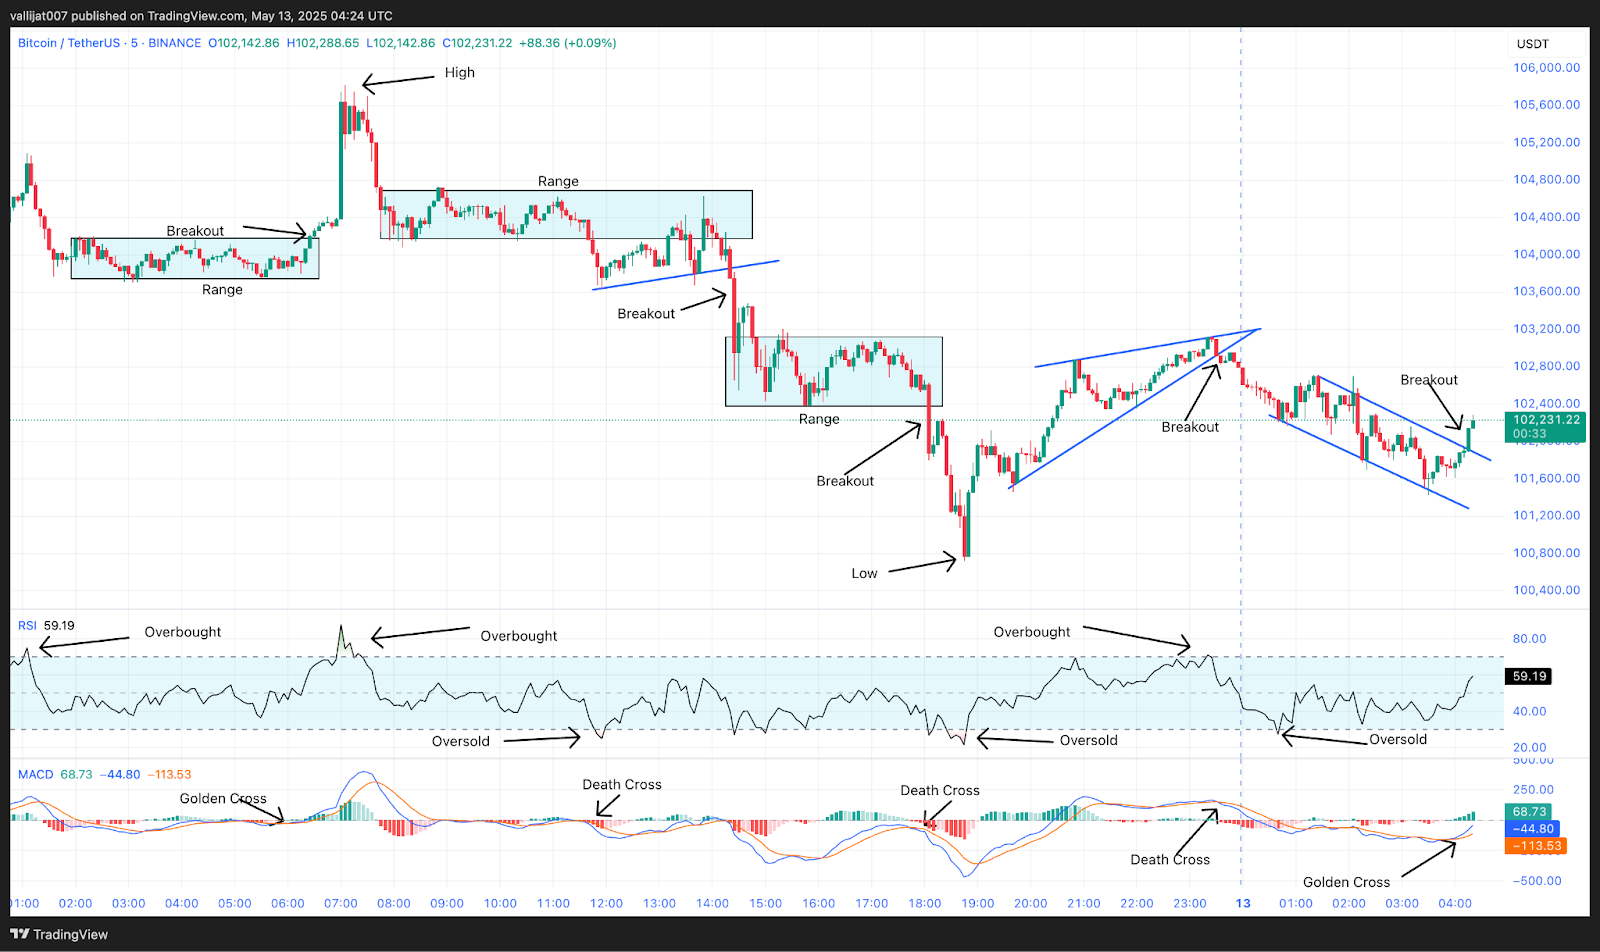
Chart 7: BTC/USDT M5 Chart, Analysed by vallijat007, published on TradingView, May 13, 2025
A range appeared in BTC price, which broke out to the upside at 06:25 UTC, supported by a golden crossover of MACD. The Bitcoin price spiked to the upside, marking the high for the day at $105,820. However, the upside Bitcoin breakout did not sustain to form more upward momentum. The Bitcoin price dropped and formed a range with a resistance area at $104,700 and a support area at $104,150.
The range broke out to the downside at 11:45 UTC, supported by a death crossover of MACD, but the price failed to form a strong trend. An upward-moving trendline appeared, which again broke to the downside at 14:20 UTC, supported by another death crossover of MACD. The price fell and formed a new range.
Critical Juncture: Will BTC Hold 100K or Rally to 107K?
This range again broke to the downside at 18:05 UTC, supported by a death crossover of MACD, with the Bitcoin price dropping and marking the low for the day at $100,720. BTC failed to sustain the downward momentum, and an upward-moving converging triangle appeared. It broke to the downside at 23:35 UTC, supported by a death crossover of the MACD. The price dropped again and formed a downward-moving channel.
The downward-moving channel broke out to the upside at 04:15 UTC, supported by a golden crossover of MACD. If the breakout succeeds, the price may rise to the level of $107,000. If the breakout fails, then the price may drop to the level of $100,000. Bitcoin shows trading range behavior, with most breakouts failing to reach their target and often reversing in the opposite direction. Traders and investors should be cautious before placing a breakout trade, as BTC may continue to consolidate for some time.
MACD and RSI are neutral, neither showing much momentum either way. Until Bitcoin breaks above $107000 or below $100000 with conviction and volume, sideways movement will persist. Currently, tight risk management and range-trading styles may outperform trend-following setups in this indecisive environment.
Breakout or Fakeout? Why Traders Must Wait for Confirmation
Bitcoin drifts sideways, and every rally up or down is capped and countered promptly. Moves based upon MACD and RSI are neutral as the general market is undecided on what to do next. Until the Bitcoin price blasts through key levels supported by volume and confirmation, the current chop is likely to continue. The traders should continue being careful, not going overboard with breakout setups in this unpredictable environment. Range-trading strategies, small stop-losses, and patience should do a better job. The only strong move in the direction of the resistance level or support level that has a strong momentum will indicate the commencement of a new directional trend.
Bitcoin (BTC) Price Analysis of May 14, 2025
Bitcoin’s recent price action has been characterised by a strong trending bias to the upside, with most upward breakouts showing follow-through and downside attempts failing to sustain. The session began with a downside breakout from a converging triangle, forming a low for the day. However, this was quickly reversed by a series of bullish moves supported by golden MACD crossovers. Successive breakouts from triangle and range patterns drove the Bitcoin price higher, establishing an intraday high before another brief pullback. Even during dips, bullish momentum remained intact, with RSI repeatedly signaling overbought and oversold conditions but failing to derail the upward trajectory.
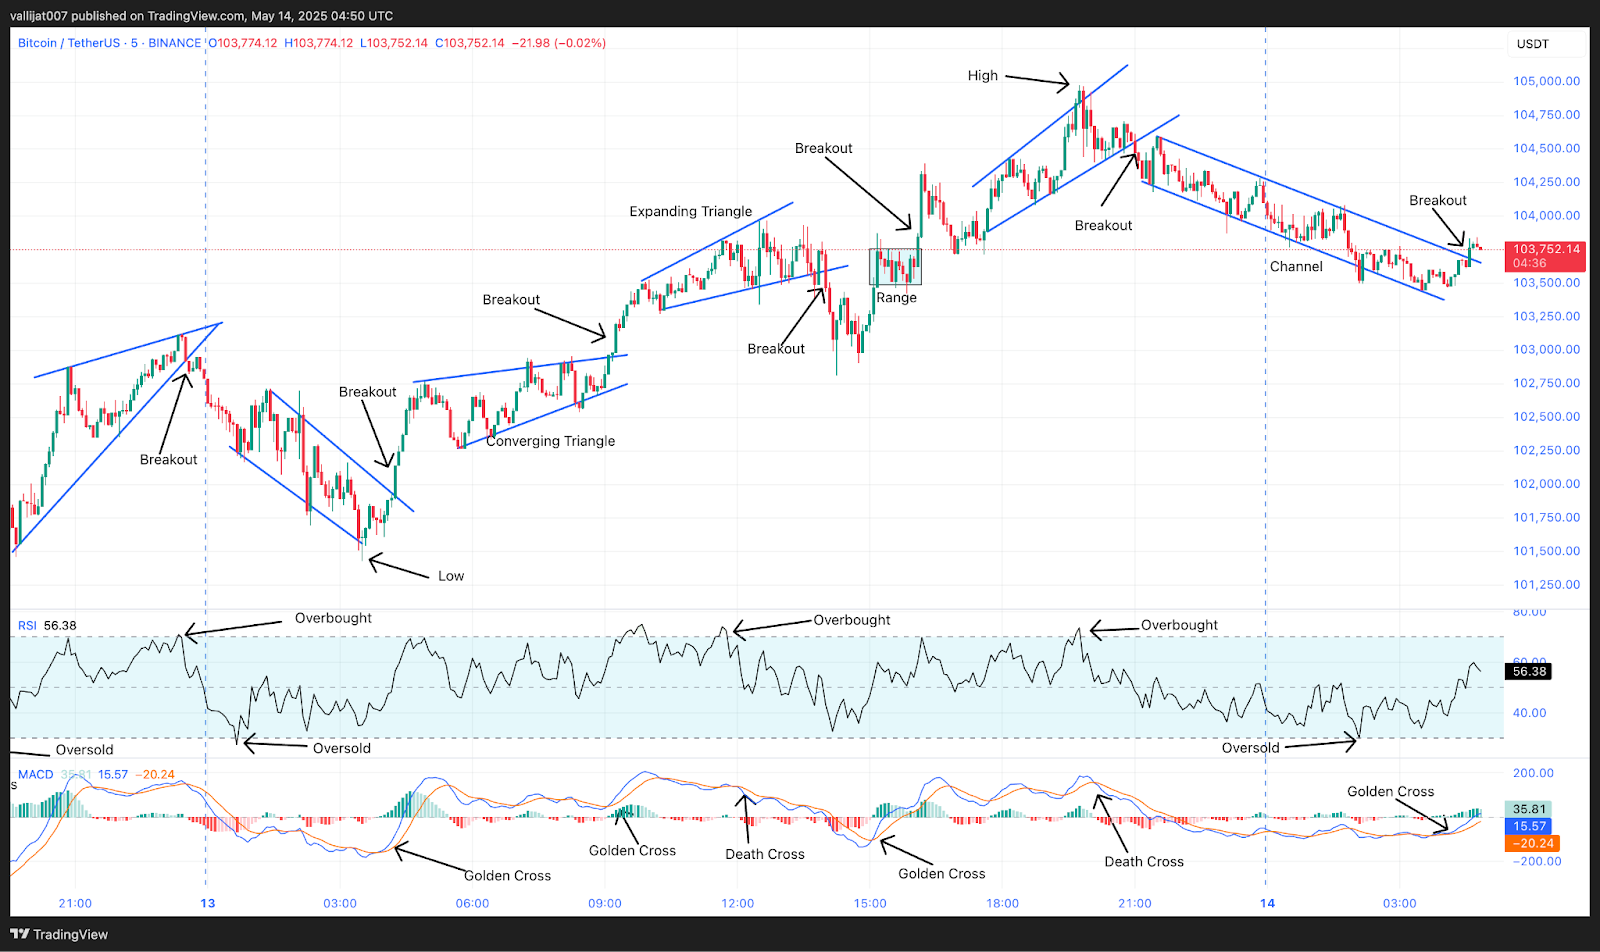
Chart 8: BTC/USDT M5 Chart, Analysed by vallijat007, published on TradingView, May 14, 2025
A converging triangle appeared in the BTC price, which broke out to the downside, creating a spike and downward-moving channel that marked the low for the day at $101,430. The downward-moving channel broke out to the upside at 04:15 UTC, supported by a golden crossover of MACD. Price spiked to the upside and formed a converging triangle pattern. The converging triangle pattern broke out to the upside at 09:15 UTC, supported by a golden crossover of MACD. Price spiked to the upside and formed an expanding triangle pattern.
Golden Cross Sparks Rally as Bulls Target $106,000
In the meantime, RSI moved above the level of 70, indicating an overbought market condition, suggesting a reversal or at least a pullback. The expanding triangle pattern broke out to the downside at 14:00 UTC, supported by a death crossover of MACD. The Bitcoin price spiked to the downside but did not have follow-through. Price rebounded to the upside and formed a minor range. The minor range broke out to the upside at 16:05 UTC, supported by a golden crossover of MACD.
Bitcoin price spiked to the upside and formed a channel, which marked the high for the day at $104,975. The upward-moving channel broke out to the downside at 21:00 UTC, supported by a death crossover of MACD. Price spiked to the downside and formed a downward-moving channel. In the meantime, at 02:05 UTC on 14th May 2025, RSI dropped below the level of 30, indicating an oversold market condition, suggesting a reversal or at least a pullback. That downward-moving channel broke out to the upside at 04:35 UTC, supported by a golden crossover of MACD.
If the upside breakout succeeds, then the BTC price may rise to the level of $106,000. If the price continues to drop, then it may fall to the level of $100,000, which acts as a psychological level for Bitcoin. Bitcoin shows a trending behavior with upside-trending momentum. Most of the upside breakouts have follow-through and reach their target price, and any attempt to break to the downside has failed. Currently, Bitcoin is trading at $103,750.
Bitcoin Defends Key Bitcoin Supports Amid Shallow Pullbacks
Bitcoin price remains in a bullish trend, with price consistently breaking upward from key patterns and reaching target zones. While the market has experienced minor corrections, these have been shallow and quickly reversed, reinforcing buyer dominance. RSI and MACD signals continue to support upside momentum, even as brief overbought or oversold signals emerge. Currently trading above a key Bitcoin support zone, Bitcoin is well-positioned to resume its upward move if the latest breakout holds. A push toward higher levels is possible, but traders should monitor for volume confirmation. Until a decisive breakdown occurs, the trend remains upward, favoring continuation over reversal.
Bitcoin (BTC) Price Analysis of May 17, 2025
Bitcoin’s latest session was dominated by indecisive price action and failed breakout attempts, forming a clear picture of extreme range-bound behavior. The day began with a converging triangle breakout to the downside, but it lacked conviction. A second triangle followed with a similar outcome: a brief downside movement without sustained momentum. Oversold RSI levels hinted at potential recovery, which led to a temporary spike, but even bullish formations failed to hold. A series of minor ranges and channels appeared, all showing weak follow-through. Bitcoin’s movement reflects market hesitation, with repeated false breakouts highlighting the absence of trend strength and directional clarity.
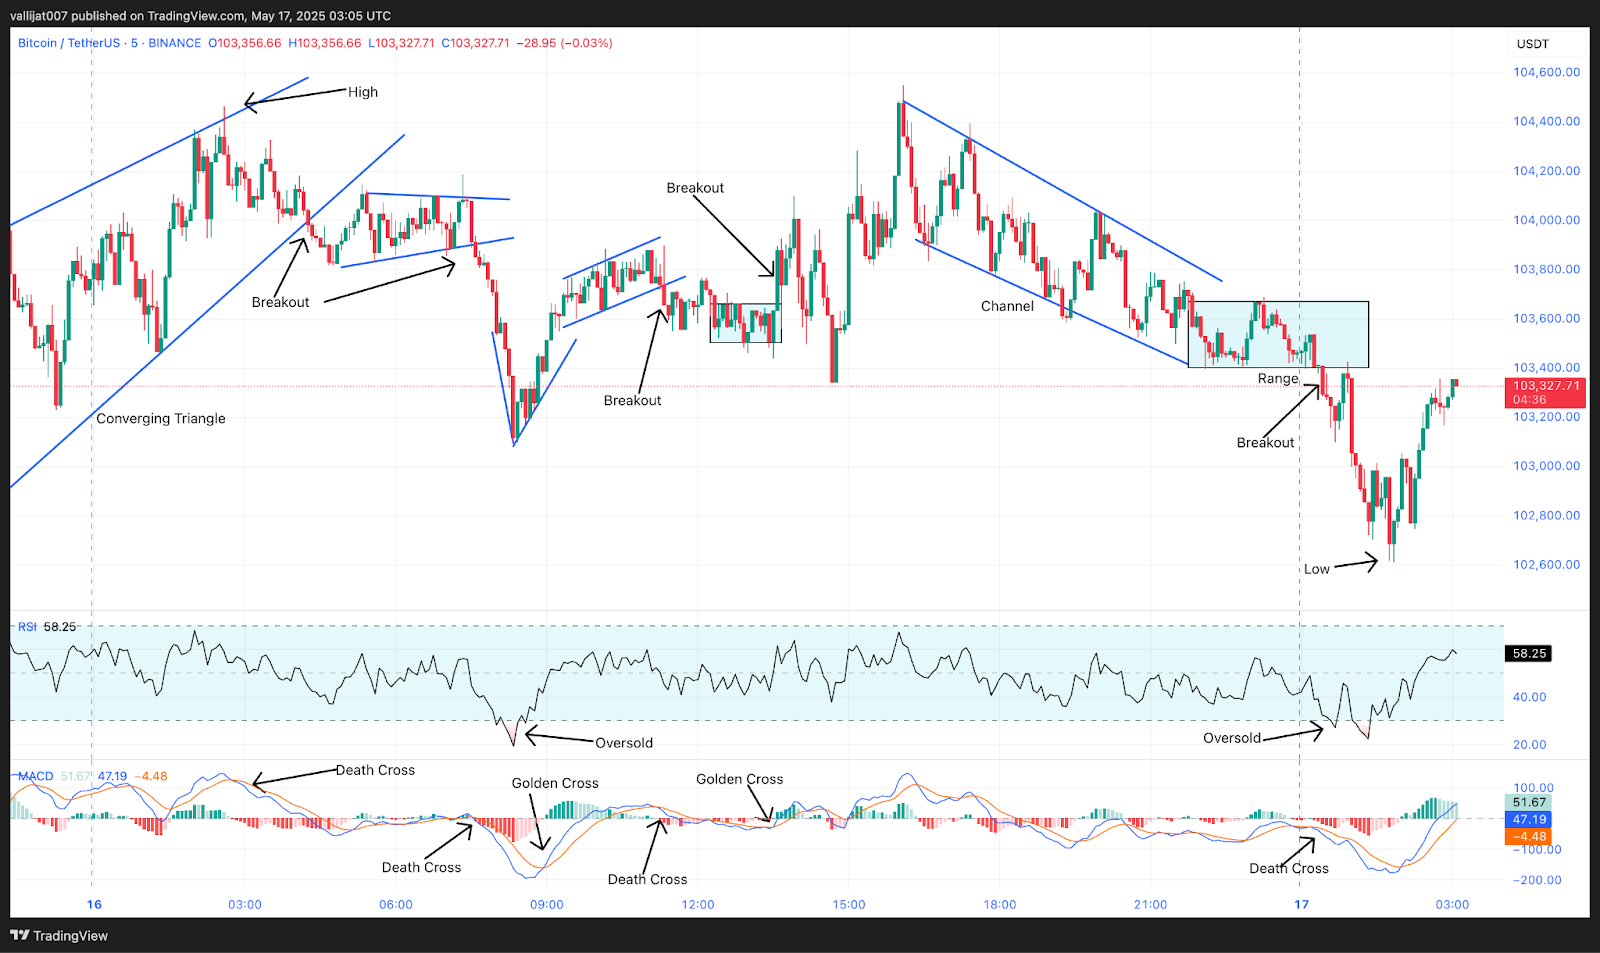
Chart 9: BTC/USDT M5 Chart, Analysed by vallijat007, published on TradingView, May 17, 2025
A converging triangle pattern appeared in the Bitcoin price, which marked the high for the day at $104,466. The converging triangle pattern broke out to the downside at 04:15 UTC, supported by a death crossover, but the price failed to form a spike. Instead, another converging triangle appeared in the price, which again broke out to the downside at 07:35 UTC, supported by a death crossover of MACD. The Bitcoin price spiked to the downside but failed to sustain the downward momentum.
Failed Bitcoin Breakouts Dominate: Why Traders Should Avoid Premature Entries
At 08:20 UTC, RSI dropped below the level of 30, indicating oversold market conditions, suggesting at least a pullback. Price reversed to the upside in a V-shaped recovery, forming a spike and channel pattern. The channel broke out to the downside at 11:20 UTC, supported by a death crossover of MACD, but the Bitcoin price failed to have a follow-through. Instead, a minor range appeared in the price. The range broke out to the upside at 13:35 UTC, supported by a golden crossover of MACD, but the price failed to sustain the breakout, and the breakout instantly failed.
A downward-moving channel appeared in the price, which gave birth to a range. The range broke out to the downside at 00:25 UTC on 17th May 2025, supported by a death crossover of MACD. Price spiked to the downside, marking the low for the day at $102,612. In the meantime, RSI dropped below the level of 30, indicating oversold market conditions, suggesting a reversal or at least a pullback. If the downside breakout succeeds, then the BTC price may drop to the level of $100,000.
If the Bitcoin breakout fails, then the BTC price may rise to the level of $105,000. Bitcoin shows extreme trading range behavior, with most of the breakouts failing to achieve their target price. There is a high chance that Bitcoin may consolidate for two or more sessions as the momentum and volatility drop when world markets are offline. Traders and investors should be cautious before placing a breakout trade until momentum resumes.
Bitcoin Likely to Consolidate Amid Weak Momentum
Bitcoin price remains trapped in a highly indecisive range, with both bullish and bearish breakouts repeatedly failing to extend into meaningful trends. Momentum indicators like RSI and MACD have cycled through overbought and oversold zones without generating sustained movement. The latest downside spike reached a new session low but failed to ignite further selling, pointing to exhaustion. With global markets quieter and volatility dropping, Bitcoin may remain in consolidation over the next few sessions. Traders should avoid chasing early breakouts and instead wait for strong confirmation before entering new positions. For now, patience and tight risk management are essential in this stagnant setup.
Bitcoin (BTC) Price Analysis of May 18, 2025
Bitcoin price action has largely reflected consolidation and indecision, with several breakout attempts lacking momentum and quickly reversing. After setting a low following a downside range breakout, the Bitcoin price rebounded and cycled through a series of expanding and converging triangle patterns. Most of these failed to produce sustained movement, with breakouts stalling or reversing. Despite intermittent spikes, including one that marked the day’s high, the overall trend remains muted. RSI oscillated between overbought and oversold levels, reinforcing the choppy and reactive nature of the market. With global markets offline, Bitcoin remains range-bound, awaiting a decisive move.
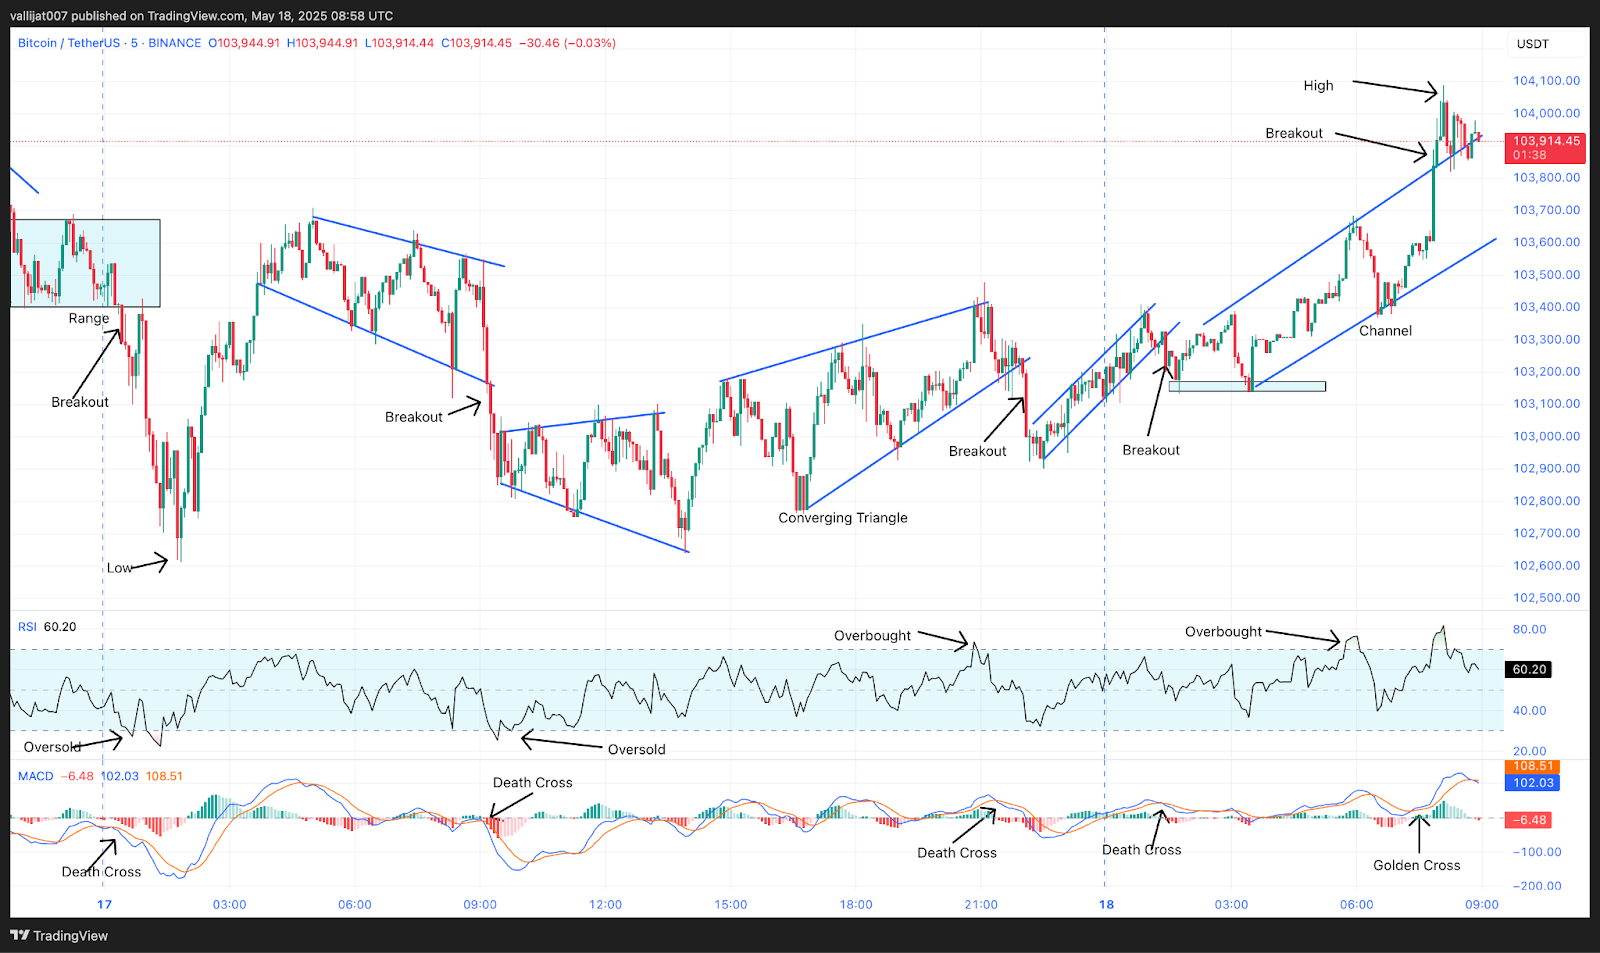
Chart 10: BTC/USDT M5 Chart, Analysed by vallijat007, published on TradingView, May 18, 2025
A range appeared in the BTC price, which broke out to the downside at 00:25 UTC, supported by a death crossover of the MACD. Price spiked to the downside, marking the low for the day at $102,620. After marking the low, the price moved to the upside and formed an expanding triangle pattern. The expanding triangle pattern broke out to the downside at 09:15 UTC, supported by a death crossover of MACD. Price dropped to the downside and formed another expanding triangle.
In the meantime, at 09:25 UTC, RSI dropped below the level of 30, indicating an oversold market condition, suggesting a reversal or at least a pullback. The second expanding triangle pattern failed to break out to either side and gave birth to a converging triangle pattern. The converging triangle pattern broke out to the downside at 22:05 UTC, supported by a death crossover of MACD. Price spiked to the downside and formed an upward-moving channel.
Channel Breakout to $104,088: Golden Cross Tests Key Resistance
The upward-moving channel broke out to the downside at 01:25 UTC on 18th May 2025, supported by a death crossover of MACD, but the BTC price failed to push further lower. Instead, a support formed at the level of $103,150. Another upward-moving channel appeared in the price, which broke out to the upside at 07:50 UTC, supported by a golden crossover of MACD. Price spiked to the upside, marking the high for the day at $104,088.
In the meantime, at 08:00 UTC, RSI moved above the level of 70, indicating an overbought market condition, suggesting a reversal or at least a pullback. If the breakout succeeds, then the Bitcoin price may rise to the level of $105,000. If the Bitcoin breakout fails, then the price may drop to the level of $100,000.
Since the markets are currently not offline, Bitcoin is holding its current position in the market. The majority of the breaches in Bitcoin’s price do not last and often end up reversing in the opposite direction. A solid trend will persist if the resistance at $105,000 and the support at $100,000 are both broken with strong momentum. Until then, the price of Bitcoin may continue to remain where it is.
Bitcoin Awaits Breakout from Tight Range
Bitcoin is consolidating within a narrow band, repeatedly failing to maintain momentum in either direction. While Bitcoin made a recent move past its recent highs, the indicator for price showing overbuying may only be temporary. According to the wider pattern, the Bitcoin market is standing by, and its price fluctuates somewhere between $105,000 and $100,000. When neither of these levels is breached with strong buying or selling, the price will probably move within range. Patience and caution are key, as false breakouts remain a risk in this low-volatility, low-participation environment.
Bitcoin (BTC) Price Analysis of May 20, 2025
Bitcoin’s session was marked by sharp swings and constant shifts between breakouts and reversals, showcasing a volatile, range-driven market. After briefly reaching the day’s high, the price reversed sharply, setting off a series of downside moves supported by MACD death crossovers. Multiple ranges and channels formed throughout the session, each generating short-term Bitcoin breakouts that often lacked follow-through. RSI consistently moved into overbought and oversold zones, highlighting extreme but unsustained sentiment. Despite these fluctuations, the Bitcoin price repeatedly found support after hitting key lows, with golden MACD crossovers sparking short-lived recoveries throughout the day.
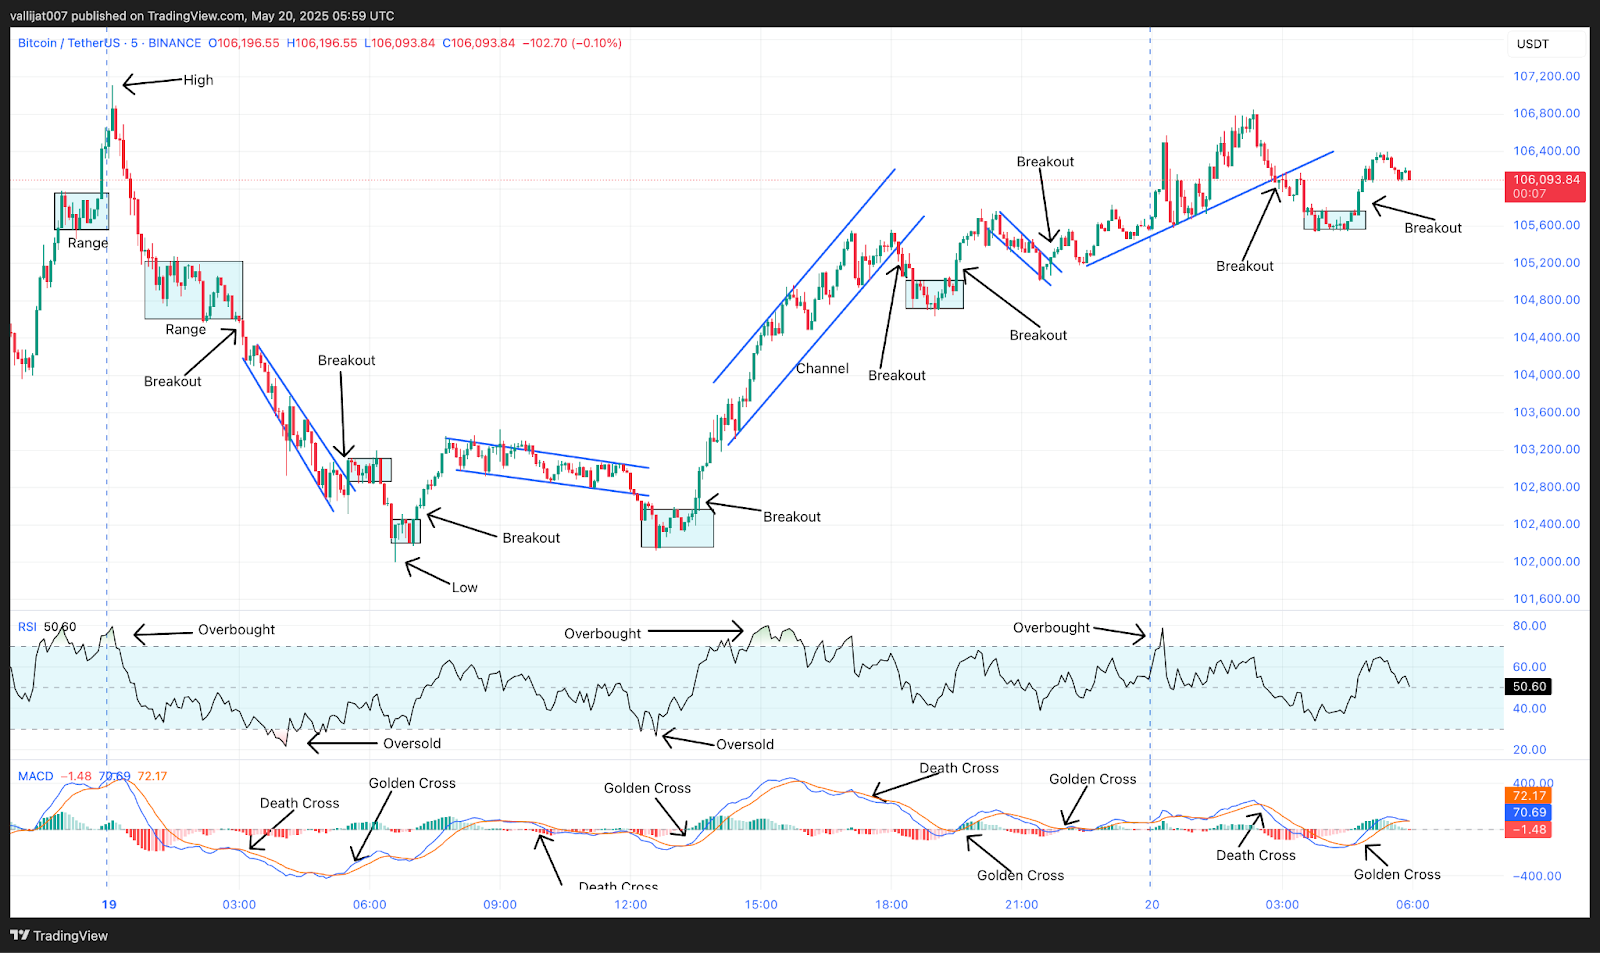
Chart 11: BTC/USDT M5 Chart, Analysed by vallijat007, published on TradingView, May 20, 2025
A range appeared in the price of BTC, which broke out to the upside, marking the high for the day at $107,108 at 00:05 UTC. After reaching a high, the BTC price dropped to the downside, forming a range. The range broke out to the downside at 03:05 UTC, supported by a death crossover of the MACD. Price spiked to the downside and formed a downward-moving channel. In the meantime, at 04:05 UTC, RSI dropped below the level of 30, indicating oversold market conditions, suggesting a reversal or at least a pullback.
The downward-moving channel broke out to the upside at 05:30 UTC, supported by a golden crossover of MACD, but the price failed to form a spike, and a range followed. The range again broke out to the downside at 06:20 UTC, supported by a death crossover of MACD. Price spiked to the downside, marking the low for the day at $102,000. After marking the low, the price formed a range. The range broke out to the upside at 07:05 UTC, supported by a golden crossover of MACD. Price spiked to the upside and formed a downward-moving channel.
Golden Cross Cluster: Can Bulls Finally Sustain Upside Momentum?
The downward-moving channel broke out to the downside at 12:10 UTC, supported by a death crossover of MACD. BTC price spiked to the downside and formed another range. In the meantime, at 12:15 UTC, RSI dropped below the level of 30, indicating oversold market conditions suggesting a reversal or at least a pullback. The range broke out to the upside at 13:30 UTC, supported by a golden crossover of MACD.
Price spiked to the upside and formed an upward-moving channel. In the meantime, at 15:15 UTC, RSI moved above the level of 70, indicating overbought market conditions, suggesting a reversal or at least a pullback. The upward-moving channel broke out to the downside at 18:10 UTC, supported by a crossover of MACD. The Bitcoin price spiked to the downside and formed a small range. The range broke out to the upside at 19:30 UTC, supported by a golden crossover of MACD. Price spiked to the upside and formed a downward-moving channel.
The downward-moving channel broke out to the upside at 21:45 UTC, supported by a golden crossover of MACD. The Bitcoin price spiked to the upside and formed an upward-moving trendline. The trendline broke out to the downside at 02:50 UTC, supported by a crossover of MACD. Price moved to the downside and formed a minor range. The minor range broke out to the upside at 04:45 UTC on 20th May 2025, supported by a golden crossover of MACD.
Bitcoin Churns in Volatility, Trend Still Unclear
Bitcoin price action reflects a session dominated by volatility and indecision, with rapid reversals and multiple breakout failures. While the market respected technical signals like MACD and RSI, no breakout sustained enough momentum to set a clear direction. Repeated spikes and corrections kept the price cycling through channels and ranges without establishing a trend. The presence of both overbought and oversold RSI levels reinforces the choppy behavior. Until Bitcoin decisively breaks out of this back-and-forth structure, ideally with volume and sustained momentum, traders should remain cautious. For now, short-term setups may offer opportunities, but directional trades remain high-risk without a confirmed Bitcoin breakout.
Bitcoin (BTC) Price Analysis of May 22, 2025
Bitcoin displayed strong bullish momentum throughout the session, with price action dominated by a series of successful upside Bitcoin breakouts. The session began with a rebound from the day’s low at $109,177, supported by a golden MACD crossover. This triggered a sequence of expanding triangles, channels, and ranges, most of which broke to the upside and met their targets. RSI repeatedly entered overbought territory, reflecting strong buying pressure, though it also signaled brief pullbacks. Even when the BTC price corrected, downside moves lacked follow-through, quickly giving way to fresh rallies. The high for the day was marked at $111,871 before a channel breakdown occurred.
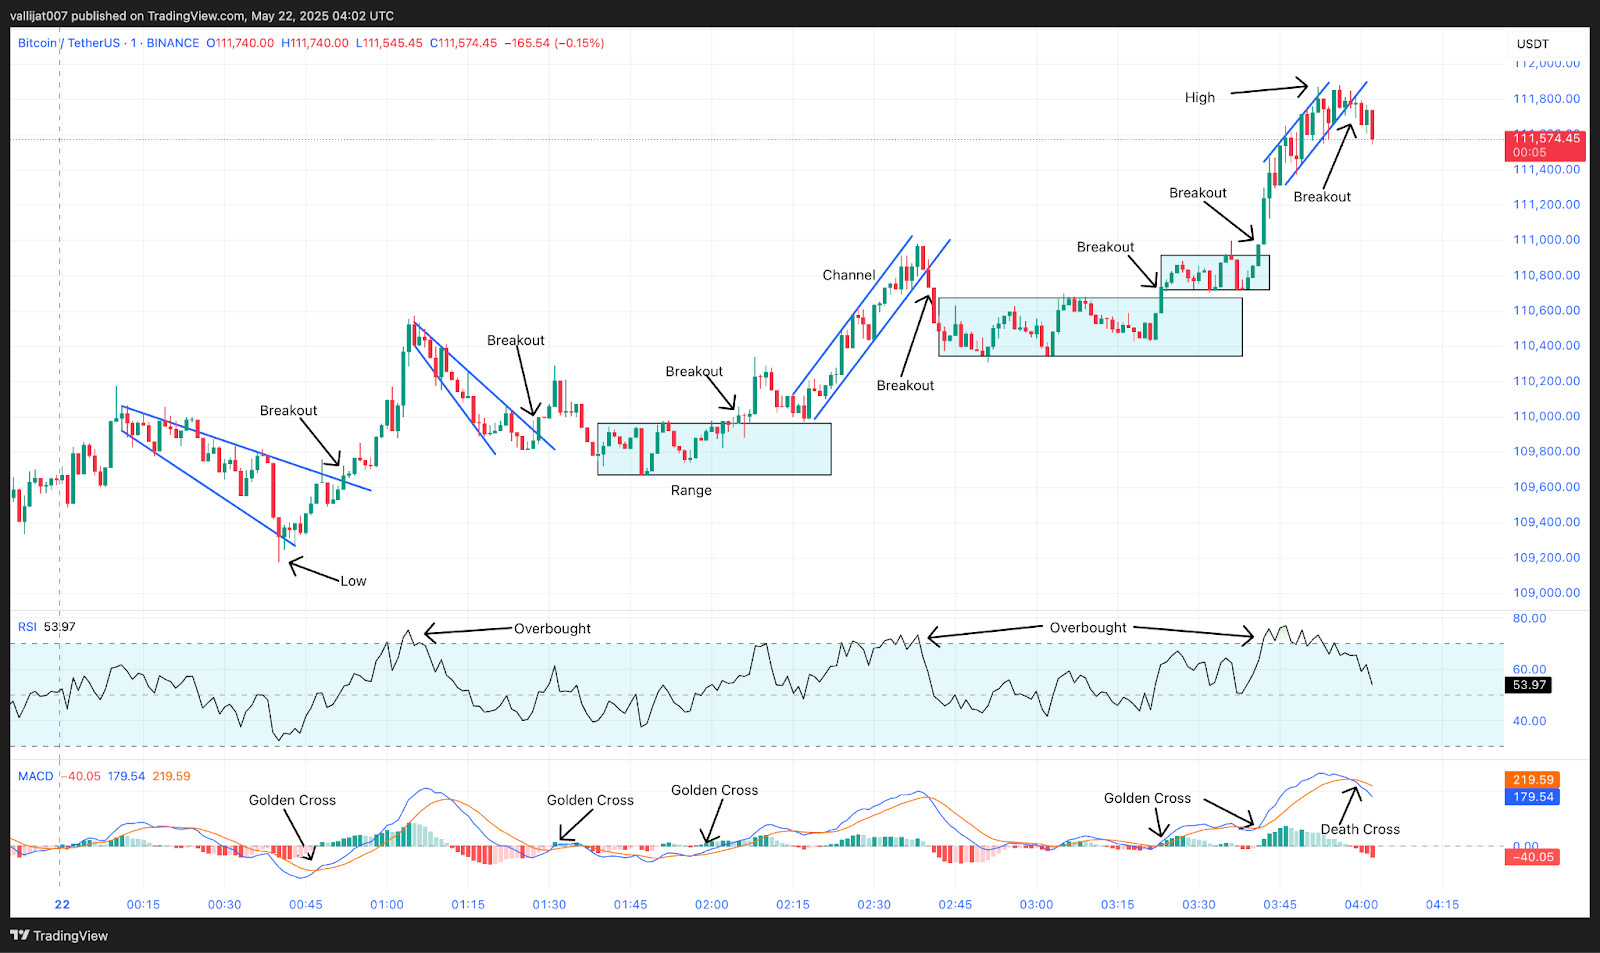
Chart 12: BTC/USDT M1 Chart, Analysed by vallijat007, published on TradingView, May 22, 2025
The Bitcoin price formed an expanding triangle pattern, marking the day’s low at $109,177. The expanding triangle pattern broke out to the upside at 00:52 UTC, supported by a golden crossover of MACD. Price spiked to the upside and formed another downward-moving expanding triangle pattern. Meanwhile, at 01:04 UTC, RSI went above 70, showing market conditions were overbought and might lead to a correction or reversal. The second expanding triangle broke on the upside at 01:28 UTC, accompanied by a golden crossover of MACD, yet Bitcoin did not trend higher, and a range formed.
Golden Cross Rally: BTC Challenges $112K Resistance
The range broke out to the upside at 02:05 UTC, supported by a golden crossover of MACD. The Bitcoin price spiked to the upside and formed an upward-moving channel. In the meantime, at 02:35 UTC, RSI moved above the level of 70, indicating overbought market conditions, suggesting at least a pullback. The upward-moving channel broke out to the downside at 02:40 UTC, supported by a death crossover of MACD. Price spiked to the downside and formed a range.
The range broke out to the upside at 03:23 UTC, supported by a golden crossover of MACD. Price spiked to the upside and formed a minor range. The minor range broke out to the upside at 03:41 UTC, supported by a golden crossover of MACD. Price spiked to the upside and formed an upward-moving channel, marking the high for the day at $111,871. In the meantime, at 03:46 UTC, RSI moved above the level of 70, indicating overbought market conditions, suggesting a reversal or at least a pullback.
The upward-moving channel broke out to the downside at 04:00 UTC, supported by a death crossover of MACD. Bitcoin price showed a clear, strong uptrend in which most Bitcoin breakouts to the upside hit their target price, and downside breakouts failed to have follow-through. If the breakout from the upward-moving channel succeeds, then the price may drop to the level of $110,000, and if the breakout fails, then the Bitcoin price may mark another high.
Bitcoin Holds Bullish Structure Despite Overbought Signals
The Bitcoin price structure remains bullish, with consistent upside breakouts and limited impact from downward corrections. Although the most recent breakout from the upward channel was to the downside, it lacks confirmation, and previous downside moves were short-lived. Overbought RSI levels suggest short-term exhaustion, but the underlying trend remains intact. If this latest pullback extends, $110,000 will serve as potential support. Conversely, a failed breakdown could trigger another leg higher. Traders should watch for follow-through or a reversal confirmation before taking directional positions, as Bitcoin remains in a strong trend but shows signs of short-term fatigue.
Bitcoin (BTC) Price Analysis of May 24, 2025
Bitcoin traded within a highly technical and reactive structure, cycling through multiple triangle patterns, channels, and ranges during the session. After establishing the day’s low at $106,875, the Bitcoin price broke down through a converging triangle, but downside momentum quickly faded. A golden MACD crossover at 03:02 UTC initiated a climb, leading to a series of upside Bitcoin breakouts, with RSI briefly entering overbought territory. Despite repeated bullish signals, follow-through remained inconsistent. The session high was set at $108,582 before the BTC price corrected, entering another downward phase marked by channels and ranges. Oversold RSI conditions near session end hinted at a potential rebound.
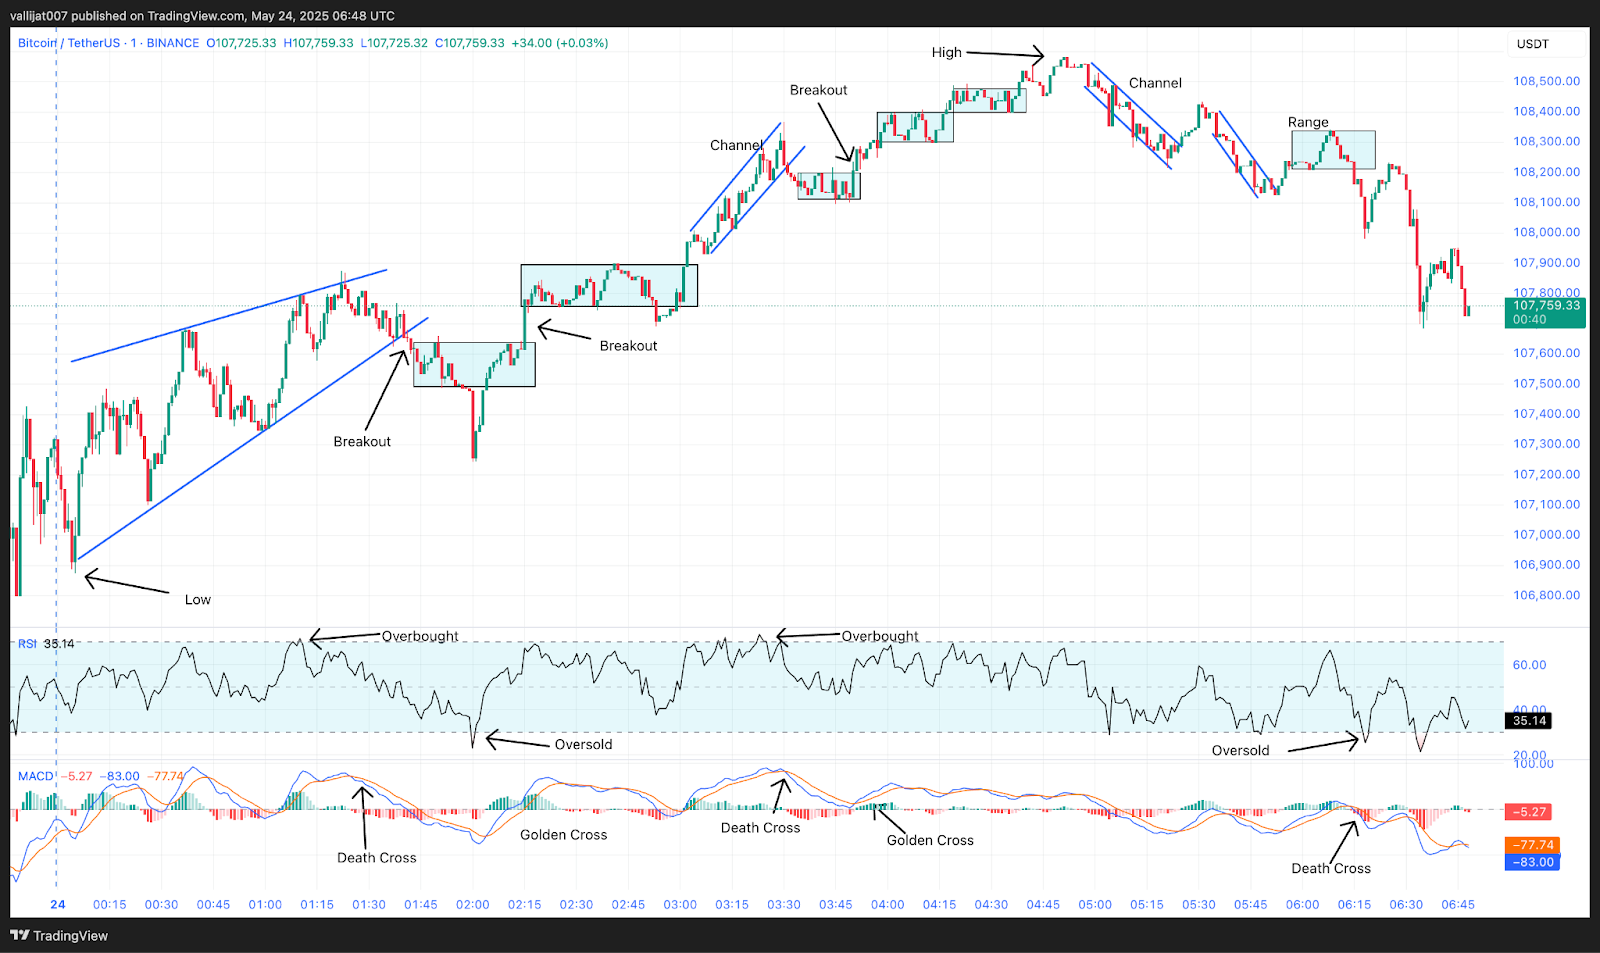
Chart 13: DOGE/USDT M1 Chart, Analysed by vallijat007, published on TradingView, May 24, 2025
After marking the low for the day at $106,875, Bitcoin formed a converging triangle pattern, which broke out to the downside at 01:41 UTC, supported by a death crossover of MACD. Price moved to the downside and formed a range. The range broke out to the downside at 02:00 UTC, supported by the crossover of MACD, but the downside breakout failed, and the price moved to the upside and formed another range. The second range again broke out to the upside at 03:02 UTC, supported by a golden crossover of MACD. BTC price spiked to the upside and formed an upward-moving channel.
In the meantime, at 03:20 UTC, RSI moved above the level of 70, indicating overbought market conditions, suggesting a reversal or at least a pullback. The upward-moving channel broke out to the downside at 03:31 UTC, supported by a death crossover of MACD. The price dropped and formed a minor range. The minor range broke out to the upside at 03:51 UTC, supported by a gold crossover of MACD. Price spiked to the upside and formed another range.
Golden Cross Breakout Fails at $108,582 High
The second range again broke out to the upside at 04:18 UTC, supported by a golden crossover of MACD, but the price failed to form a spike. Instead, another range followed. The third range again broke out to the upside at 04:38 UTC, supported by a gold crossover of MACD. Price spiked to the upside, marking the high for the day at $108,582. After reaching the high, the price dropped to the downside and formed a downward moving channel.
The downward-moving channel broke out to the upside at 05:25 UTC, supported by a gold crossover of MACD. Price spiked to the upside but failed to have a follow-through. Instead, another downward-moving channel appeared in the price. The second downward-moving channel again broke out to the upside at 05:54 UTC, supported by a gold crossover of MACD. Price spiked to the upside and formed a range.
The range broke out to the downside at 06:15 UTC, supported by a death crossover of MACD. Price spiked to the downside and formed a downward-moving channel. In the meantime, at 06:18 UTC, RSI dropped below the level of 30, indicating oversold market conditions, suggesting a reversal or at least a pullback. If the Bitcoin breakout succeeds, then Bitcoin may drop to the level of $106,000. If the breakout fails, then the Bitcoin price may rise to the level of $109,000.
Bitcoin Faces Key Reversal Zone After Volatile Session
Bitcoin’s price action was defined by back-to-back breakouts with limited sustainability, reflecting a volatile but indecisive market. Each upside push triggered by golden MACD crossovers was met with eventual reversal, and downside moves lacked conviction until the final session hour. With the latest range breaking down and RSI dropping below 30, conditions are now ripe for a technical rebound. If the current bearish breakout holds, Bitcoin price could decline toward $106,000. However, failure to extend lower may attract buyers aiming for a retest of the $109,000 level. Traders should watch for confirmation before positioning, as momentum remains fragile and direction uncertain.
Bitcoin (BTC) Price Analysis of May 26, 2025
Bitcoin’s session was shaped by a series of short-lived breakouts and sharp reversals, reflecting indecision and low follow-through in price action. After marking the daily low at $108,670 following a downside breakout from a small range, the market quickly reversed and surged toward the session high of $109,845. Multiple converging triangles, ranges, and channels emerged throughout the session, often accompanied by alternating MACD crossovers and RSI signals. While Bitcoin price action showed bursts of bullish momentum, each rally was capped by overbought RSI conditions, and bearish breakouts repeatedly lacked sustained momentum.
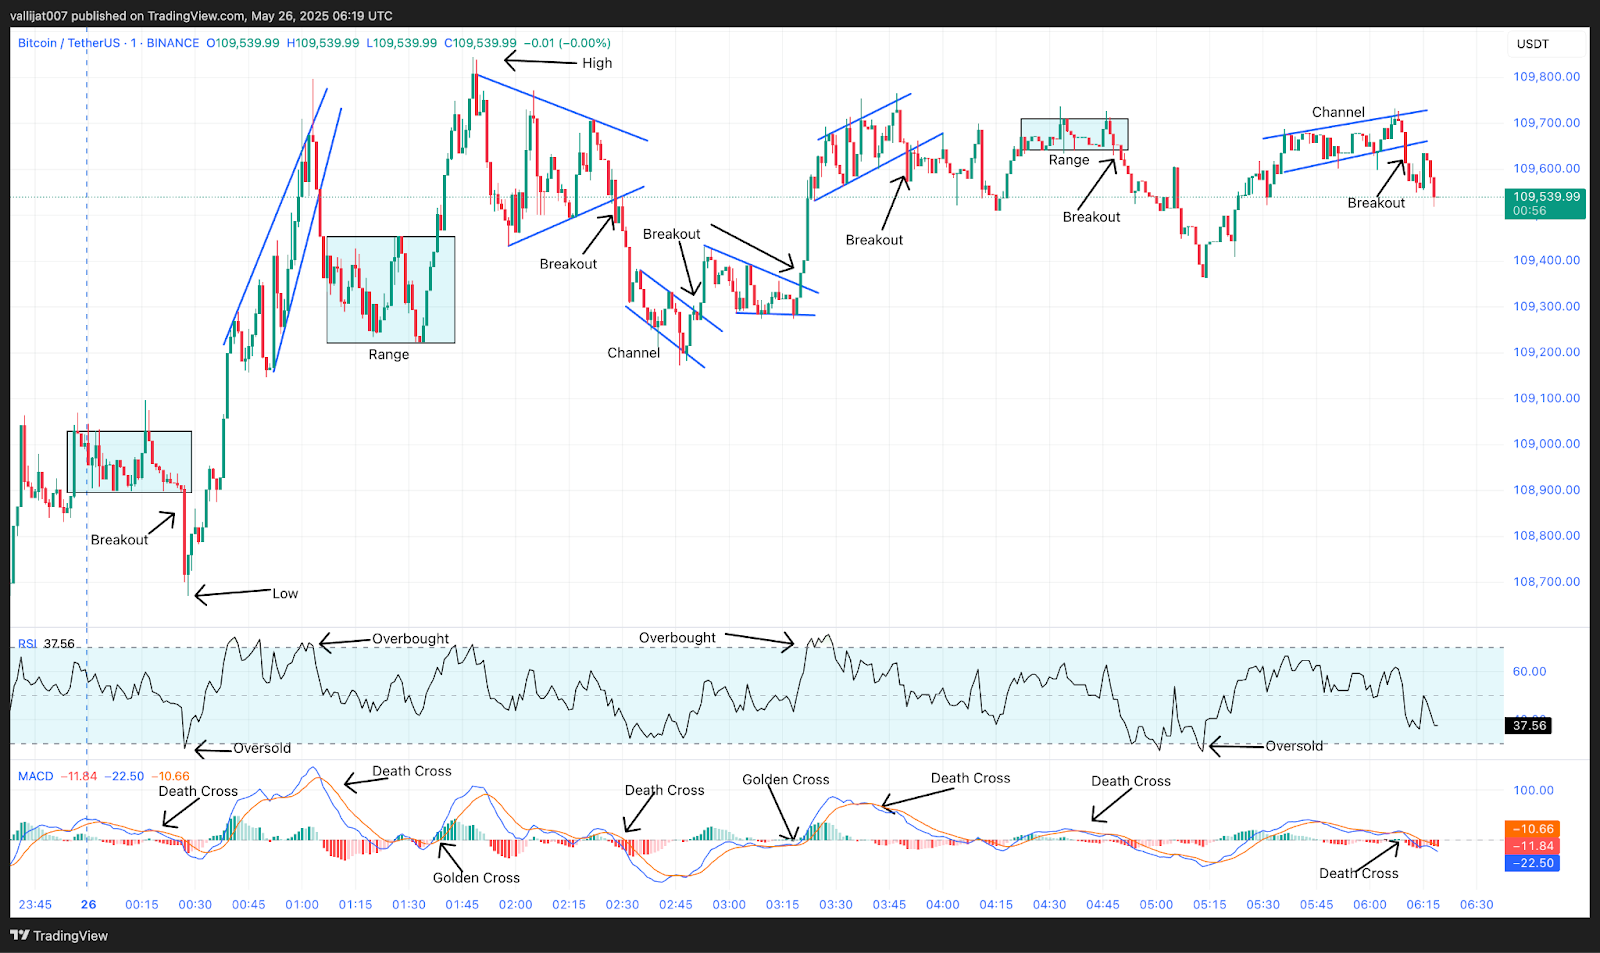
Chart 14: BTC/USDT M1 Chart, Analysed by vallijat007, published on TradingView, May 26, 2025
A small range formed in the Bitcoin price, which broke out to the downside at 00:27 UTC, supported by a death crossover of the MACD. Price dropped to the downside, marking the low for the day at $108,670. However, the downside breakout soon failed, and the price rose to the upside, forming a converging triangle pattern. In the meantime, at 00:48 UTC, RSI moved above the level of 70, indicating overbought market conditions and suggesting a reversal or at least a pullback. The converging triangle pattern broke out to the downside at 01:05 UTC, supported by a death crossover of MACD. The Bitcoin price dropped and formed another Bitcoin range.
Golden Cross Rally Reaches $109,845 High
The range broke out to the upside at 01:38 UTC, supported by a golden crossover of MACD. Price spiked to the upside, marking the high for the day at $109,845. After marking the high, the price formed another converging triangle pattern. This converging triangle broke out to the downside at 02:28 UTC, supported by a death crossover of MACD. The BTC price dropped and formed a downward-moving channel. The downward-moving channel broke out to the upside at 02:52 UTC, supported by a golden crossover of MACD.
Price moved up and formed a converging triangle pattern. The converging triangle pattern broke out to the upside at 03:20 UTC, supported by a golden crossover of MACD. The price formed an upward-moving channel. At 03:25 UTC, RSI moved above the level of 70, indicating overbought market conditions, suggesting a reversal or at least a pullback. The upward-moving channel broke out to the downside at 03:50 UTC, supported by a death crossover of MACD. However, the breakout failed, and the Bitcoin price moved sideways, forming a Bitcoin range.
This range broke out to the downside at 04:50 UTC, supported by a death crossover of MACD, but the price failed to sustain the downtrend. An upward-moving channel appeared in the BTC price. The upward-moving channel broke out to the downside at 06:10 UTC, supported by a death crossover of MACD. If the downside breakout succeeds, Bitcoin may drop to the level of $105,000. If the breakout fails, then the Bitcoin price may rise to the level of $112,000.
Bitcoin Trapped in Choppy Setup, Key Levels in Focus
The fact that Bitcoin does not confirm either upwards or downwards breaks means the market has consolidated, despite large price fluctuations. Bitcoin dropped from its channel due to increased momentum, but if it does not fall and stay below old lows, the price might remain stable. If bears push the price below current levels, Bitcoin could slide toward $105,000. However, a failed breakdown may spark another rally targeting the $112,000 area. With RSI frequently hitting extreme levels and MACD crossovers lacking conviction, traders should stay cautious and wait for a confirmed breakout supported by volume and momentum.
Bitcoin (BTC) Price Analysis of May 30, 2025
Bitcoin began the session in an upward-moving channel, which soon gave way to a downside breakout, triggering a shift into range-bound trading. Successive ranges developed as the Bitcoin price marked its intraday low early in the session. Attempts to recover were met with resistance, as converging triangle patterns repeatedly failed to hold their upside breakouts. MACD signals alternated between bullish and bearish without establishing follow-through, further reinforcing the choppy nature of the market. RSI dipped into oversold territory more than once, hinting at potential reversals, but each time the bounce lacked strength and failed to spark a sustainable move.
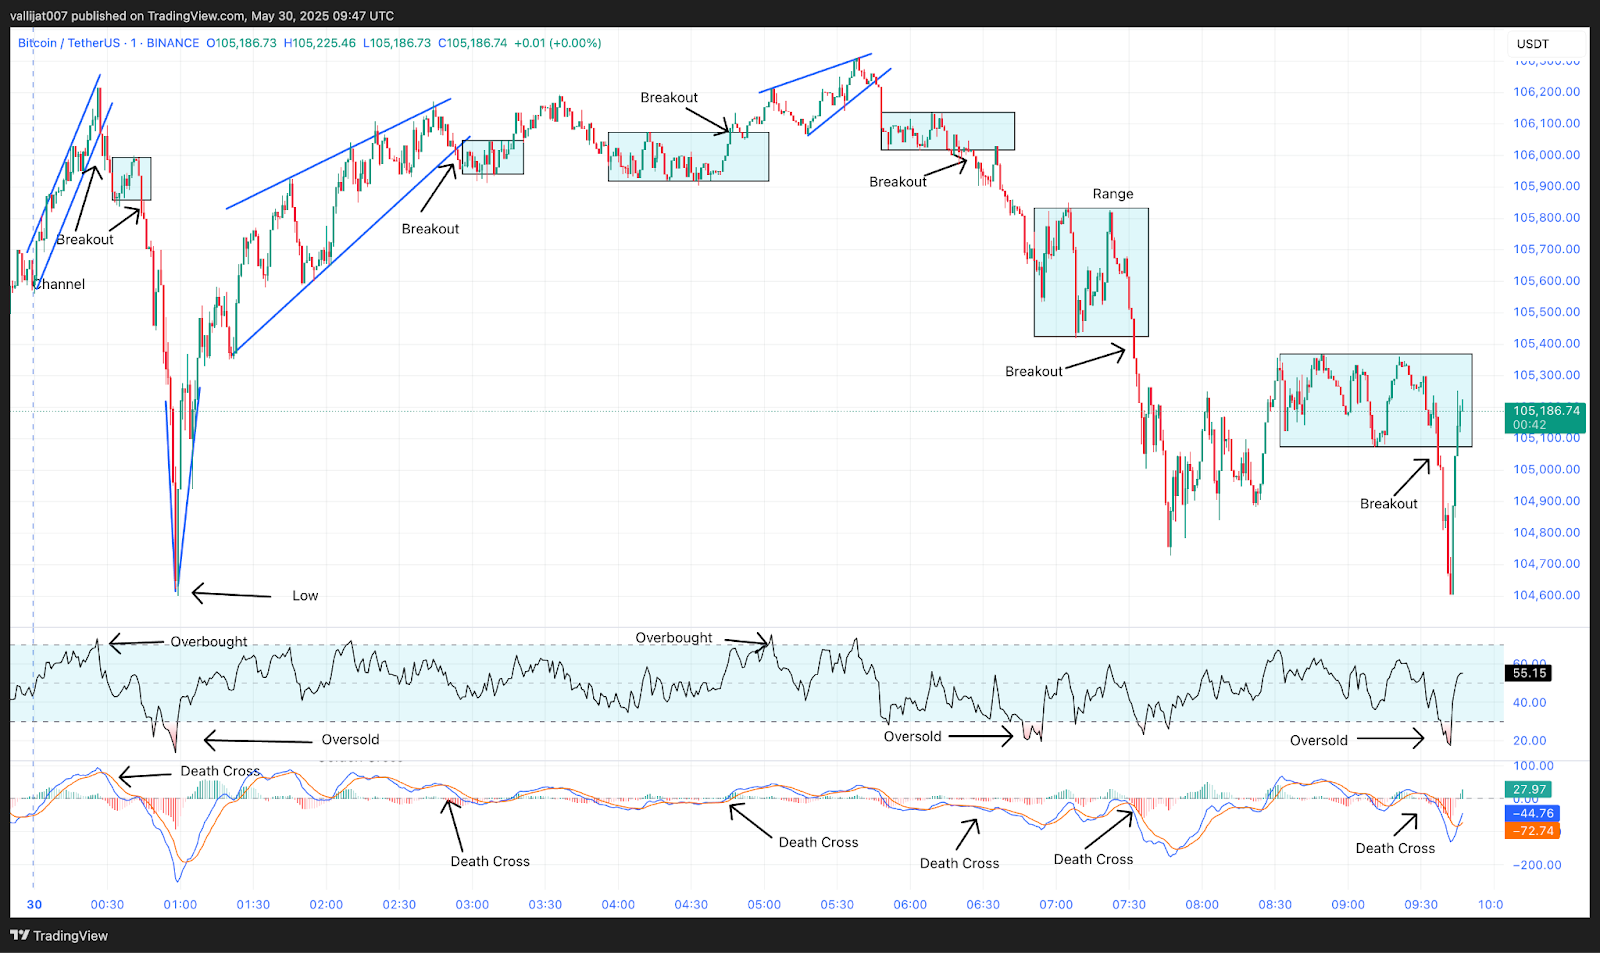
Chart 15: BTC/USDT M1 Chart, Analysed by vallijat007, published on TradingView, May 30, 2025
Bitcoin formed an upward-moving channel, which broke out to the downside at 00:28 UTC, supported by a death crossover of MACD, and formed a range. The range broke out to the downside at 00:44 UTC, supported by a death crossover of MACD, marking the low for the day at $104,600. After marking the low, Bitcoin price moved to the upside, forming a converging triangle pattern.
Critical Support Test: Will BTC Hold or Break Lower?
The converging triangle pattern broke out to the downside at 02:54 UTC, supported by a death crossover of MACD, and formed a range. The range broke out to the upside at 03:17 UTC, supported by a golden crossover of MACD, but the upside Bitcoin breakout failed, and the BTC price formed another range. This second range again broke out to the upside at 04:46 UTC, supported by a golden crossover of MACD, and formed a converging triangle pattern. The converging triangle pattern broke out to the downside at 05:46 UTC, supported by a death crossover of MACD, and formed a range.
The range broke out to the downside at 06:27 UTC, supported by a death crossover of MACD, and formed another range. In the meantime, at 06:48 UTC, RSI dropped below the level of 30, indicating oversold market conditions, suggesting a reversal or at least a pullback. The range broke out to the downside at 07:32 UTC, supported by a death crossover of MACD, and formed another range, which again broke out to the downside at 09:37 UTC, supported by a death crossover of MACD.
However, the downside breakout failed, and the BTC price bounced back into the range. At 09:40 UTC, RSI again dropped below the level of 30, indicating oversold conditions and suggesting a potential reversal or at least a pullback. The BTC price showed a trading range behavior in which most of the breakouts failed to reach their target prices. Traders and investors should be cautious before placing a Bitcoin breakout trade, as Bitcoin is currently trading in a consolidation phase.
Consolidation Dominates, Breakouts Lack Momentum
Bitcoin price action shows clear signs of indecision, with ranges dominating and directional moves stalling quickly. Despite several breakout attempts, both upward and downward, most failed to build momentum or reach expected targets. RSI oversold signals emerged multiple times, suggesting short-term exhaustion in selling pressure, but buyers have yet to take control. Unless there’s a definitive breakout backed by high volume and confirmation, Bitcoin is very likely to remain in a resting phase. A trader should remain cautious and enter new positions only after the market has decided in one direction.
Bitcoin (BTC) Price Analysis of June 1, 2025
Bitcoin’s session opened with bearish momentum, as a downward-moving channel defined the early structure. The initial breakout to the upside triggered by a golden crossover of MACD gave brief bullish hope, but gains were limited as a quick reversal followed. BTC price dipped again, forming a support area that was eventually broken. Oversold RSI conditions began to emerge, signaling potential for a bounce. Indeed, the Bitcoin price rallied and formed an upward channel. Despite a short-lived breakout to the upside, overbought RSI signals soon appeared, and the market returned to tight ranges. The session was marked by short impulses and failed follow-through, typical of a consolidating market.
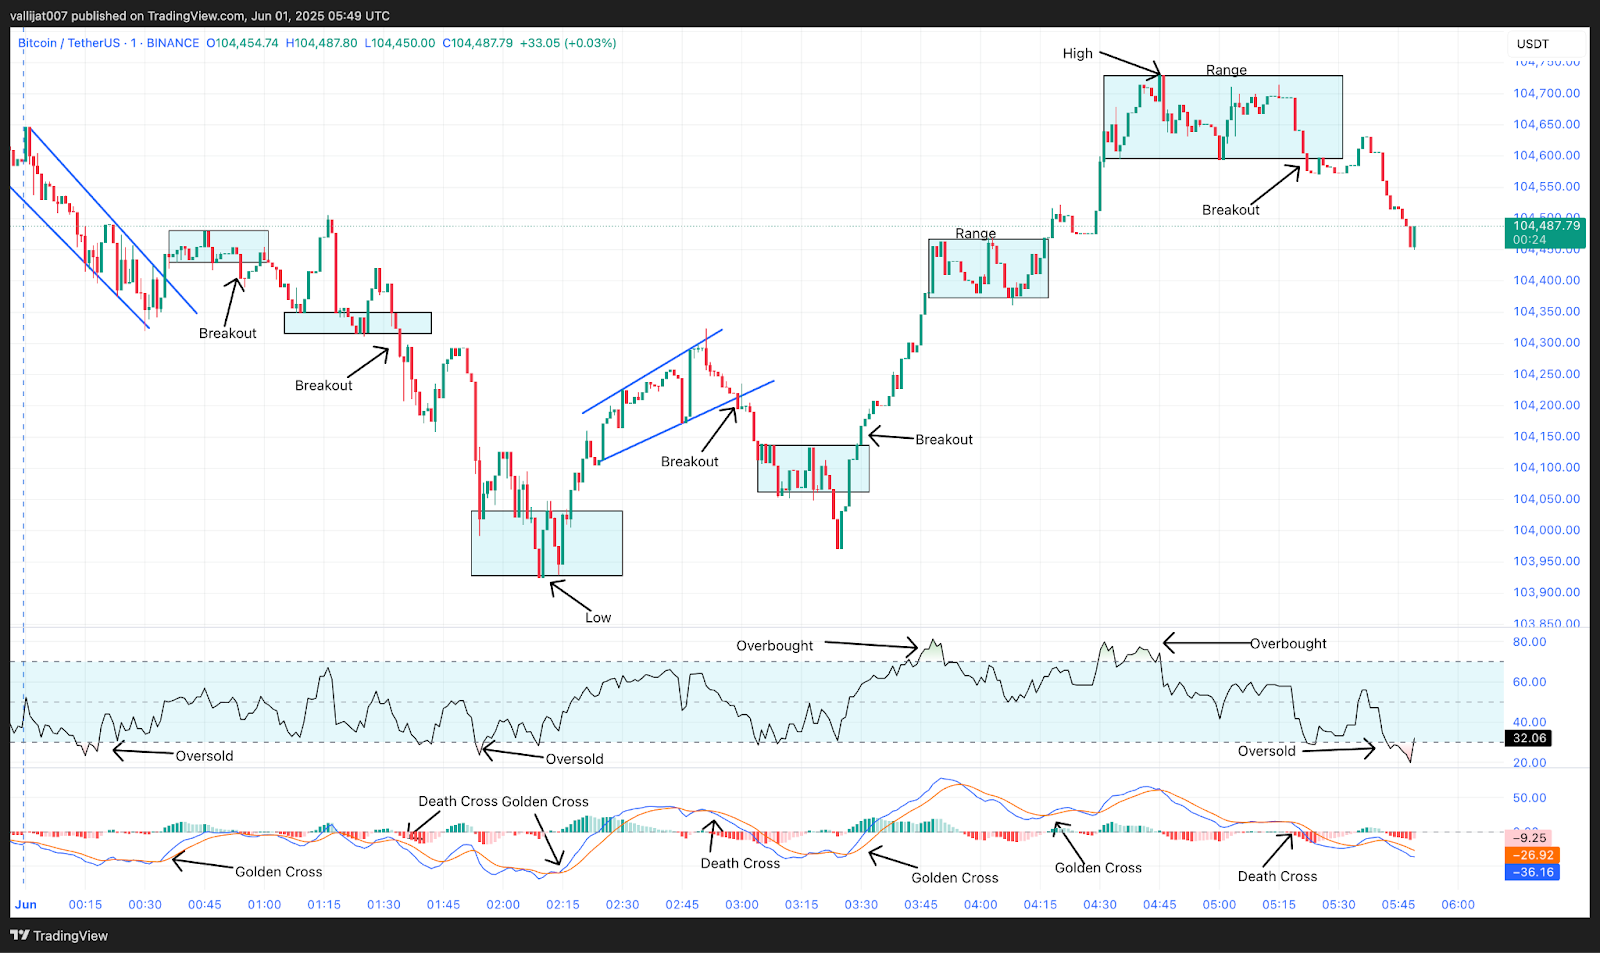
Chart 16: BTC/USDT M1 Chart, Analysed by vallijat007, published on TradingView, June 1, 2025
A downward-moving channel appeared in Bitcoin price, which broke out to the upside at 00:35 UTC, supported by a golden crossover of MACD. Price moved up and formed a range. The range broke out to the downside at 00:54 UTC, supported by a death crossover of MACD, and formed a support area at the level of $104,310. The BTC price broke this support area to the downside at 01:34 UTC, supported by a death crossover of MACD, marking the low for the day at $104,295.
Golden Cross Breakout Reaches $104,730 High
Following marking the low, the Bitcoin price developed a range, which broke out to the top at 02:17 UTC, backed by a golden crossover of MACD, and created an upward-moving channel. Supported by a MACD death crossover, the channel that was moving upward broke out to the downside at 02:59 UTC to create a range. RSI declined under the 30-level at 03:04 UTC, suggesting oversold market circumstances and therefore a comeback or perhaps even a retracement.
At 03:30 UTC, the range rose to the upside, backed by a golden MACD crossover, hence defining another range. RSI rose over the 70 level at 03:50 UTC, showing oversold market conditions and therefore either a reversal or at least a pullback. With MACD’s golden crossover at 04:18 UTC, the range broke out to the upside and marked the high for the day at $104,730. RSI once again broke above 70 at 04:45 UTC, strengthening oversold circumstances and the possibility of a pullback.
At 05:22 UTC, assisted by a MACD death crossover, the range broke down to the downside. Meanwhile, at 05:25 UTC, RSI fell under the 30 level, pointing to oversold market circumstances and implying a possible turnaround or pullback. Should the negative breakout work, the price could fall to the level of $103,800. Should the Bitcoin breakout fall apart, then the price might climb to the level of $105,000.
Bitcoin Shows Classic Range-Bound Behavior with Weak Breakout Momentum
Bitcoin price action remains choppy, reflecting a lack of strong directional conviction. Breakouts, whether bullish or bearish, have largely failed to extend into trends, instead falling back into narrow ranges. RSI oscillated between overbought and oversold zones, confirming the indecisive nature of the market. MACD signals supported this indecision, with golden and death crossovers triggering temporary moves that lacked momentum. Until Bitcoin price can decisively break key technical levels with volume and strength, Bitcoin is likely to remain in this sideways pattern. Traders should wait for confirmed Bitcoin breakouts and avoid chasing unreliable signals during this consolidation phase.
Bitcoin (BTC) Price Analysis June 4, 2025
Bitcoin price action on June 4 opened with upward momentum, forming an ascending channel. However, this early strength faded as the channel broke to the downside, and an expanding triangle emerged, marking the day’s low at $105,132. A subsequent recovery led to new highs, peaking at $105,840, but overbought RSI signals and MACD death crossovers repeatedly stalled bullish attempts. Throughout the session, the Bitcoin trend oscillated between ranges and short-lived channels, with MACD crossovers dictating momentum. Despite several upside attempts, no trend held firmly, reflecting indecision. Both buyers and sellers struggled to control direction as the price traded within a tight band.
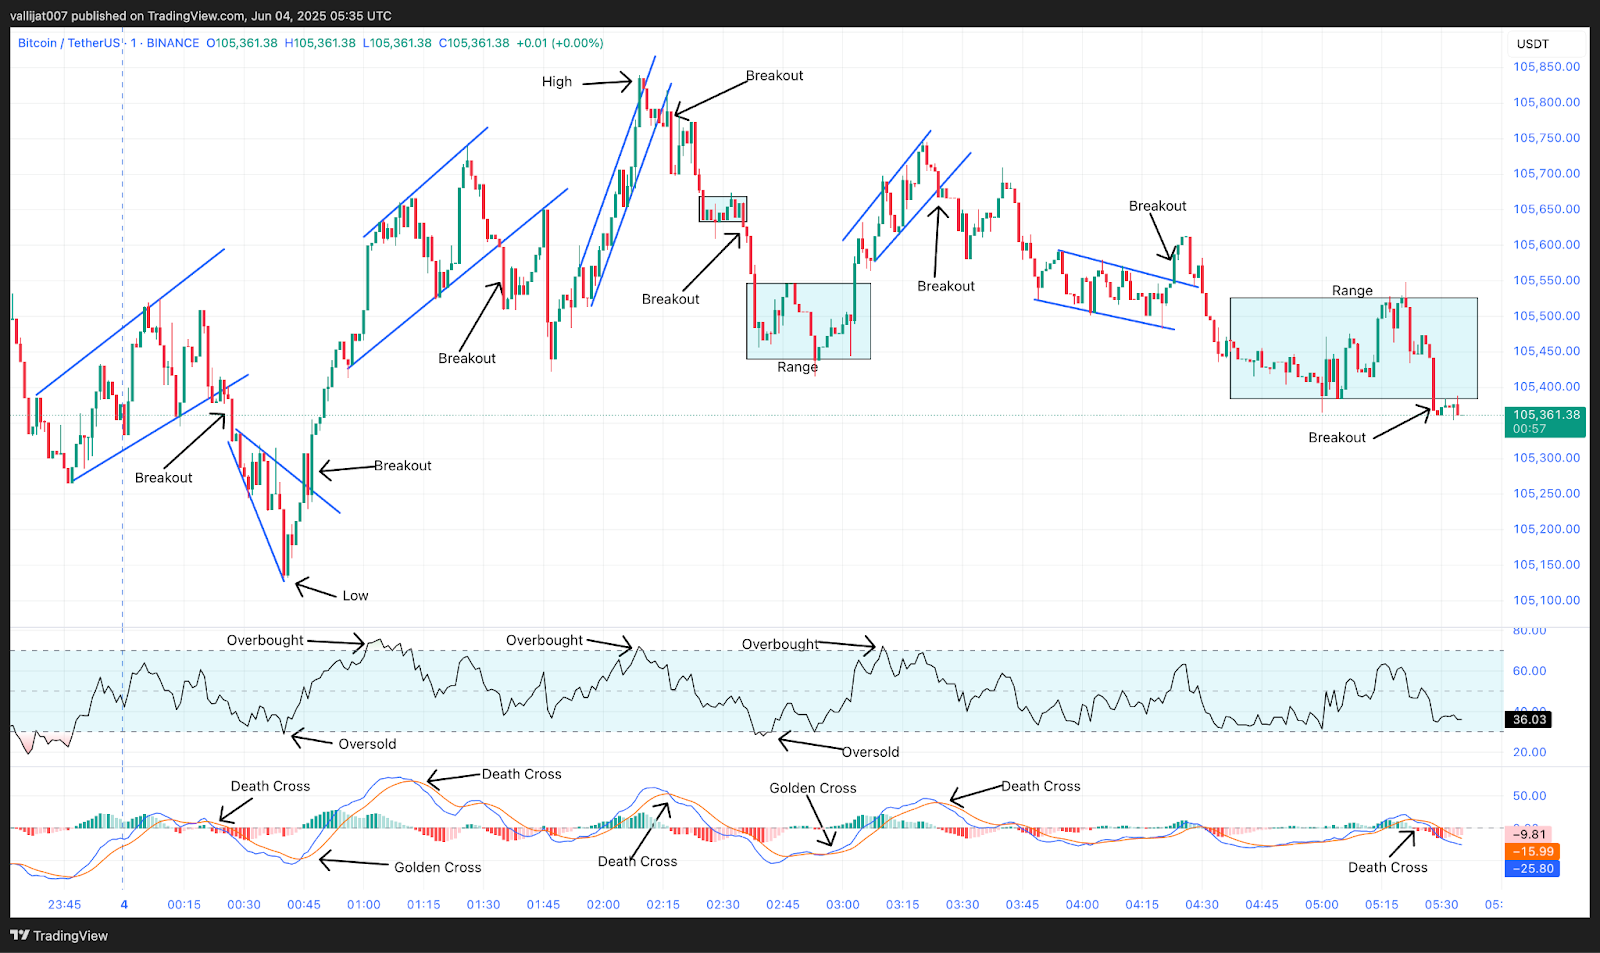
Chart 17: BTC/USDT M1 Chart, Analysed by vallijat007, published on TradingView, June 4, 2025
The Bitcoin price formed an upward-moving channel. The channel broke out to the downside at 00:27 UTC, supported by a death crossover of the MACD. The BTC price moved lower and formed an expanding triangle pattern, which marked the low for the day at $105,132. The expanding triangle pattern broke out to the upside at 00:47 UTC, supported by a golden crossover of MACD, and formed an upward-moving channel. In the meantime, at 01:05 UTC, RSI moved above the level of 70, indicating overbought market conditions and suggesting a reversal or at least a pullback.
Overbought RSI Triggers Pullback from Highs
The upward-moving channel broke out to the downside at 01:35 UTC, supported by a death crossover of MACD. However, the downside breakout failed, and another upward-moving channel formed. This channel marked the high for the day at $105,840. RSI rose above 70 at 02:10 UTC once more, pointing to oversold markets and hinting at either a turnaround or at least a pullback. Supported by MACD’s death crossover, the channel broke out to the downside at 02:17 UTC to create a range.
Backed by a MACD death crossover, the range broke out to the downside at 02:35 UTC and then formed yet another range. RSI fell under 30 at 02:40 UTC, pointing to oversold market conditions and indicating a reversal or at least a pullback. Supported by a golden crossover of MACD, the range broke out upward at 03:03 UTC, and an upward-moving channel followed. At 03:24 UTC, this channel broke out to the downside, propelled by a death crossover of MACD, and formed a downward-trending channel.
The downward-moving channel broke out to the upside at 04:23 UTC, supported by a golden crossover of MACD, but the upside breakout failed. The Bitcoin trend dropped again and formed a range. The range broke out to the downside at 05:28 UTC, supported by a death crossover of MACD. If the breakout succeeds, then the Bitcoin price may drop to the level of $105,000. If the breakout fails, then the BTC price may rise to $106,000.
Bitcoin Trapped in Uncertain Momentum
Bitcoin’s session was characterized by failed breakout attempts and alternating MACD signals, reflecting a market caught in short-term indecision. While the Bitcoin price did touch both extreme RSI levels, overbought and oversold, these signals only generated temporary reversals. Breakouts from both channels and ranges failed to develop sustainable momentum. The inability to hold either support or resistance zones suggests traders are hesitant to commit in the absence of clear direction. If Bitcoin holds above $105,000, another attempt toward recent highs is possible. Conversely, a breakdown below this support could expose downside risk. Until then, the price may remain stuck in a consolidation zone.
Bitcoin (BTC) Price Analysis—June 8, 2025
The Bitcoin price opened the session in a consolidation range and began with an attempted bullish breakout at 00:32 UTC, supported by a golden MACD crossover. However, momentum quickly faded, and BTC slipped into choppy formations of ranges and triangle patterns. A series of golden crossovers failed to sustain trends, and multiple RSI readings above 70 signaled market saturation, capping upside moves. Bitcoin marked the high of the day at $105,826 during an expanding triangle Bitcoin breakout but retraced quickly, bottoming at $105,455. Intraday structure remained dominated by short-lived breakouts and persistent range formations, indicating uncertainty and indecision among traders.
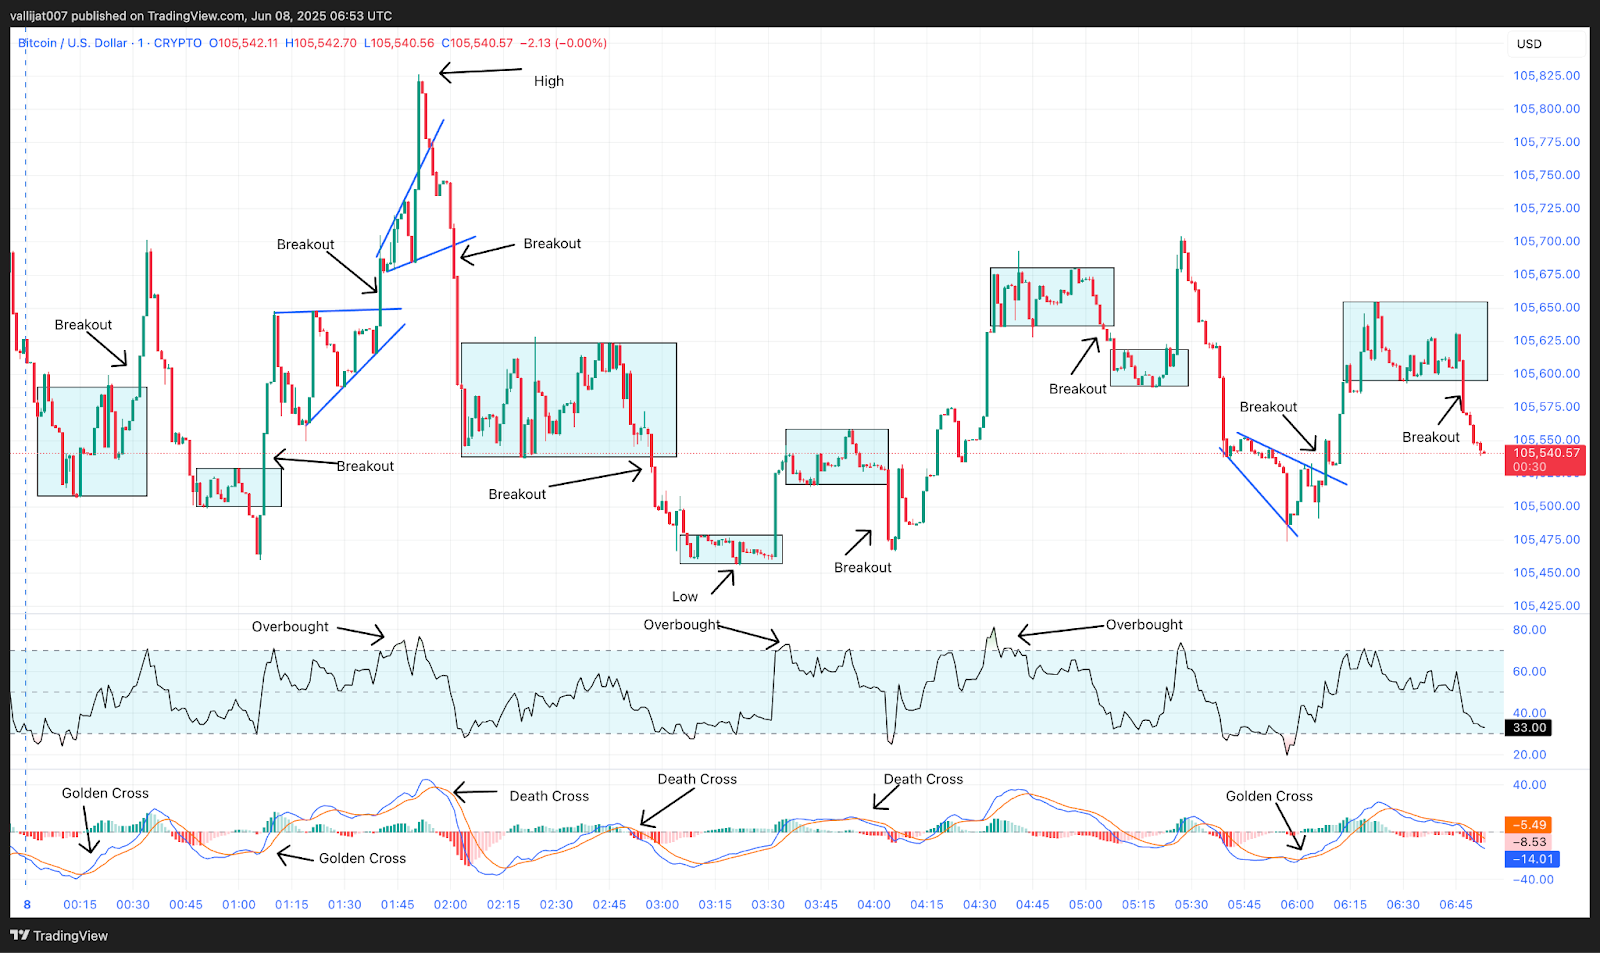
Chart 18: BTC/USDT M1 Chart, Analysed by vallijat007, published on TradingView, June 8, 2025
The Bitcoin price formed a range. The range broke out to the upside at 00:32 UTC, supported by a golden crossover of MACD, but the upside breakout soon failed, and the BTC price dropped to the downside, forming another range. The second range again broke out to the upside at 01:07 UTC, supported by a golden crossover of MACD, and formed a converging triangle pattern. The converging triangle pattern broke out to the upside at 01:40 UTC, supported by a golden crossover of MACD, and formed an expanding triangle pattern.
The $105K-$106K Battlezone: Bitcoin’s Critical Inflection Point
RSI rose above the 70 threshold at 01:45 UTC, which pointed toward overbought market circumstances and hence a reversal or at least a retreat. Supported by a golden crossover of MACD, the growing triangle pattern broke out to the top at 01:51 UTC and established the high for the day at $105,826. The Bitcoin breakout soon faltered, though, and the BTC price fell to the downside to create a range. Supported by a MACD death crossover, the range broke down to the downside at 02:57 UTC and created another range, noting the low for the day at $105,455.
Supported by a golden crossover of MACD, the range broke out to the upside at 03:32 UTC and then formed another range. RSI crossed 70 at 03:35 UTC, signifying overbought conditions and pointing to at least a pullback in the meantime. Backed by a death crossover of MACD, the range tried to break out to the downside at 04:04 UTC, but the downside breakout failed, and the price surged upward to create another range. Supported by a MACD death cross, the range dropped to the downside at 05:05 UTC to create another range. Supported by a golden MACD crossover, this range rose toward 05:26 UTC.
But the breakout failed and the price dropped to the downside, forming an expanding triangle pattern. At 05:57 UTC, RSI dropped below the level of 30, indicating oversold market conditions, suggesting a reversal or at least a pullback. The expanding triangle pattern broke out to the upside at 06:08 UTC, supported by a golden crossover of MACD, and formed a range. The range broke out to the downside at 06:47 UTC, supported by a golden crossover of MACD. If the breakout succeeds, the Bitcoin price may drop to the level of $105,000. If the breakout fails, the Bitcoin price may rise to the level of $106,000.
BTC Eyes $106,000 but $105,000 Breakdown Risk Lingers
Bitcoin’s current volatility means that the market is not sure where it is going. Before, the stock looked strong and rose, but it soon had trouble breaking through high levels and became too expensive for investors. On the other hand, the oversold RSI seen at 05:57 UTC caused a rise, yet the momentum has been unreliable. According to the chart, the latest decline could test Bitcoin at $105,000. Nevertheless, if a breakdown fails, it could result in a move toward $106,000. Generally, the price of BTC is moving within a limited range, with not much confidence in either direction, so traders need to be watchful of fake advancements.
Bitcoin Price Analysis of June 10, 2025
Bitcoin price showed a bearish tone throughout the session, with key indicators reflecting both oversold and overbought extremes. At 02:10 UTC, RSI dropped below 30, signaling oversold conditions. A converging triangle broke to the downside at 03:02 UTC, followed by a short-lived recovery that led to an upward-moving channel. However, most upside moves faded quickly. At 05:18 UTC, RSI moved above 70, signaling overbought conditions. Despite multiple golden crossovers, bullish breakouts were short-lived. The low for the day was marked at $109,060, and a late recovery attempt followed a golden crossover of MACD at 09:10 UTC. The Bitcoin price is currently trading at $109,500.
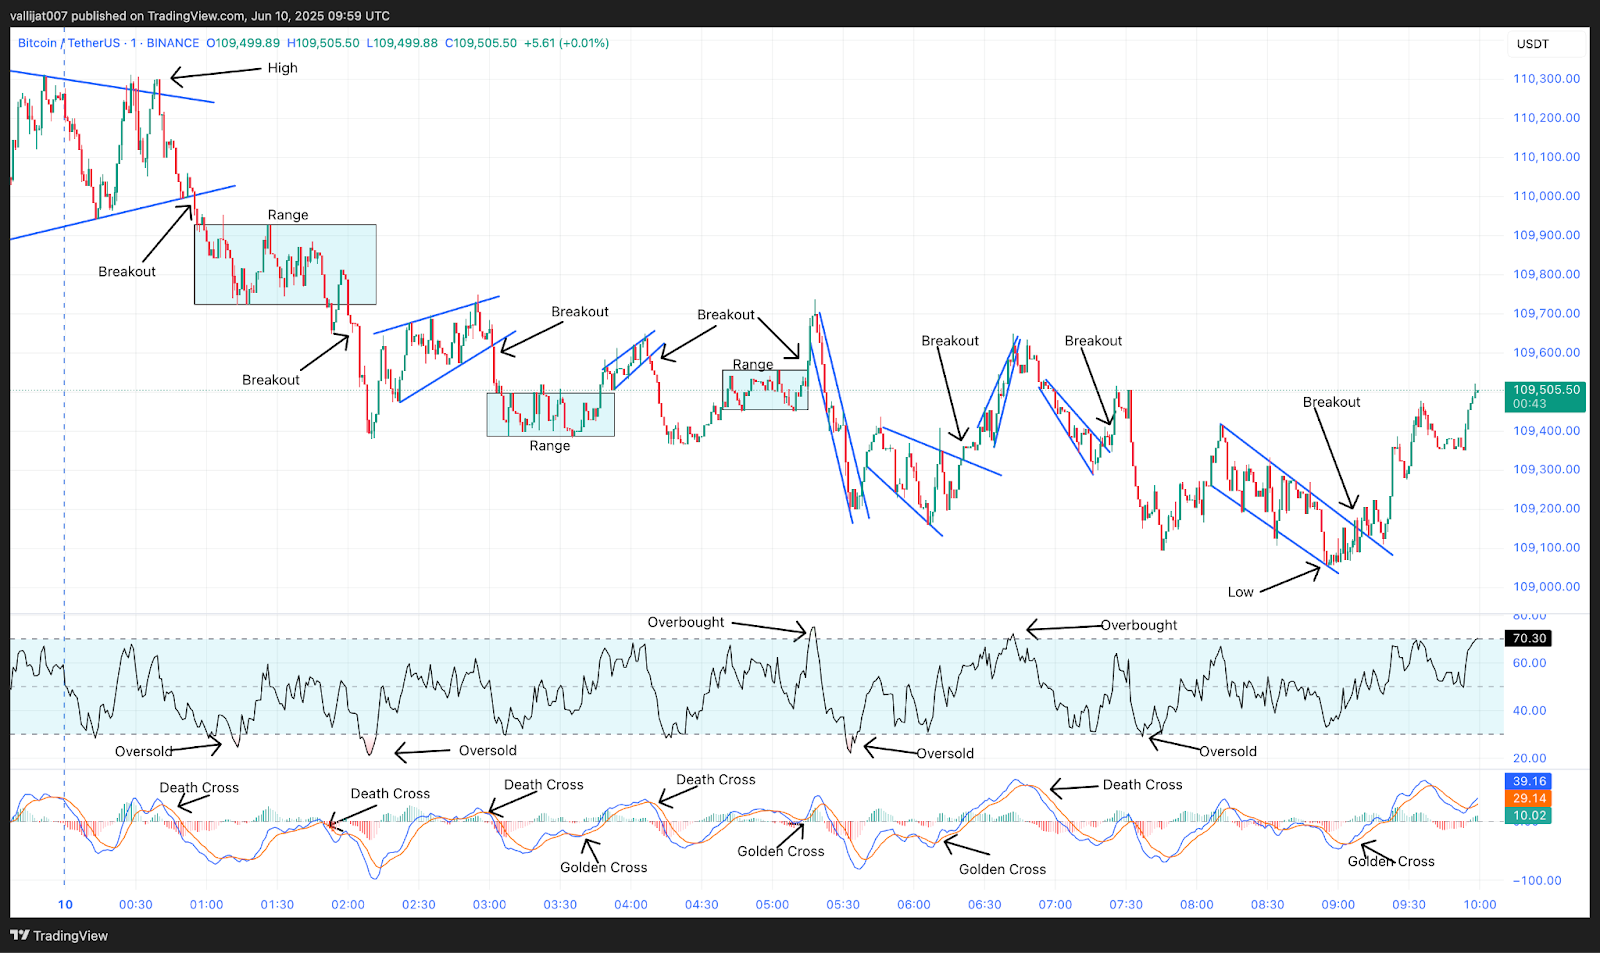
Chart 19: BTC/USDT M1 Chart, Analysed by vallijat007, published on TradingView, June 10, 2025
The Bitcoin price at 02:10 UTC RSI dropped below the level of 30, indicating oversold market conditions. The converging triangle pattern broke out to the downside at 03:02 UTC, supported by a death crossover of MACD. The BTC price moved back to the downside and formed a range. The range broke out to the upside at 03:47 UTC, supported by a golden crossover of MACD. Price spiked to the upside and formed an upward-moving channel.
MACD Crossovers in BTC: Reliable Signals or False Alarms?
Supported by a MACD crossover, the channel with an upward trend broke down to the downside at 04:00 UTC. Although the BTC price dropped sharply at first, the downward momentum quickly stopped, and a range emerged. The range broke out to the upside at 05:15 UTC, supported by a golden MACD crossover. Although the price rose to the upside, the upside breakout failed, and a downward channel developed. RSI above the 70 level at 05:18 UTC suggested overbought market circumstances, therefore implying a reversal or at least a pullback. Supported by a golden crossover of MACD, the downward-moving channel broke out to the upside at 05:40 UTC.
Price spiked to the upside and formed an expanding triangle pattern. The expanding triangle pattern broke out to the upside at 06:21 UTC, supported by a golden crossover of MACD. The Bitcoin trend spiked to the upside and formed an upward-moving channel. Bitcoin price broke out to the downside at 06:47 UTC, supported by a death crossover of MACD. The Bitcoin price spiked to the downside and formed a downward-moving channel. The downward-moving channel broke out to the upside at 07:25 UTC, supported by a golden crossover of MACD.
Price spiked to the upside, but the upside breakout faded away, and price dropped to the downside, forming a downward-moving channel. The downward-moving channel marked the low for the day at $109,060. The downward-moving channel broke out to the upside at 09:10 UTC, supported by a golden crossover of MACD. If the breakout succeeds, then the price may rise to the level of $111,000. If the breakout fails, then the price may drop to the level of $108,000. The Bitcoin price showed bearish sentiment throughout the day. Most of the downside breakouts succeeded in their projected targets, while upside breakouts reversed or faded away.
$109,060 Low Signals Bearish Pressure, $111,000 Key Level to Watch
Bitcoin price action reflected a market weighed down by bearish sentiment. Most downside breakouts succeeded, while upside attempts frequently reversed or lost steam. The formation of several downward-moving channels suggests persistent selling pressure. Although golden MACD crossovers provided temporary lifts, the rallies lacked conviction. The $109,060 low stands as a critical support. If the breakout at 09:10 UTC holds, the Bitcoin trend may attempt to climb toward $111,000. Still, should buyers not improve their progress, Bitcoin may return to the $108,000 support zone. Those active in the markets should be careful and make sure all signs point to a real momentum shift before risking their money.
Bitcoin Price Analysis of June 13, 2025
Bitcoin price action on June 13, 2025, began with a range that marked the high for the day at $104,100. A downward breakout set off a series of bearish patterns early in the session, including converging triangles and down channels. With RSI falling below 30, technical indicators displayed great volatility, therefore emphasizing a highly oversold state. Most bullish breakouts lacked consistent momentum, even if they had occasional recoveries. MACD signals played a critical role in identifying trend shifts throughout the session. After a steep drop, the price bottomed at $102,664 before attempting another recovery amid a mix of conflicting signals and short-lived trends. Currently, Bitcoin price is trading at $104,400.
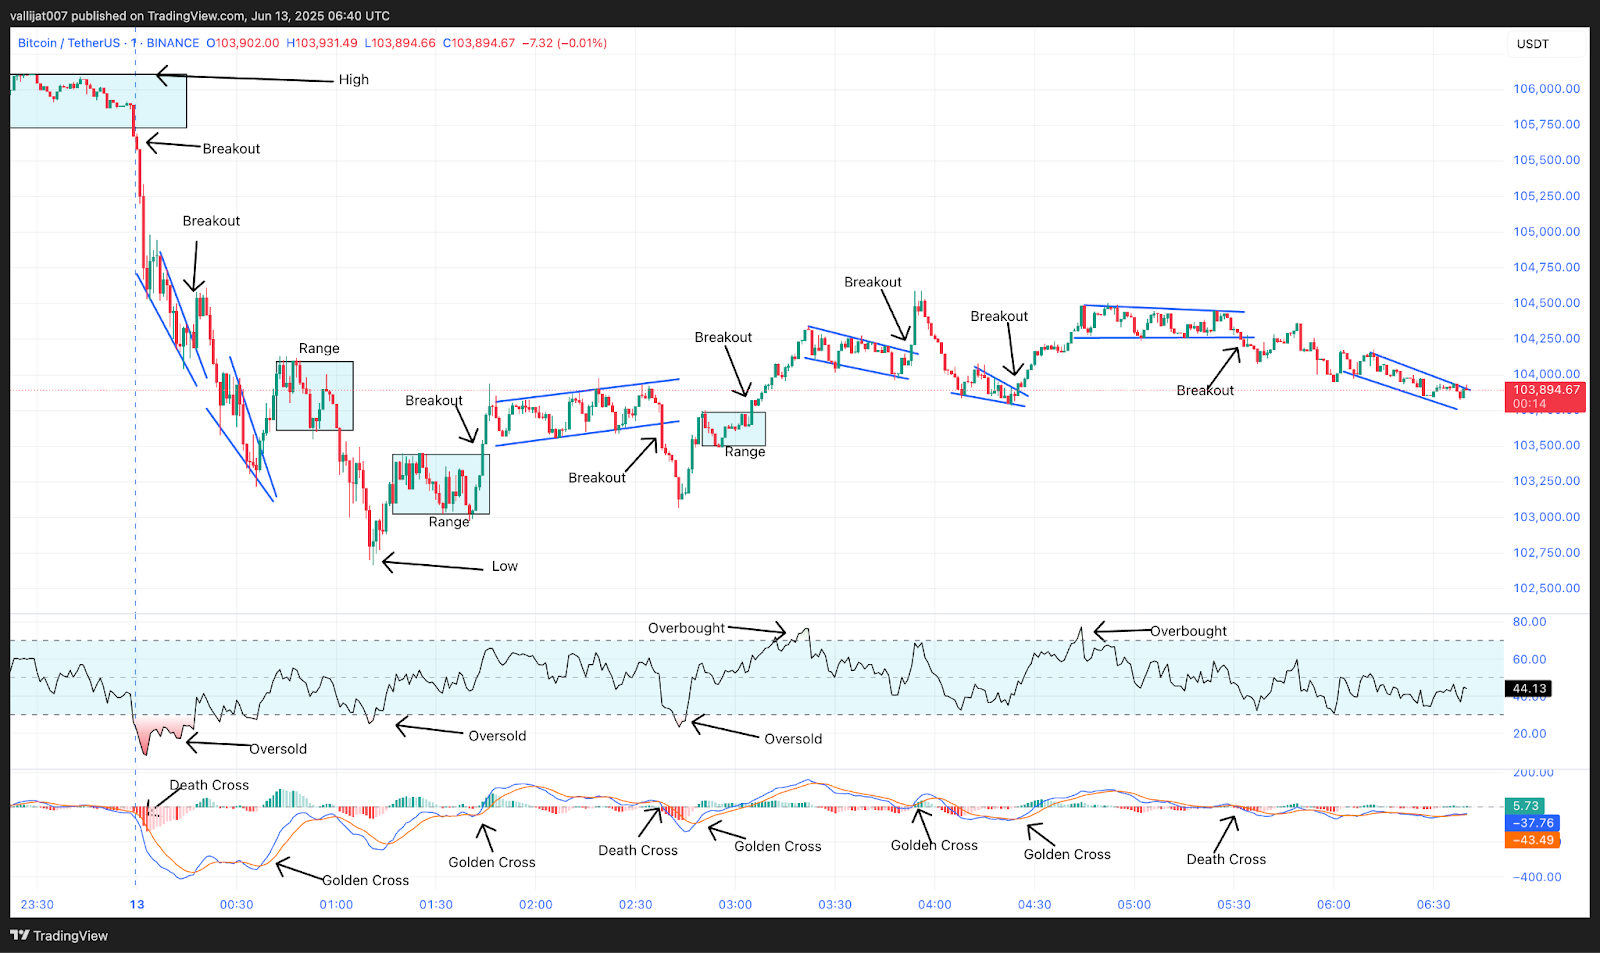
Chart 20: BTC/USDT M1 Chart, Analysed by vallijat007, published on TradingView, June 13, 2025
Bitcoin price formed a range, which marked the high for the day at $104,100. The range broke out to the downside at 00:00 UTC, supported by a death crossover of MACD, and formed a downward converging triangle pattern. RSI fell below the 30-level at 00:05 UTC, pointing to oversold market circumstances and implying a turnaround or at least a pullback. Supported by a golden crossover of MACD, the converging triangle pattern broke out to the upside at 00:18 UTC, but the upside breakout failed, and the Bitcoin price fell to the downside.
Range Breakdown Establishes Session Low at $102,664
Another converging triangle pattern appeared. The second converging triangle pattern broke out to the upside at 00:38 UTC, supported by a golden crossover of MACD, and a range developed. The range broke out to the downside at 01:01 UTC, supported by a death crossover of MACD, marking the low at $102,664. After marking the low, BTC price formed a range, which broke out to the upside at 01:44 UTC, supported by a golden crossover of MACD, and formed an upward-moving channel.
Oversold RSI at 02:43 UTC Leads to Upside Range Breakout
The channel broke out to the downside at 02:38 UTC, supported by a death crossover of MACD, but the Bitcoin breakout soon faded, and the BTC price rose to the upside. At 02:43 UTC, RSI dropped below the level of 30, indicating oversold market conditions, and a range developed. The range broke out to the upside at 03:05 UTC, supported by a golden crossover of MACD, and formed a downward-moving channel. The downward-moving channel broke out to the upside at 03:53 UTC, supported by a golden crossover of MACD.
But momentum soon faded, and the price dropped to the downside, forming a converging triangle pattern. The converging triangle pattern broke out to the upside at 04:25 UTC, supported by a golden crossover of MACD, and formed a channel. At 04:45 UTC, RSI moved above the level of 70, indicating overbought market conditions. The channel broke out to the downside at 05:32 UTC, supported by a death crossover of MACD, forming a downward-moving pattern.
$104,100 to $102,664: Failed Recoveries Cap Bitcoin’s Volatile Downturn
Bitcoin’s session was defined by aggressive selling pressure and weak recovery attempts. While MACD golden crossovers occasionally lifted the Bitcoin price, these moves often failed to follow through. The intraday low at $102,664 reflected the broader bearish sentiment, compounded by RSI repeatedly flashing oversold readings. Despite forming upward-moving channels and bullish structures later in the session, overbought RSI levels and death crossovers capped gains. The price eventually returned to a downward trajectory, closing within a bearish pattern. Traders should approach with caution, as Bitcoin remains range-bound with a clear lack of directional conviction and a tendency for Bitcoin breakout reversals.
Bitcoin Price Analysis of June 16, 2025
Bitcoin price opened in a consolidation phase and marked its low for the day at $104,980 within an early trading range. Following a golden MACD crossover at 01:37 UTC, the price began a series of bullish formations, including converging triangles and ascending ranges, accompanied by multiple RSI overbought signals. Each Bitcoin breakout was met with diminishing momentum, but price action gradually pushed higher throughout the session. By 08:38 UTC, Bitcoin reached its high for the day at $107,255 before entering a corrective structure marked by a downward-moving channel. Currently, BTC price is trading at $107,000.
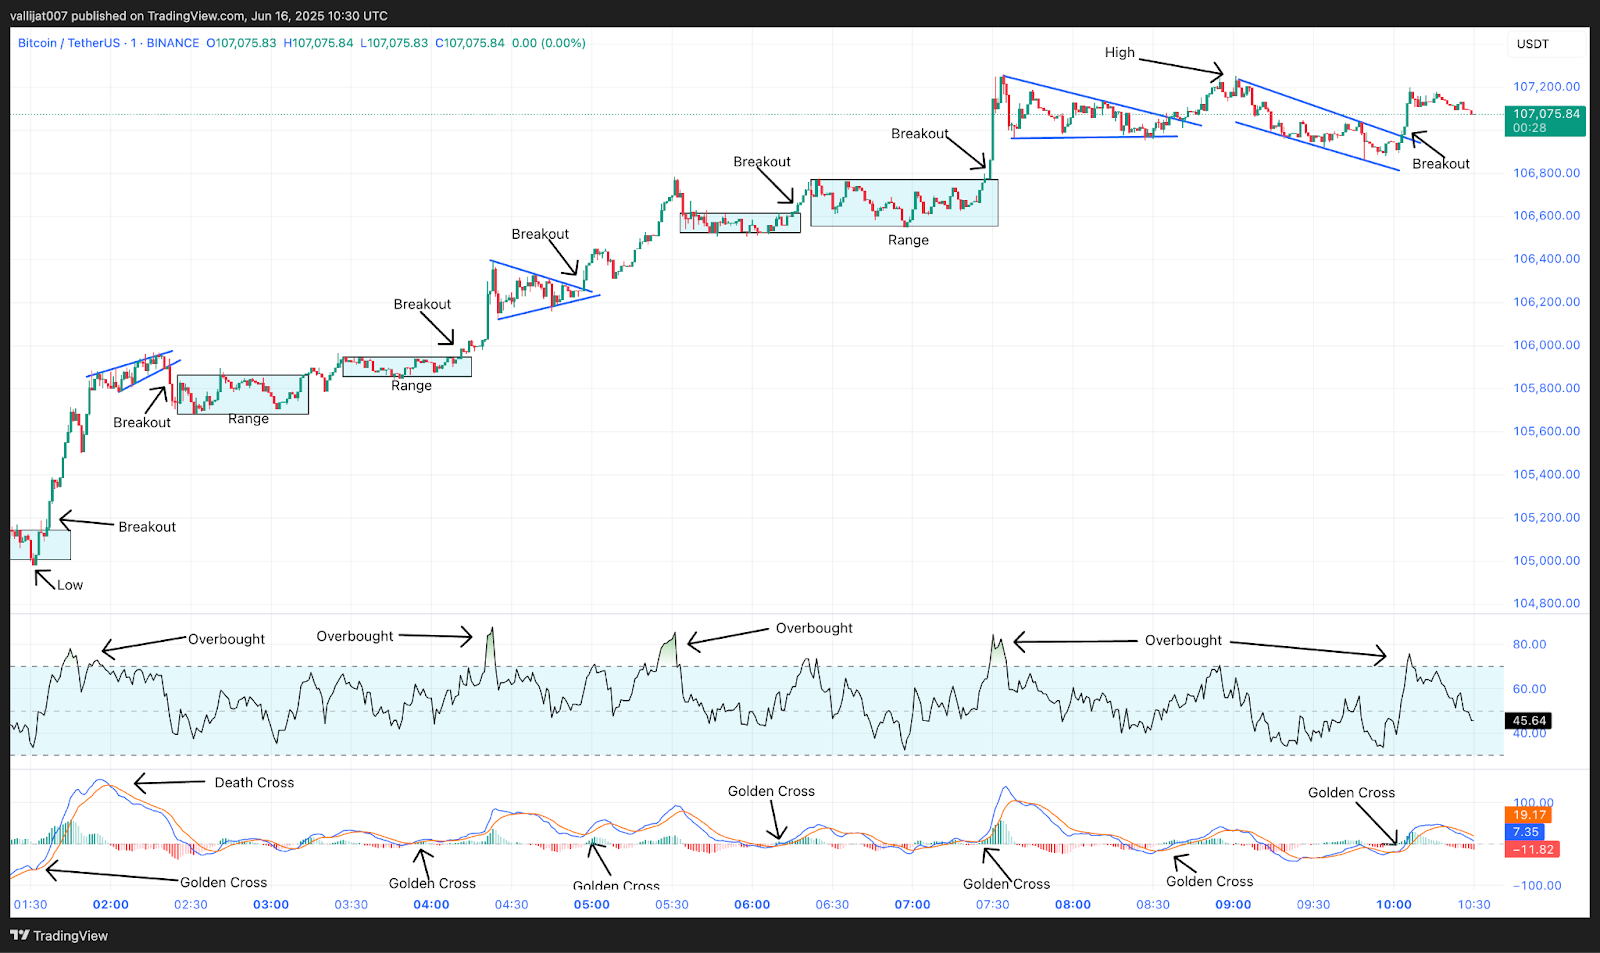
Chart 21: BTC/USDT M1 Chart, Analysed by vallijat007, published on TradingView, June 16, 2025
Bitcoin price formed a range, which marked the low for the day at $104,980. The range broke out to the upside at 01:37 UTC, supported by a golden crossover of MACD, and formed a converging triangle pattern. At 01:45 UTC, RSI moved above the level of 70, indicating overbought market conditions and suggesting a reversal or at least a pullback. The converging triangle pattern broke out to the downside at 02:22 UTC, supported by a death crossover of MACD, and formed a range. The range broke out to the upside at 03:13 UTC, supported by a golden crossover of MACD, and another range developed.
Initial Range Breakout at 04:11 UTC Forms Converging Triangle
Supported by a golden MACD crossover, the range broke to the upside at 04:11 UTC and created a converging triangle pattern. RSI above 70 at 04:22 UTC showed overbought market conditions. At 04:51 UTC, supported by a golden crossover of MACD, the converging triangle pattern broke out to the upside and grew into a range. RSI kept above 70 at 05:30 UTC, once more indicating overbought market conditions and a high probability of a reversal or pullback.
Converging Triangle Breakout at 08:38 UTC Establishes Daily High
The range broke out to the upside at 06:17 UTC, supported by a golden crossover of MACD, and another range developed. The range broke out to the upside at 07:29 UTC, supported by a golden crossover of MACD, and formed a converging triangle pattern. At 07:30 UTC, RSI was above 70, indicating continued overbought market conditions. The converging triangle pattern broke out to the upside at 08:38 UTC, supported by a golden crossover of MACD, marking the high for the day at $107,255.
However, the upside momentum faded, and the BTC price formed a downward moving channel. The downward-moving channel broke out to the upside at 10:04 UTC, supported by a golden crossover of MACD, in an attempt to continue the bullish momentum. If the Bitcoin breakout succeeds, the price may reach the level of $109,000. If the breakout fails, the price may drop to the level of $106,000.
$107,255 High Faces Rejection as Bitcoin Struggles for Direction
Despite a strong intraday rally, the Bitcoin breakout above $107,000 lost steam after repeated RSI overbought signals and a failure to maintain bullish momentum post-breakout. The downward-moving channel that formed afterward reflects short-term exhaustion in buying pressure. Although a golden crossover of MACD at 10:04 UTC hints at a potential continuation, traders should be cautious. If bullish strength re-emerges, Bitcoin price could attempt to reach $109,000. However, a failed breakout may lead to a decline toward the $106,000 support area. Overall, Bitcoin remains in a volatile range with breakout trades prone to rapid reversals.
Bitcoin Price Analysis of June 19, 2025
Bitcoin price traded within a tightly fluctuating range, eventually establishing the day’s high at $105,226 at 00:20 UTC and the low at $104,457 at 01:33 UTC. The session began with a downside breakout, followed by a series of rapid MACD crossovers that failed to establish any strong directional trend. BTC Price action was dominated by short-lived ranges, converging triangle formations, and shifting momentum signals on both the RSI and MACD indicators. Overall, BTC showed strong intraday volatility without committing to a sustained trend.
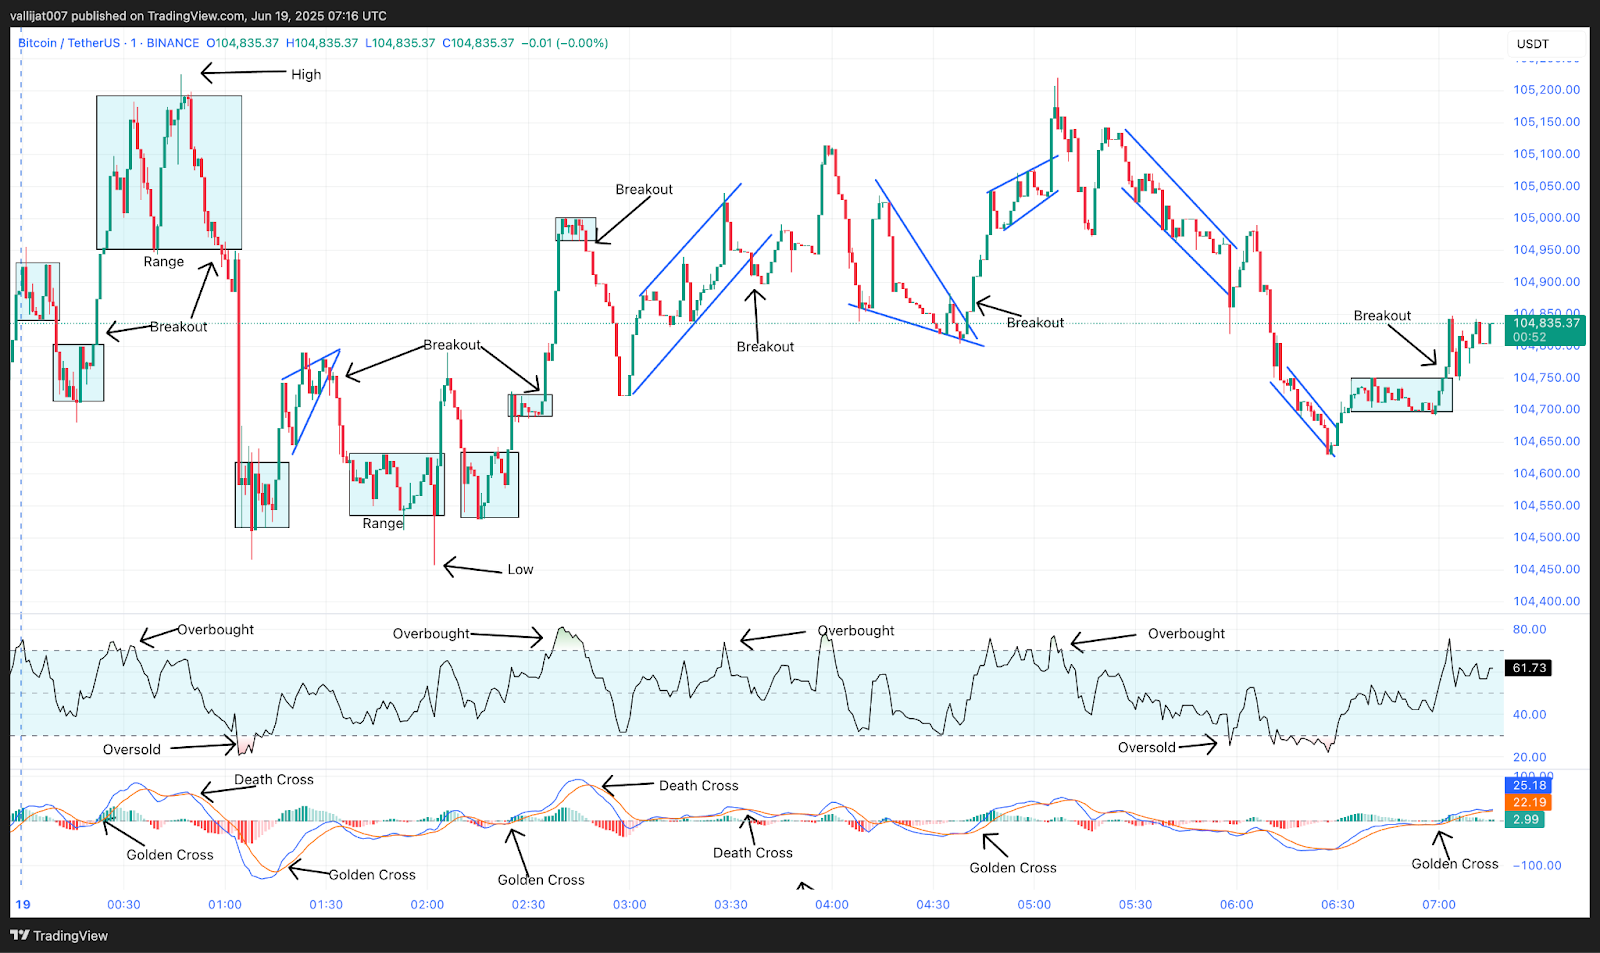
Chart 22: BTC/USDT M1 Chart, Analysed by vallijat007, published on TradingView, June 19, 2025
Bitcoin price formed a range. The range broke out to the downside at 00:11 UTC, supported by a death crossover of MACD, with price moving back to the downside and forming another range. That range broke out to the upside at 00:20 UTC, supported by a golden crossover of MACD, and developed into another range. The range marked the high for the day at $105,226. It broke out to the downside at 00:59 UTC, supported by a death crossover of MACD, and another range developed. At 01:04 UTC, RSI dropped below the level of 30, indicating oversold market conditions and suggesting a reversal.
Initial Range Breakout at 01:16 UTC Forms Converging Triangle
The range broke out to the upside at 01:16 UTC, supported by a golden crossover of MACD, and formed a converging triangle pattern. The converging triangle pattern broke out to the downside at 01:33 UTC, supported by a death crossover of MACD, and formed another range. That range marked the low for the day at $104,457. The range attempted to break to the upside at 02:04 UTC, supported by a golden crossover of MACD, but the breakout failed, and another range formed. The new range broke out to the upside at 02:25 UTC, supported by a golden crossover of MACD, and formed yet another range.
Supported by MACD’s death crossover, the range fell at 02:47 UTC and developed an upward trending channel. RSI rose over the 70 level at 02:40 UTC, suggesting oversold market circumstances. Backed by a MACD death crossover, the upward moving channel broke out to the downside at 03:36 UTC; however, the downside breakout failed, and Bitcoin trend ascended to the upside, creating a converging triangle pattern. The converging triangle pattern broke out to the upside at 04:42 UTC, supported by a golden crossover of MACD, and formed an upward-moving channel.
Failed Channel Breakout at 05:05 UTC Leads to Trend Reversal
The upward-moving channel attempted to break out to the upside at 05:05 UTC, but the breakout failed, and the BTC price dropped to the downside, forming a downward-moving channel. The downward-moving channel broke out to the downside at 05:58 UTC, supported by a death crossover of MACD, but the breakout failed. However, the downside momentum remained strong, and Bitcoin trend moved lower again, forming another downward moving channel. This second downward-moving channel broke out to the upside at 06:31 UTC, supported by a golden crossover of MACD, and developed into a range. The range broke out to the upside at 07:02 UTC, supported by a golden crossover of MACD.
$104,457 Support Tested as BTC Struggles to Hold Momentum
Despite attempts to push higher, the Bitcoin price failed to maintain upside strength after marking its high at $105,226. Multiple golden crossovers failed to establish momentum, and RSI readings above 70 warned of overbought conditions. The failure of key upward channel breakouts, especially at 05:05 UTC, signaled trend exhaustion. The low for the day at $104,457 held as temporary support, but repeated downside channel formations showed persistent selling pressure. If bullish momentum builds from the latest golden crossover at 07:02 UTC, BTC may retest $105,200. If not, another drop toward $104,000 or below could occur, reinforcing the short-term bearish bias.
Bitcoin Price Analysis of June 25, 2025
On June 25, 2025, Bitcoin price began its session with a series of range-bound breakouts. The early momentum picked up at 01:37 UTC following a golden MACD crossover, which led to a sharp spike and the session’s high at $106,791. However, the high coincided with RSI crossing above 70, signaling overbought conditions. Price action then shifted into a sequence of converging triangles and minor ranges, reflecting intraday indecision. By 03:37 UTC, bearish momentum pushed the Bitcoin price down to the session’s low of $106,000. The rest of the session remained volatile with several short-term breakout attempts. Currently, the BTC price is trading at $106,500.

Chart 23: BTC/USDT M1 Chart, Analysed by vallijat007, published on TradingView, June 25, 2025
Bitcoin price formed a range. It broke out to the downside at 01:19 UTC, supported by a death crossover of MACD, price moved back to the downside and formed a range. The range broke out to the upside at 01:37 UTC, supported by a golden crossover of MACD, price spiked to the upside, and formed another range. The range broke out to the upside at 02:08 UTC, supported by a golden crossover of MACD, Bitcoin trend spiked to the upside, marking the high for the day at $106,791. At 02:10 UTC, RSI moved above the level of 70, indicating overbought market conditions, suggesting a reversal or at least a pullback.
Converging Triangle Formation After Daily High
Price generated a descending converging triangle pattern after marking the high for the day. Supported by a death crossover of MACD, the converging triangle pattern broke to the upside at 02:35 UTC, but the upside breakout failed, and Bitcoin trend fell to the downside, creating yet another converging triangle pattern. Falling RSI below the 30 level at 03:02 UTC denotes oversold market circumstances, therefore pointing to a reversal or even just a pullback. Supported by a death crossover of MACD, the converging triangle pattern broke out to the downside at 03:28 UTC and created a small range.
Daily Low Established at $106,000 After Failed Reversal Attempt
The minor range broke out to the downside at 03:37 UTC, supported by a death crossover of MACD, and formed a downward-moving channel. The downward-moving channel tried to break out to the upside at 04:25 UTC, supported by a golden crossover of MACD, but the upside breakout failed, and the price dropped to the downside, marking the low for the day at $106,000. After marking the low, BTC price formed a range. The range broke out to the upside at 04:53 UTC, supported by a golden crossover of MACD, and formed a downward-moving converging triangle pattern.
The converging triangle pattern broke out to the upside at 05:27 UTC, supported by a golden crossover of MACD, and formed an upward-moving channel. At 05:43 UTC, RSI moved above the level of 70, indicating overbought market conditions. The upward-moving channel broke out to the downside at 05:53 UTC, supported by a crossover of MACD, and formed a range. The range broke out to the upside at 06:20 UTC, supported by a golden crossover of MACD, and formed another range. The range again broke out to the upside at 07:24 UTC, supported by a golden crossover of MACD, and another range followed.
$106,791 High Signals Resistance as Ranges Persist
Despite a strong start, Bitcoin’s rally to $106,791 was capped by overbought RSI conditions and subsequent failed breakouts. The Bitcoin price reversed sharply, establishing a low at $106,000 before recovering in a sequence of MACD-supported breakouts. However, no clear trend emerged as the market continued forming overlapping ranges. With RSI again reaching overbought territory near 05:43 UTC, upside momentum faces exhaustion. If the newest breakout persists, the price might try to retest $107,000. Otherwise, fresh selling pressure may drive BTC back towards $106,000 or below. Traders should be wary as the current structure of Bitcoin indicates consolidation with decreasing volatility.
Bitcoin Price Analysis of July 1, 2025
Bitcoin price on July 1, 2025, saw choppy and indecisive movement, with the high for the day marked at $107,540 during an early upward-moving channel. This move was accompanied by an overbought RSI and golden MACD crossover. The price later reversed and dropped, eventually establishing the day’s low at $106,740 within an expanding triangle pattern. Multiple RSI dips below 30 signaled oversold conditions throughout the session. Despite several technical setups, most breakouts failed to gain momentum, leaving the Bitcoin price in a tight consolidation range. Bitcoin traders faced a session filled with false starts and minimal directional follow-through.

Chart 24: BTC/USDT M1 Chart, Analysed by vallijat007, published on TradingView, July 1, 2025
The Bitcoin price formed a range. The range broke out to the upside at 00:07 UTC, supported by the golden crossover of MACD. Price spiked to the upside, but the breakout failed, and the price dropped to the downside. At 00:15 UTC, RSI moved above the level of 70, indicating an overbought market condition, suggesting a reversal or at least a pullback. The Bitcoin trend formed an upward-moving channel. The upward-moving channel marked the high for the day at 107,540 dollars. The upward-moving channel broke out to the downside at 01:26 UTC, supported by the death crossover of MACD.
Upside Breakout at 02:05 UTC Forms Triangle Pattern
Price spiked to the downside, and range followed. At 01:52 UTC, RSI dropped below the level of 30, indicating an oversold market condition, suggesting a reversal or at least a pullback. The range broke out to the upside at 02:05 UTC, supported by the golden crossover of MACD. The Bitcoin trend spiked to the upside and formed a converging triangle pattern. The converging triangle pattern broke out to the downside at 02:35 UTC, supported by the death crossover of MACD. Price spiked to the downside and formed a range. At 02:50 UTC, RSI dropped below the level of 30, indicating an oversold market condition, suggesting a reversal or at least a pullback.
Daily Low Established at $106,740 Within Triangle Pattern
The range broke out to the upside at 03:16 UTC, supported by the golden crossover of MACD. Price spiked to the upside, but the momentum was weak, and the BTC price formed another range. At 04:16 UTC, RSI dropped below the level of 30, indicating an oversold market condition suggesting reversal or at least a pullback. The range broke out to the downside at 04:43 UTC, supported by the death crossover of MACD. Price spiked to the downside and formed an expanding triangle pattern. At 05:12 UTC, RSI again dropped below the level of 30.
The expanding triangle pattern marked the low for the day at 106,740 dollars. The expanding triangle pattern broke out to the upside at 05:47 UTC, supported by the golden crossover of MACD, but the price failed to form a spike. Instead, the price again dropped to the downside and formed a support at the level of 106,750 dollars. Bitcoin price showed a trading range behavior where most of the breakouts failed to reach their target BTC price. Traders and investors should be cautious before placing a breakout trade, as Bitcoin is currently consolidating.
Conclusion—$106,740Support Holds Amid Reversal Signals
Bitcoin price behavior showed consolidation dominance, with failed breakouts on both sides. The low at $106,740 held as a key support, backed by repeated oversold RSI conditions. Although golden MACD crossovers indicated upside potential, upside breakouts lacked power and follow-through. Traders are urged to refrain from violent breakout trades until a clear move beyond existing range limits appears; the general attitude remains cautious. If support at $106,740 breaks, more negativity toward $106,000 is possible. Reclaiming and holding above $107,500 would, on the positive front, help to resurrect bullish momentum. For now, Bitcoin remains unstable in a sideways pattern.
Bitcoin Price Analysis of July 5, 2025
Repeat technical indicators and erratic intraday movement characterized Bitcoin price activity on July 5, 2025. Starting with a downward-moving channel marking the low at $107,756, the day turned to a bullish breakout that drove the price to the high of $108,420. Overbought and oversold zones alternated sharply for RSI signals, therefore causing repeated reversals. MACD crosses kept propelling short-lived bursts all session. Despite bullish and bearish attempts, no strong directional trend was sustained, with Bitcoin price action confined to choppy patterns like channels, ranges, and triangle formations driven by failed momentum and rapid reversals.

Chart 25: BTC/USDT M1 Chart, Analysed by vallijat007, published on TradingView, July 5, 2025
The Bitcoin price formed a downward-moving channel, marking the low for the day at $107,756. The downward-moving channel broke out to the upside at 02:37 UTC, supported by a golden crossover of MACD, and formed a converging triangle pattern. At 03:00 UTC, RSI was above the level of 70, indicating overbought market conditions, suggesting a reversal or at least a pullback. The converging triangle pattern broke out to the upside at 04:23 UTC, supported by a golden crossover of MACD; price spiked to the upside, marking the high for the day at $108,420.
Failed Breakdown at 05:32 UTC Initiates Bullish Channel
The price fell to the downside and created yet another downward-moving channel at 05:05 UTC after marking the high. RSI was simultaneously below 30, pointing to oversold market conditions and implying a reversal or at least a pullback. Supported by a golden crossover of MACD, the downward-moving channel broke out to the upside at 05:13 UTC and created a range. The range broke out to the downside at 05:32 UTC, supported by a death crossover of MACD, but the downside breakout failed, and the price formed an upward-moving channel.
The upward-moving channel broke out to the downside at 07:08 UTC, supported by a death crossover of MACD, and formed a range. At 07:15 UTC, RSI was below the level of 30, indicating oversold market conditions. The range broke out to the downside at 07:33 UTC, supported by a death crossover of MACD; price spiked to the downside and formed an upward-moving channel. The channel broke out to the downside at 08:20 UTC, supported by a death crossover of MACD, and a range developed.
The range broke out to the downside at 09:06 UTC, supported by MACD, but the downside momentum failed, and the price rose to the upside, forming another range. At 09:50 UTC, RSI was above the level of 70, indicating overbought market conditions. The range broke out to the upside at 10:30 UTC, supported by a golden crossover of MACD; price spiked to the upside and formed another upward-moving channel. The channel broke out to the downside at 11:54 UTC, supported by a death crossover of MACD.
Bitcoin Trades Between $107,756 and $108,420 as Momentum Fizzles in Tight Range:
Bitcoin price moved within a narrow $664 band, with both its high and low set early in the session, followed by erratic, range-bound action. MACD signals repeatedly failed to sustain trend direction, and RSI swung sharply between extremes, leading to false breakouts and pullbacks. The market saw a series of formations, downward and upward channels, triangle setups, and short ranges, each failing to push the price decisively. This lack of follow-through highlights a consolidating market where momentum quickly stalls. Traders should be wary of overcommitting to either direction until a clear breakout, ideally supported by volume and unambiguous RSI confirmation, materializes.
Bitcoin Price Analysis of July 8, 2025
Bitcoin price action on July 8, 2025, was driven by successive bullish breakouts from triangle patterns and upward channels, with frequent RSI swings indicating overbought and oversold zones. The session began with a converging triangle breakout from the day’s low at $107,750, leading to a wave of upward momentum supported by golden MACD crossovers. Price continued to build on gains, forming an expanding triangle and upward-moving channel before eventually peaking. RSI repeatedly entered overbought territory, signaling exhaustion. Despite temporary pullbacks, Bitcoin price ultimately surged, marking the high for the day at $108,900 during late-session momentum.

Chart 26: BTC/USDT M1 Chart, Analysed by vallijat007, published on TradingView, July 8, 2025
The Bitcoin price formed a converging triangle pattern, which marked the low for the day at $107,750. The converging triangle pattern broke out to the upside at 04:21 UTC, supported by a golden crossover of MACD. Price spiked to the upside, and a range developed. The range broke out to the upside at 04:59 UTC, supported by a golden crossover of MACD, but the momentum was weak, and the price formed another range. The second range again broke out to the upside at 05:21 UTC, supported by a golden crossover of MACD. Price spiked to the upside and formed an expanding triangle pattern.
Daily High Established at $108,900 After Final Upside Breakout
At 05:50 UTC, RSI moved above the level of 70, indicating overbought market conditions, suggesting a reversal or at least a pullback. The expanding triangle pattern broke out to the upside at 06:43 UTC, supported by a golden crossover of MACD. Price spiked to the upside and formed a converging triangle pattern. The converging triangle pattern broke out to the upside at 07:19 UTC, supported by a golden crossover of MACD. Price spiked to the upside and formed an upward-moving channel.
The upward-moving channel broke out to the downside at 08:13 UTC, supported by a death crossover of MACD. Bitcoin price spiked to the downside, and a range developed. The range broke out to the downside at 08:28 UTC, supported by a death crossover of the MACD. At 08:36 UTC, RSI dropped below the level of 30, indicating oversold market conditions, suggesting a reversal or at least a pullback.
Price formed a converging triangle pattern. The converging triangle pattern broke out to the downside at 09:51 UTC, supported by a death crossover of MACD, but the downside breakout failed, and the price rose to the upside. A range was developed. In the meantime, at 10:15 UTC, RSI was above the level of 70, indicating overbought market conditions, suggesting a reversal or at least a pullback. The range broke out to the upside at 10:34 UTC, supported by a golden crossover of MACD. Price spiked to the upside, marking the high for the day at $108,900.
Bitcoin Hits $108,900 but Faces Resistance After Overbought Surge
Bitcoin price maintained a bullish tone for most of the session, propelled by consistent golden MACD crossovers and multiple breakout structures. However, RSI readings above 70 during key moves revealed stretched momentum, often leading to temporary reversals or consolidation. Bitcoin climbed to finish close to its intraday high, even with a few negative corrections and one failed triangle breakout. A rapid ascent from the $107,750 bottom culminated in the ultimate breakout to $108,900. Traders should get ready for possible consolidation or a corrective pullback before the following directional move, given the RSI repeatedly flashing overbought signals. Bullish continuation would need a verified hold above $108,500.


