

As the flagship cryptocurrency, Bitcoin (BTC) sets the tone for the entire digital asset market. This technical analysis examines Bitcoin price action through institutional-grade frameworks, analyzing candle structures, logarithmic growth curves, and on-chain accumulation patterns. We focus on critical levels: moving average, Bitcoin’s realized price, and volatility compression zones preceding major breakouts. With ETF inflows and halving cycles now fundamentally reshaping BTC’s market structure. This breakdown provides traders with a disciplined approach to navigating Bitcoin’s volatility. While respecting its unique position as both a risk asset and an emerging store of value.
Bitcoin Price Analysis of August 19, 2025
On August 19, 2025, Bitcoin traded with sharp intraday swings, first forming a downward-moving channel that broke out to the upside at 02:40 IST, supported by a golden crossover of MACD, driving to the day’s high at $116,980. After hitting the peak, Bitcoin entered another downward channel, but an attempted upside breakout at 06:15 IST failed, leading to a range. The range broke down at 08:30 IST, supported by a death crossover of MACD, dropping to the day’s low at $114,366. Recovery followed, pushing Bitcoin into another upward-moving channel by late-session trading.
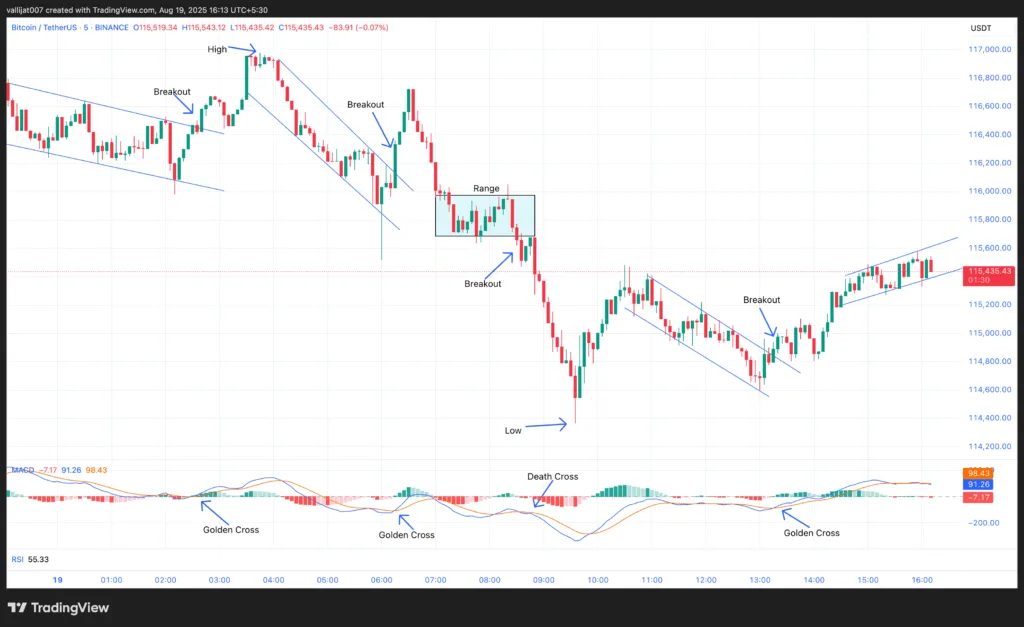
Chart 1: BTC/USDT M5 Chart, Analysed by Vallijat007, published on TradingView, August 19, 2025
- Bitcoin price formed a downward-moving channel, which broke out to the upside at 02:40 IST, supported by a golden crossover of MACD, with Bitcoin price spiking to the upside and marking the high for the day at $116,980.
- After marking the high, the price formed another downward-moving channel. The channel attempted to break out to the upside at 06:15 IST, supported by a golden crossover of MACD, but the breakout failed and the Bitcoin price moved back to the downside, forming a range.
- The range broke out to the downside at 08:30 IST, supported by a death crossover of MACD, with price spiking down and marking the low for the day at $114,366.
- After marking the low, the price rose to the upside and formed another downward-moving channel. The channel broke out to the upside at 01:20 IST, supported by a golden crossover of MACD, and an upward-moving channel developed.
- If this upward channel breaks to the upside, then the Bitcoin price may rise to the level of $118,000.
- If the channel breaks to the downside, then the Bitcoin price may mark another low and drop to the level of $114,000.
Bitcoin Steadies Above $115K Amid Geopolitical Shifts
The recent Trump-Zelenskyy meeting briefly pressured markets, sending Bitcoin near $115,000 before a swift recovery. Traders interpreted the diplomatic outcome as progress while also leaning on Bitcoin as a store of value during diplomatic turbulence. Although trading volumes rose slightly, and participation remained measured, this suggests cautious conviction among investors.
From a technical perspective, Bitcoin’s rebound was supported by oversold conditions and a retest of its pivot levels. Short-term momentum improved as RSI climbed from oversold zones, while the 200-day EMA continues serving as a long-horizon support. A decisive break above $116,200 may open room toward $119,600, while failure could renew pressure at $112,000.
Institutional flows remain a key driver. Japanese firm Lib Work revealed a new Bitcoin treasury allocation, reinforcing Asia’s corporate adoption trend. Similarly, U.S. spot ETFs recorded sizable inflows, signaling persistent institutional appetite. The coming Jackson Hole Symposium will likely determine Bitcoin’s next decisive move.
Bitcoin Balances Macro Pressure and Technical Support:
Bitcoin’s current stability around $115,400 reflects its dual nature as both a speculative vehicle and a hedge amid geopolitical uncertainty. The Trump–Zelenskyy meeting initially weighed on sentiment, but a swift recovery showed resilience. Technically, the recovery in RSI and support of the 200-day EMA cushions, but traders should watch out for $116,200 as a potential near-term break. Underlying demand is supported by institutional flows such as Japanese treasury allocations and U.S. ETF inflows. There are, however, downside risks in case of failure of the support at a level of $114,000. Following the Jackson Hole Symposium on August 27, much attention is focused on understanding which way Bitcoin is headed—unlocking a catalyst toward $119,600, or becoming vulnerable to new selling pressure.
Bitcoin Price Analysis of July 22, 2025
Bitcoin price action on July 22, 2025, showed typical range-bound behavior with weak initial momentum. A downside breakout at 00:15 IST failed to sustain, leading to a minor recovery and another range. The session low was marked at $116,128 after a sharp drop at 06:10 IST. From there, the price rebounded, forming a downward-moving channel, which broke to the upside by 11:20 IST. Bitcoin later formed a converging triangle and spiked upward, hitting the daily high of $119,110 at 16:30 IST. Overbought RSI levels flagged potential reversals throughout the day, reflecting a market poised between consolidation and bullish breakout attempts.
Initial Breakdown Establishes Daily Low at $116,128
The Bitcoin price formed a range. The range broke out to the downside at 00:15 IST. The price spiked to the downside, but the momentum was weak, and the price formed another range. The range broke out to the upside at 03:05 IST, the price spiked to the upside, and another range developed.
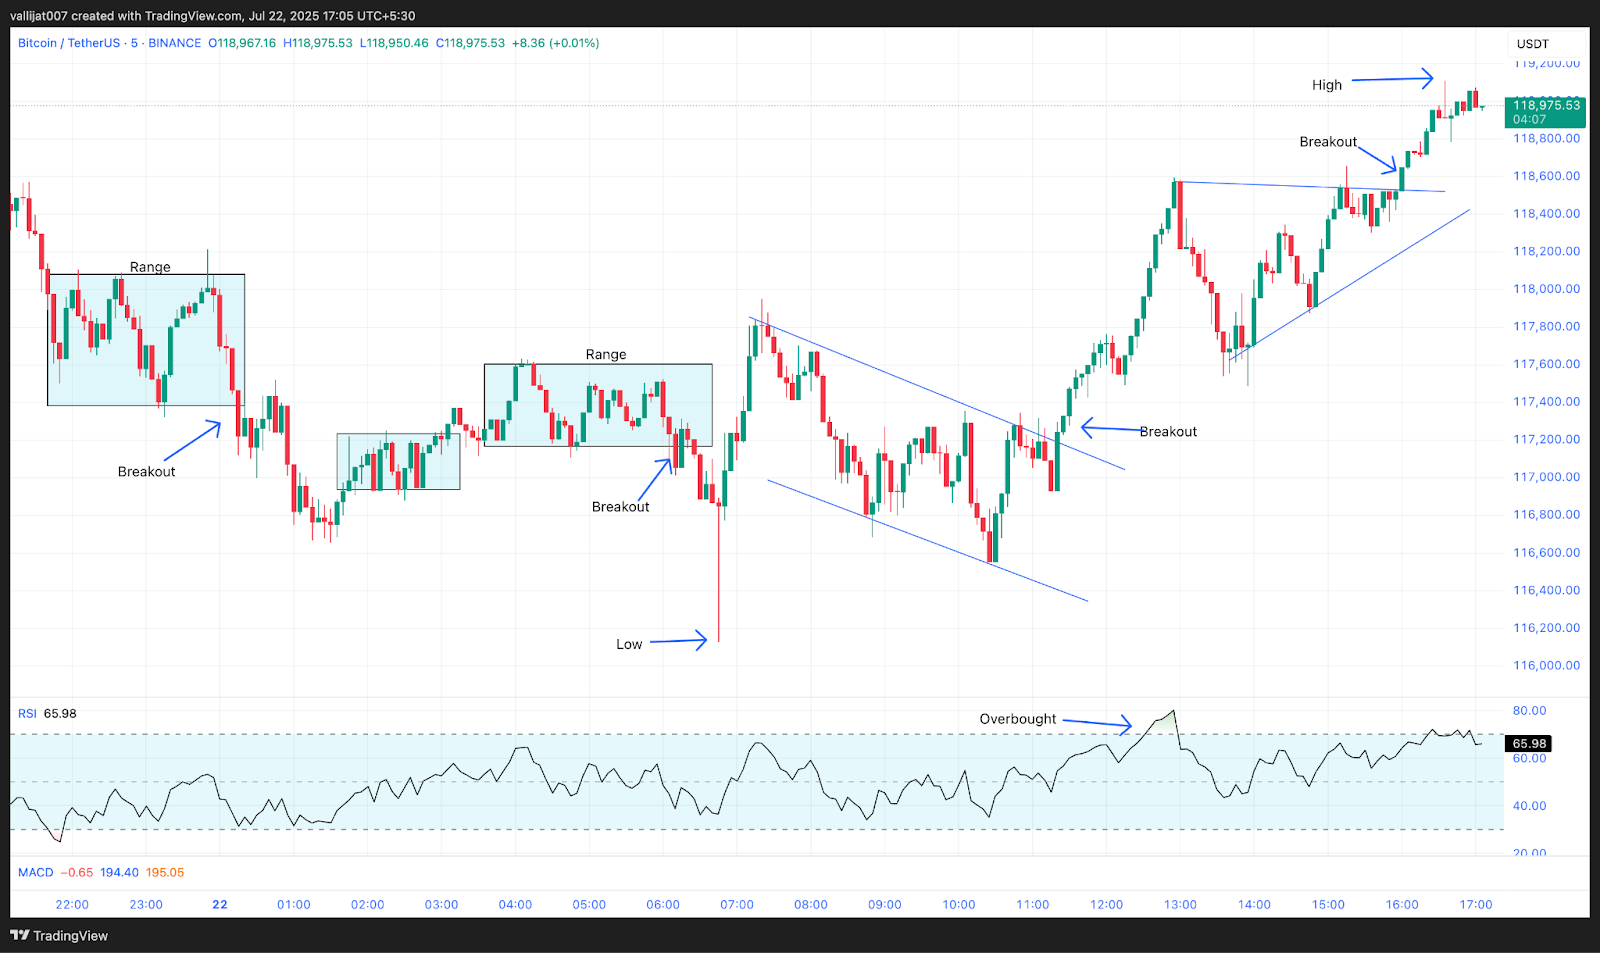
Chart 1: BTC/USDT M5 Chart, Analysed by Vallijat007, published on TradingView, July 22, 2025
- The range broke out to the downside at 06:10 IST, and the price spiked to the downside, marking the low for the day at $116,128. After marking the low, the price rose to the upside and formed a moving channel.
- The downward-moving channel broke out to the upside at 11:20 IST. The price spiked to the upside and formed a converging triangle pattern at 12:40 IST.
- RSI was above the level of 70, indicating an overbought market condition, suggesting a reversal or at least a pullback. The converging triangle pattern broke out to the upside at 16:00 IST.
- The price spiked to the upside and marked the high for the day at $119,110 at 16:30 IST. RSI was again above the level of 70, indicating an overbought market condition, suggesting a reversal or at least a pullback.
- The Bitcoin price is in a trading range behavior. If the breakout succeeds, then the price may rise to the level of $120,000. If the breakout fails, then the price may drop to the level of $115,000.
Bitcoin (BTC) Solidifies Institutional Dominance Despite Short-Term Pullback
Bitcoin has been enhancing itself as an institutional juggernaut, and BlackRock has been spearheading the effort of bringing Bitcoin to the mainstream with its Bitcoin ETF. The fact that BTC is gaining credibility as an asset of an investment grade is confirmed by 12 days of ETF inflows of 6.6 billion, a sign of strong institutional demand.
The amount of coin held by MicroStrategy, which is currently 597,325 BTC, strengthens the attractiveness of BTC as a corporate treasury, and the fact that U.S. spot Bitcoin ETFs hold a total of $54.75 billion (6.5% of BTC market cap) demonstrates institutional dedication, which runs deep.
Although the trading volume fell by a slight -0.97 percent to $118,100, the trading volume increased significantly by +14.14 percent to 74.14 billion dollars, indicating active accumulation. This short-term consolidation is after a good rally and could be a buying signal before the next upward push.
Bitcoin’s Institutional Momentum Builds as Short-Term Volatility Offers Opportunity
Although the Bitcoin price took a slight dive to the price of 118,100, the basis on which it is being traded is still strong. The ETF engineered by BlackRock has pushed through 12 consecutive days of inflows amounting to $6.6 billion, and this represents a solid institutional interest. Microstrategy, having close to 600,000 BTC in its possession and the locked-up value of $54.75 billion held in U.S. spot ETFs, highlights the use of BTC as a corporate reserve asset.


