
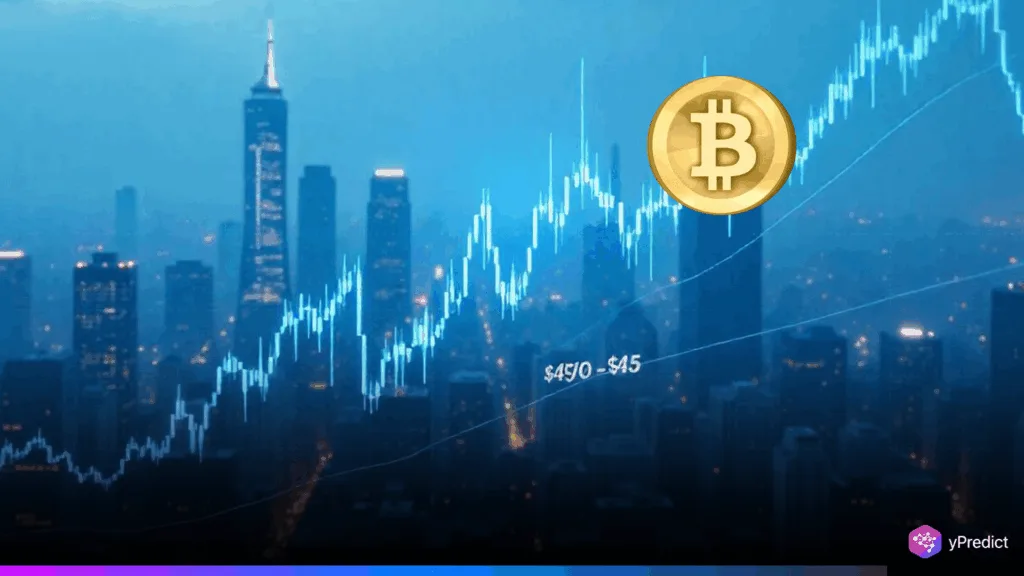
If you want to invest in or buy the Bitcoin SV token and wonder what the right price to start accumulating Bitcoin SV is, then you are in the right place. As we go through the analysis, we will determine different patterns and how Bitcoin SV reacts to them. We will also see support and resistance, which is a good area for any instrument to buy or sell. Without any further delay, let’s dive into Bitcoin SV Price analysis and explore different opportunities arising from it.
Bitcoin SV (BSV) Price Analysis of May 11, 2025
Bitcoin SV has experienced a session dominated by sharp yet inconsistent Bitcoin SV price movements, shaped by technical signals and market hesitation. The day began with a downside BSV breakout from a converging triangle, followed by oversold RSI conditions that hinted at a potential rebound. A temporary rally emerged, but bullish momentum quickly faded, leading to renewed selling pressure. Throughout the session, Bitcoin SV has remained largely range-bound, with prices oscillating between support and resistance levels. Both MACD and RSI have provided timely signals, but the lack of strong follow-through has made directional plays challenging. This behavior reflects broader indecision across the market.

Chart 1: BSV/USDT M5 Chart, Analysed by vallijat007, published on TradingView, May 11, 2025
A converging triangle occurred in Bitcoin SV and had a downside breakout at 10:55 UTC, supported by a death crossover in the MACD. The fall later, when prices dropped after BSV broke out, dropped prices to $41.20. The RSI in a few minutes was under 30 at 11:40 UTC, which indicated the market was oversold and the possibility of an upside or short-term rebound. Later, a consolidation range was established by the Bitcoin SV price. Finally, the range exploded higher at the level of 20:30 UTC following a golden crossover of the MACD. After that, its value soared upwards to the session’s peak of $44.62 for Bitcoin SV. Sigh, the speed was over soon.
Death Cross Triggers Sell-Off: New Daily Low at $41.09
A new range was developed shortly after the BSV price peaked. This range broke out to the downside at 05:50 UTC, backed by a death crossover of the MACD. The bearish breakout led to a renewed sell-off, and the price dropped again. This time marking the low for the day at $41.09. Currently, Bitcoin SV is showing clear trading range behaviour. Most of the breakouts, whether upward or downward, have lacked follow-through. And have been followed by reversals, reflecting the broader market’s indecision. RSI has fluctuated between overbought and oversold conditions throughout the session, further emphasising the lack of a clear directional trend.
In the event further pricing declines from its current point, $40.00 is the upcoming key support level, a pre-existing and formidable barrier. However, should a bullish attitude develop and a turn upwards occur, Bitcoin SV may return to the $45.00 area, which was previously attained and is now providing support.
Now, the Bitcoin SV price is moving within a narrow range, in which there are many false attempts to break out. Caution for traders is recommended before opening new trades with clear confirmations in place. Technical devices such as MACD and RSI continue to provide vital information about fluctuations in momentum as well as new developments in support or resistance levels. Anything beyond $45 sustained or under $40 is likely to be the beginning of the next major Bitcoin SV trend.
Bitcoin SV Awaits Directional Clarity
The Bitcoin SV price keeps trading inside a clearly demarcated range, with most breakouts missing confidence and swiftly reversing. This back-and-forth movement stresses the general market volatility and the need for verification before starting transactions. While no obvious trend has developed, RSI swings and MACD crossovers have defined short-term momentum changes. The BSV price will probably stay stuck inside its present range until a breakout or breakdown takes on volume and power. Traders should exercise prudence, concentrating on powerful momentum indications and eschewing overreaction to slight fluctuations. The next steady directional trend will probably be decided by a decisive break beyond significant points.
Bitcoin SV (BSV) Price Analysis of May 18, 2025
Bitcoin SV’s price action during the session has been largely range-bound, with repeated breakout attempts from downward channels failing to produce sustainable momentum. While early golden MACD crossovers triggered multiple upside moves, each was followed by the formation of new downward patterns, pointing to inconsistent trend direction. Despite a few strong spikes, particularly after breaking resistance, the Bitcoin SV price often reversed quickly, reflecting market indecision. Overbought RSI readings and shallow follow-through highlighted weak buying pressure. The overall structure suggests choppy movement within well-defined support and resistance zones, with neither bulls nor bears gaining lasting control.
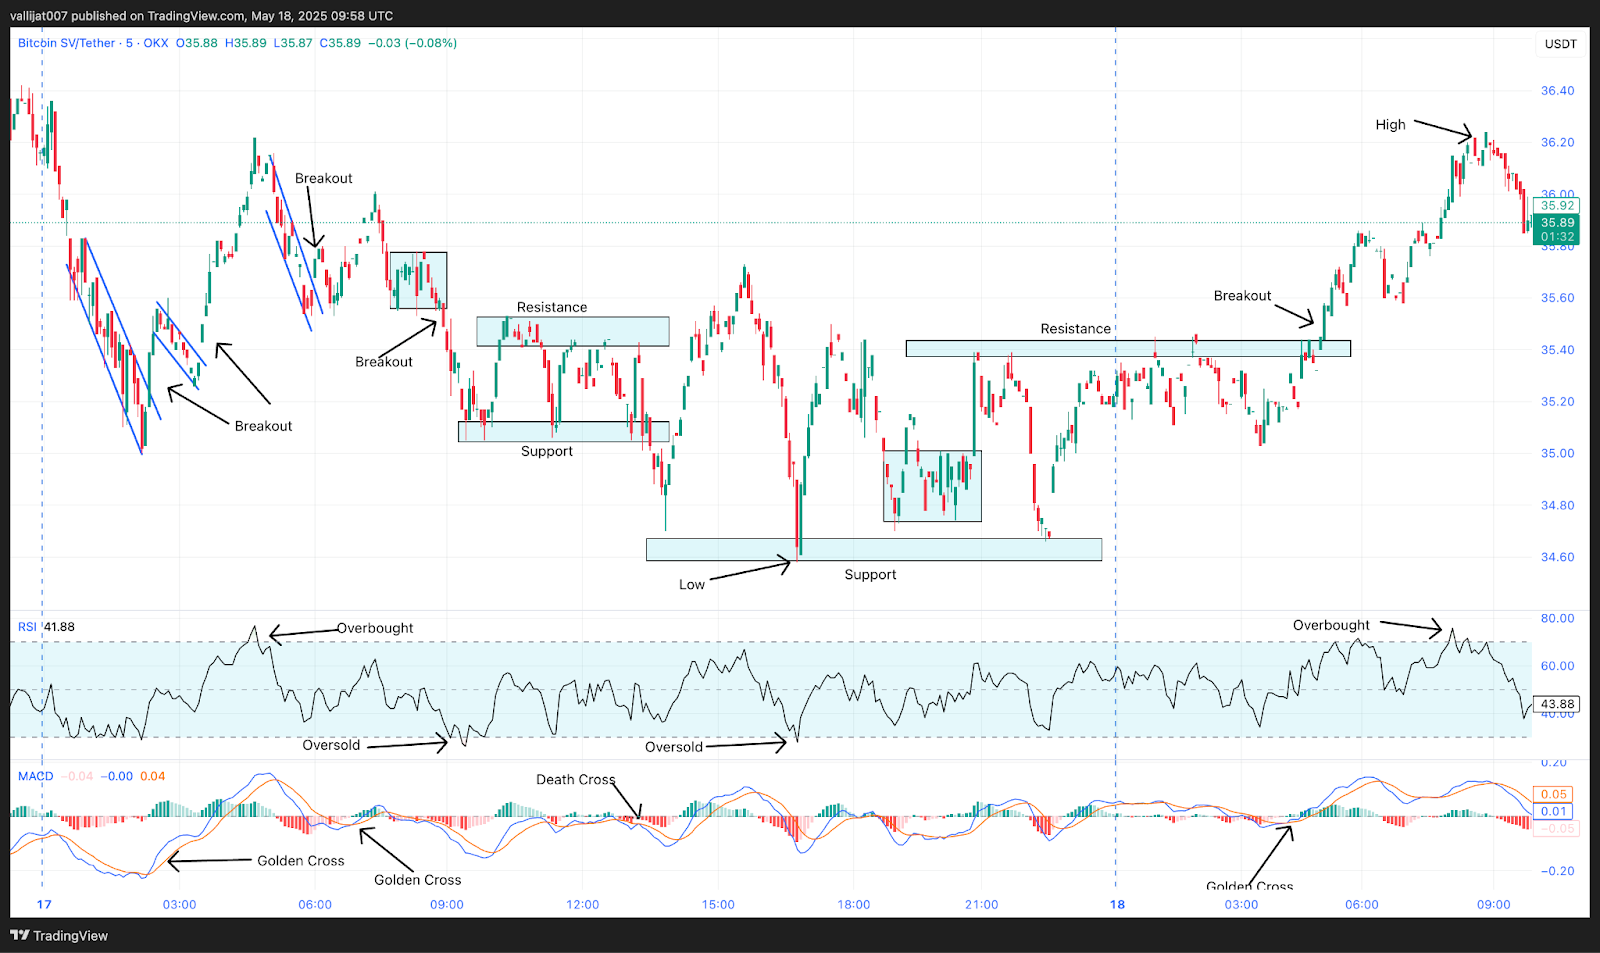
Chart 2: BSV/USDT M5 Chart, Analysed by vallijat007, published on TradingView, May 18, 2025
A downward-moving channel appeared in the Bitcoin SV price, which broke out to the upside at 02:20 UTC, supported by a golden crossover of MACD. Price spiked to the upside and formed a downward-moving channel. This second downward-moving channel again broke out to the upside at 03:30 UTC, supported by a golden crossover of MACD. The Bitcoin SV price spiked to the upside and formed another downward-moving channel.
Overbought RSI at 70: Can Bulls Sustain the Rally Above $36?
In the meantime, at 04:40 UTC, RSI moved above the level of 70, indicating an overbought market condition, suggesting a reversal or at least a pullback. This third downward-moving channel again broke out to the upside at 06:00 UTC, supported by a golden crossover of MACD, but the price failed to form another high. Instead, a range appeared in the BSV price. The range broke out to the downside at 08:55 UTC, supported by a crossover of MACD. Price dropped to the downside and formed a BSV support area at the level of $35.05 and a resistance area at $35.50.
This range broke out to the downside at 13:35 UTC, supported by a death crossover of MACD, but failed to form a trend. Instead, the BSV price reversed to the upside. Price again dropped to the level of $34.58, which marked the low for the day and created a BSV support area at the level of $34.60. Price formed a resistance area at the level of $35.40. The resistance broke out to the upside at 05:05 UTC on 18th May 2025, supported by a golden crossover of MACD.
Price spiked to the upside, marking the high for the day at $36.24. In the meantime, at 08:00 UTC, RSI moved above the level of 70, indicating an overbought market condition, suggesting a reversal or at least a pullback. The price shows a trading range behavior, which suggests that most of the breakouts failed to achieve their target price. As the world markets are currently offline, Bitcoin SV may further consolidate. A strong trend could only be seen above the level of $38 or below the level of $34. Until then, the Bitcoin SV price may further consolidate its position.
Bitcoin SV Awaits Breakout Beyond Key Levels
The Bitcoin SV price continues to consolidate, trading within a tight range defined by repeated breakout failures and limited follow-through. The price has oscillated between support and resistance, with MACD signals frequently triggering moves that lack trend continuation. Overbought RSI conditions and weekend market inactivity have further subdued volatility. Until the price decisively breaks above $38 or below $34 with strong momentum, a clear trend is unlikely to emerge. For now, traders should be cautious of false breakouts and prioritize range-trading strategies. A breakout beyond these key levels will be required to shift Bitcoin SV out of its current consolidation phase.


