

Bitget is preparing to take legal action against eight accounts accused of manipulating its VOXEL market, allegedly pocketing $20 million through abnormal trading activity. The incident unfolded on April 20, when VOXEL, a relatively unknown token, suddenly surged over 500% in price, raising red flags across the platform. Bitget responded by freezing suspicious trades and launching an investigation, promising to return all recovered funds to users via an airdrop. While a full report is still pending, Bitget’s swift move underscores the growing wave of security breaches shaking the crypto world in recent weeks.
The fallout from the VOXEL incident seems to have spilled over into the BGB token’s(BGB) price action, adding a layer of caution to trader sentiment. As questions around platform security linger, BGB’s movements turned choppier, reflecting a market feeling out its next steps. Let’s dive into the latest BGB price structure and see how the technicals are shaping up amid this backdrop.
Bitget (BGB) Price Analysis of 28th April, 2025
The BGB price action on a 5-minute chart from April 27th opened with a clear bearish sentiment, as sellers steadily pushed the coin into a mild downtrend channel. Prices weakened to $4.40 by around 01:55 UTC, reflecting persistent overhead pressure. During the 00:00 to 03:00 UTC window, Bitget token attempted minor recoveries but stayed capped within a tight trading range between $4.38 and $4.41, showing weakening momentum. The RSI oscillated close to neutral with brief dips into oversold zones. At the same time, MACD signals indicated low bullish strength despite intermittent golden crosses, suggesting a fragile sentiment underpinned by modest buy attempts.

Chart 1, Analyzed by Alokkp0608, published on April 28th, 2025.
From 03:00 to 06:00 UTC, BGB price maintained its range-bound behavior until a sudden sharp drop to $4.34 around 10:35 UTC triggered a volatility spike. Although the drop was severe, the coin quickly recovered by 11:00 UTC, snapping back above $4.38. The RSI moved sharply from oversold to mid-50s territory, while MACD lines briefly tightened, hinting at the spike’s reactionary momentum rather than BGB market trend reversing. Notably, Bitget token failed to sustain gains beyond the $4.41-$4.42 resistance area, reinforcing the sellers’ control during this interval.
Between 06:00 and 18:00 UTC, the BGB price hovered under its resistance level, consolidating into a range with frequent false breakouts. Despite minor bullish attempts, RSI readings remained suppressed below the overbought line, and MACD momentum waned, setting up for a larger move. As April 28th began, BGB plunged sharply into a steep descending channel, breaching the key support zone at $4.30 and touching lows around $4.25. The 18:00–03:00 UTC window witnessed continuous RSI oversold signals, and a death cross in MACD during this period confirmed the sellers’ dominance.
Bitget Token Price Outlook: What Lies Ahead for BGB?
From 03:00 to 06:00 UTC on April 28th, the BGB price recovered from the oversold zone. Following testing of $4.25, prices rebounded and were back above the $4.30 support level by approximately 03:20 UTC. While prices were recovering, momentum indicators were also changing. The MACD signaled a golden cross, and the RSI is now back above 50, suggesting short-term reversal signals were in play. Nonetheless, the broader structure remains unstable with the price still struggling to break convincingly above $4.32. BGB must sustain momentum above $4.32 to target $4.38-$4.41 again, or a retest of the $4.28-$4.25 support zone could unfold soon.
BGB Attempts a Recovery, but Caution Still Dominates
Bitget token is trying to find footing after reclaiming the $4.30 support level, but the price action still looks hesitant. Bulls need to clear the $4.32–$4.38 resistance zone with conviction to spark a more decisive move higher. Right now, RSI is hovering just above 50, and a fresh MACD golden cross suggests momentum is turning, but not decisively. If buyers fail to step up soon, another slip back toward $4.28 or even $4.25 could unfold. Adding to the uncertainty, Bitget’s ongoing fallout from the VOXEL incident keeps sentiment fragile across the platform. For now, BGB shows some early promise, but without a strong push above $4.38, the broader BGB market trend remains vulnerable to more downside pressure.
BGB Price Analysis of April 30th, 2025
The BGB price action on a 5-minute chart on April 29, 2025, exhibits early consolidation followed by a sharp directional shift. Between 00:00 UTC and 12:45 UTC, the Bitget token oscillated in a narrow sideways channel, bounded between $4.44 resistance and $4.40 support. Despite a bullish undertone carried over from the previous day, attempts to break above $4.44 failed repeatedly. RSI touched overbought territory briefly during early morning surges but fell back under 60, reflecting waning momentum. MACD formed back-to-back death crosses near 06:00 and 09:30 UTC, undermining bullish conviction and foreshadowing the eventual downside move later in the session.
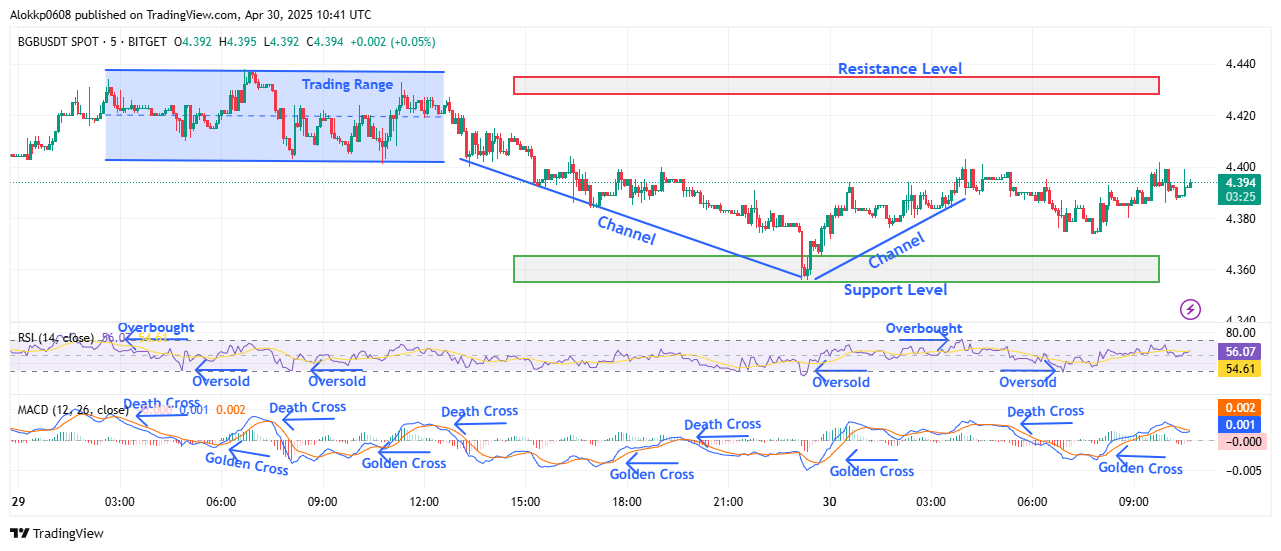
Chart 2, Analyzed by Alokkp0608, published on April 30th, 2025.
By 13:00 UTC, BGB price slipped into a descending pattern, breaking out of the previous consolidation zone and initiating a bearish channel. From 13:00 UTC to around 23:10 UTC, the price trended lower from $4.40 to a session low near $4.366, marking a breakdown of previous intraday support. RSI dipped multiple times below 30, highlighting repeated oversold stretches and suggesting buyer hesitation. Meanwhile, MACD showed limited momentum recovery, crossing bearishly around 15:30 UTC and again at 21:00 UTC. The repeated inability to sustain rebounds pointed to mounting sell pressure. This bearish bias remained until the price approached the defined support region around $4.366.
Bullish Reversal Attempts Gain Ground as Indicators Improve
Between 23:20 UTC and 03:00 UTC on April 30, BGB price reversed direction and began carving out a bullish recovery. A rebound from the $4.366 support kicked off a gradual uptrend, with price steadily climbing within a rising channel. This reversal was reinforced by a golden cross on the MACD near 23:30 UTC, followed by another just before 03:00 UTC. RSI recovered from oversold levels, rising above 50 for the first time since midday April 29, indicating momentum was shifting in favor of buyers. The consistently higher lows and higher highs through this stretch marked an apparent structure change from the earlier bearish leg.
The BGB recovery extended between 03:00 UTC and 06:00 UTC as the price touched an intraday high of $4.40, retesting the lower boundary of the earlier trading range. However, the BGB breakout lacked strength, and the price failed to hold above $4.40. RSI briefly touched overbought territory near 70 before retreating to mid-50s, while MACD momentum showed early signs of divergence, with the histogram flattening despite a golden cross setup. This combination hinted at temporary exhaustion. The resistance near $4.40 again proved sticky, with selling pressure increasing on each push upward.
Bitget Token Price Outlook – What’s Next for BGB?
After 06:00 UTC, Bitget token entered another sideways consolidation phase, between $4.38 and $4.40. While the overall structure remained above the recovery trendline, momentum slowed. RSI ranged between 50 and 60, showing indecision and lacking directional strength. MACD flipped bearishly around 07:45 UTC but quickly attempted a bullish crossover again by 09:00 UTC. This choppy momentum behavior reflects market uncertainty. Although no clear breakdown occurred, the price showed reluctance to retest the $4.44 resistance seen during the previous day’s highs, indicating potential for a pause or deeper pullback ahead.
BGB Recovery at Crossroads
The BGB price remains vulnerable beneath the $4.40 ceiling, where repeated resistance has capped bullish rallies. Momentum indicators are mixed, RSI is hovering around 55, suggesting modest strength but not conviction. MACD’s golden cross near the chart’s end is yet to show real momentum acceleration, hinting at a fragile uptrend. Bulls remain in the game as long as price holds above $4.366, but a failure to breach $4.44 could trap price in a tighter range. A confirmed move above $4.44 opens $4.47 next, while a breakdown below $4.366 exposes $4.34. Momentum is cautiously bullish but lacks force for a breakout unless supported by volume and follow-through.
Bitget Token (BGB) Price Analysis of May 27, 2025
The Bitget token price action today shows an initial lack of momentum above $5.305. From 00:00 to around 01:03 UTC, the price hovered within a tight range between $5.305 and $5.325, with several failed attempts to break higher. A decisive bearish shift occurred at 01:03 UTC when the price broke below $5.305, triggering a selloff that led to a sharp drop toward $5.233 by 01:44 UTC. This decline formed a clear downtrend channel with lower highs (LH) and lower lows (LL). The MACD flashed a death cross at 00:36 UTC, while RSI entered oversold territory during the fall.
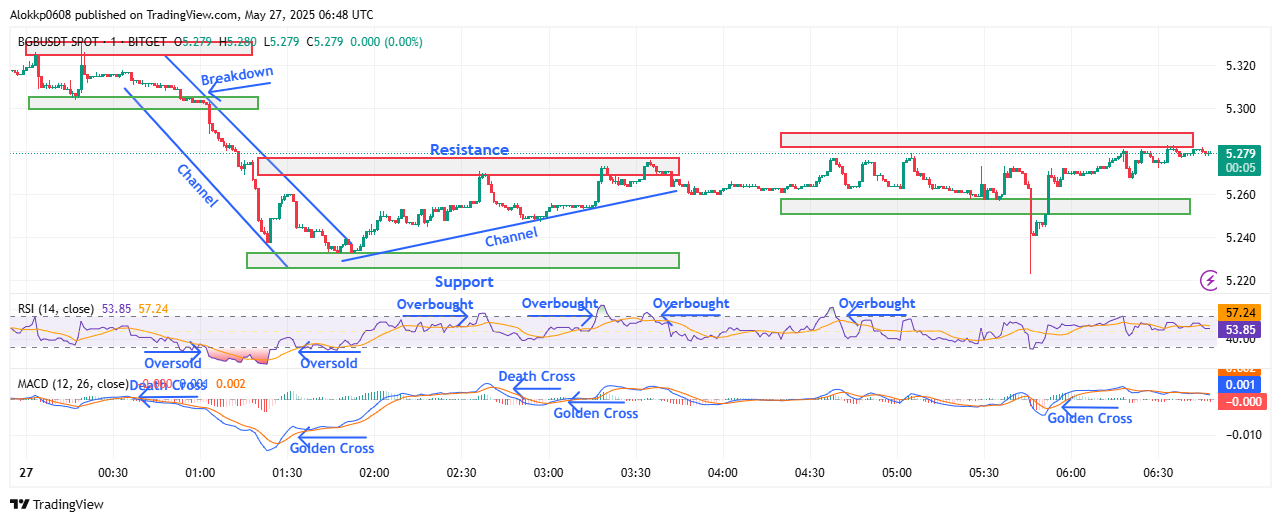
BGB/USDT M-1 Chart, Analyzed by Alokkp0608, published on May 27th, 2025.
Following the 01:44 UTC low, the BGB price entered a bullish recovery phase. From 01:45 UTC to 03:35 UTC, the price moved inside a clear uptrend channel, marked by higher lows (HL) and higher highs (HH). The bounce lifted the price from $5.233 to the resistance zone near $5.275. A MACD golden cross at 01:27 UTC, followed by another cross at 03:00 UTC, confirmed the shift in intraday momentum. RSI climbed sharply, even touching the overbought zone between 02:00 and 03:15 UTC. Buyers dominated this segment, but the advance paused once the price neared the $5.275–$5.285 resistance band.
Buyers Lose Steam Below Resistance
Between 03:35 UTC and 05:00 UTC, the bullish pace stalled as the BGB price moved sideways beneath the $5.285 ceiling. Several attempts to break higher failed, with price consistently rejected below $5.280. Each push formed lower highs, showing a drop in buyer strength. RSI, which was previously elevated, started to cool off and hovered between 52 and 60. The MACD histogram flattened, and signal lines showed no new crossovers, suggesting indecision. The market entered a brief sideways channel (SC) between $5.258 and $5.275, with short wicks in both directions but no clear breakout attempt.
From 05:00 UTC to around 06:30 UTC, the BGB price action became more volatile, with a fast drop to $5.244 at 05:05 UTC, immediately met by a sharp recovery. Buyers stepped in to defend that zone, and BGB rebounded back to the $5.270 level. A MACD golden cross at 05:52 UTC hinted at a renewed bullish effort, but momentum was weak. RSI stabilized between 53 and 57. This brief shakeout reinforced two key levels: $5.244–$5.258 as a growing support band, and $5.285 as firm resistance. Price coiled tightly again just beneath this ceiling, setting up for a possible squeeze.
Bitget Token Tight Coil Near Resistance Signals Imminent Move
In the final stretch of the chart, BGB remained tightly compressed just under the $5.285 level. Price fluctuated in a narrow range between $5.270 and $5.279, unable to break higher but firmly rejecting any dips. Volume remained stable but lower than during the recovery earlier. A short-term bullish flag began forming, but confirmation is still pending. MACD stayed in bullish alignment, while RSI hovered near 57, suggesting moderate upside pressure. This final segment shows consolidation with a bullish bias, but without a clean breakout yet. All eyes now turn to whether bulls can flip $5.285 into support for the next leg up.
Bullish Pressure Builds but $5.285 Remains a Wall
As of 06:45 UTC, Bitget token is trading at $5.279, compressing just below a critical resistance zone. Momentum leans cautiously bullish, supported by higher lows and a recent MACD golden cross at 05:52 UTC. RSI is steady near 57, giving room for upward movement. However, buyers must clear $5.285 to unlock the next rally toward $5.305–$5.325. If rejected, price could retest $5.258, with deeper support at $5.244. The market is now tightly wound, and any breakout above $5.285 could trigger rapid upside. For now, the bias favors buyers, but conviction needs a strong push through resistance.
Bitget (BGB) Price Analysis of June 13th, 2025
The BGB price action today shows a volatile session dominated by early selling pressure, followed by steady recovery. Prices opened within a tight consolidation range near $4.545 but broke down quickly after testing the resistance area. The fall continued aggressively through $4.475 support, reaching a low near $4.445 by 01:42 UTC. This marked a clear lower low (LL), supported by RSI dipping into the oversold zone and MACD’s earlier golden cross at 00:59 UTC failing to generate sustainable momentum. The death cross at 03:58 UTC confirmed waning bullish strength before any meaningful reversal attempt began to take shape.
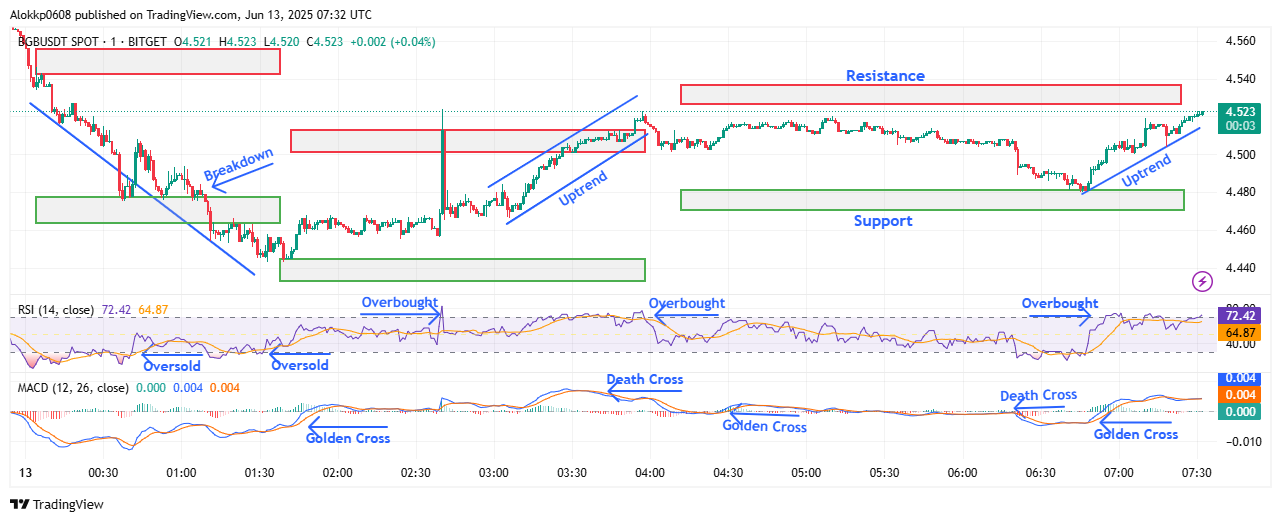
BGB/USDT M-1 Chart, Analyzed by Alokkp0608, published on June 13th, 2025.
From 01:45 UTC to 03:00 UTC, BGB prices hovered around the $4.445 support zone, with several failed attempts to rally past the $4.475 mark. A sudden breakout around 02:39 UTC pushed BGB up to $4.525, printing a higher high (HH) in the short-term microstructure. However, this spike lacked follow-through and was quickly sold off, showing the presence of sellers around the $4.515–$4.525 resistance zone. RSI moved from oversold to overbought, flagging the overextension, while MACD showed recovery but not a strong crossover signal. Price entered a shallow uptrend channel heading into 04:00 UTC.
Bitget Prices Uptrend Fizzles into Sideways Drift
Between 03:00 UTC and 04:45 UTC, Bitget token shifted into a narrow upward channel, carving out higher lows (HLs) and higher highs until stalling again at the $4.523 level. The MACD printed a brief golden cross at 04:23 UTC but was followed by a death cross at 06:19 UTC, highlighting indecision. RSI flashed overbought conditions again at multiple points but lacked follow-up bullish continuation. Price flattened into a sideways structure between $4.480 and $4.525, rejecting multiple breakout and breakdown attempts. This marked the onset of a low-volatility consolidation phase, with no clear trend until after 06:20 UTC.
From 04:45 UTC to 06:20 UTC, BGB price consolidated tightly between the $4.480 support zone and the $4.525 ceiling. The market formed a cluster of equal highs near resistance without breaking through, implying distribution by short-term traders. Meanwhile, MACD momentum faded, and RSI held mid-range levels, rarely dipping below 45 or above 65, confirming the sideways drift. The market respected the defined support at $4.480 multiple times, preventing deeper drops, but also failed to break past the known RLs. This created a temporary equilibrium zone awaiting a volatility breakout.
BGB Recovery Push After Support Rebound
Between 06:20 UTC and the end of the chart at 07:32 UTC, BGB found solid footing at the $4.480 level and initiated a fresh upward push. The price rebounded from the base and moved in a new uptrend, forming clean higher lows and breaching short-term intraday resistance again at $4.515. RSI moved firmly into overbought territory, signaling renewed buying strength. MACD aligned with a golden cross at 06:48 UTC, adding to bullish sentiment. The structure indicated growing momentum favoring buyers, with the price testing near the upper edge of the established $4.525 resistance zone by the session’s end.
BGB Price Reclaims Momentum But Faces Familiar Ceiling at $4.525
Bitget token looks bullish in the short term, having rebounded off support at $4.480 and reclaiming an uptrend by 07:32 UTC. Price momentum has clearly shifted upward, supported by a fresh MACD golden cross and RSI pushing above 70. However, upside remains capped for now by the repeated rejection at the $4.525 resistance level. Current support levels to monitor are $4.480 and $4.445, while resistance zones remain $4.515 and $4.545. If the momentum holds, BGB could attempt a clean breakout above $4.525, but fading volume or RSI reversal may cause another pullback.


