

One of the most renowned Solana-based meme tokens, BONK, also gained a lot of popularity due to its violent rallies and crashes. By trading with the steadfast USDT, its price action is volatile, and therefore, technical analysis (TA) plays a very important role in availing opportunities that traders can seize. In this analysis, the main charts, indicators, and price patterns of the BONK price are considered, as well as the search for the support/resistance levels, the trend, and the momentum indicators of the strong side. However, it is not always true that a current performance correlates with a future one, but these technical dynamics can assist a market participant to gauge the inherent risk and make better premeditated short- to medium-term trading decisions in this volatile commodity.
BONK Price Analysis of August 30, 2025
August 30, 2025, saw BONK price action characterized by high volatility and well-defined support and resistance levels. It opened at a low of $0.00001969, then fell drastically, then leveled off around a support zone of about $0.00002110. The breakout attempt at 06.10 IST failed to break support, so buyers remained, as did a downside breakout attempt. This was followed by an upward movement, and BONK rose to the high point in the day at $0.00002331, indicating a resistance at the level of $0.00002320. The rally lost its charge with price entering a downward channel, which converged into smaller ranges. Breakout confirmation in relation to these critical levels is now monitored by traders.
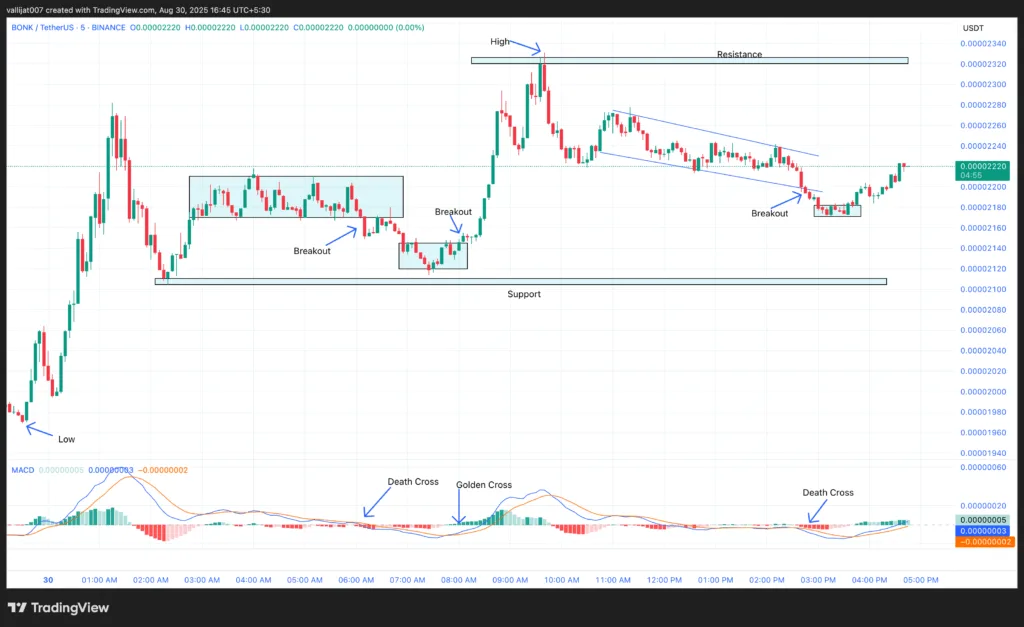
Chart 1: BONK/USDT M5 Chart, Analysed by vallijat007, published on TradingView, August 30, 2025
- BONK price marked the low for the day at $0.00001969. After marking the low, the price spiked to the upside and again dropped to the level of $0.00002110, creating a support zone around this price and forming a range above the support area.
- The range broke out to the downside at 06:10 IST, supported by a death crossover of MACD. Price spiked to the downside but was unable to break the support area, creating another small range.
- The range again broke out to the upside at 08:05 IST, supported by a golden crossover of MACD. BONK price spiked to the upside, marking the high for the day at $0.00002331, and created a resistance area at the level of $0.00002320.
- After marking the high, the price formed a downward-moving channel. The channel broke out to the downside at 02:45 IST, supported by a death crossover of MACD. Price spiked to the downside, but the momentum was weak, and a minor range was formed.
- The minor range broke out to the upside at 03:45 IST, supported by a golden crossover of MACD. If the breakout succeeds, then the BONK price may break the resistance area. If the breakout fails, then the BONK price may test or drop below the support area.
BONK Token Surges on Institutional Backing & Burns
The strategic $25 million BONK investment by Safety Shot and MemeStrategy of Everything Blockchain is yielding increasing institutional interest in the Solana-based memecoin. This diversification of treasury operations causes a tightening of the circulation supply and mainstream investor focus, other than retail speculation.
The next 1 trillion token burn will be an attractive catalyst when BONK reaches its 1 million holders milestone. At present, with 974,838 holders, 25,162 extra holders are required to cause this deflationary event. There is a positive price momentum historical track of such burn strategies in the past, but sustainability is still subject to the larger market sentiment.
The platform dominance of Bonk. Fun also presents an additional bullish layer, with 62% of the total Solana memecoin launchpad revenue of 16.7 million in total between August 4 and 17. This ecosystem leadership will push organic BONK demand because new token launches need tokens native to run. Nonetheless, the intense rivalry with Pump. Fun, which offers the establishment of a daily buyback of 1 million dollars, poses a continuous threat of volatility.
Technical analysis shows that the critical test of BONK is at the 200-day exponential moving average of 0.00002217. A continuous pressure of buying that exceeds this level might be a confirmation of the continuity of bullish momentum. Institutional approval, deflationary tokenomics, and platform utility all converge in support of BONK, but it requires prudent optimism that the volatile memecoin markets will not subvert the opportunities.
The daily revenue indicators at the Exchange reserve and Bonk. Fun will be used as the initial trend signal to confirm the traders who will place their orders before the next milestone of the holder milestone can be met.
Institutional Backing and Burns Anchor Bullish Setup for BONK
BONK’s rebound to $0.00002331 amid institutional allocations and upcoming token burns highlights the token’s maturing market position. Safety Shot’s $25 million BONK treasury diversification and Everything Blockchain’s MemeStrategy underline confidence in the Solana-based memecoin, while Bonk. Fun’s dominance with 62% of Solana’s launchpad revenue ($16.7 million) strengthens ecosystem demand. With only 25,162 holders needed to unlock a 1 trillion token burn, deflationary mechanics may drive renewed upside.
BONK Price Analysis of July 13, 2025
Bonk price action on July 13, 2025, was characterized by repeated attempts to sustain upward momentum, with the day’s high marked at $0.00002648 at 00:15 IST during an upward-moving channel. RSI signaled overbought conditions at the peak, prompting a series of bearish MACD crossovers and downside breakouts. Despite forming multiple channels and ranges, follow-through on both bullish and bearish moves was often limited. Brief recoveries were met with exhaustion, and RSI oscillated between overbought and oversold zones throughout the day. After hitting a low near $0.00002450, Bonk attempted a recovery with an upside breakout from an expanding triangle pattern.
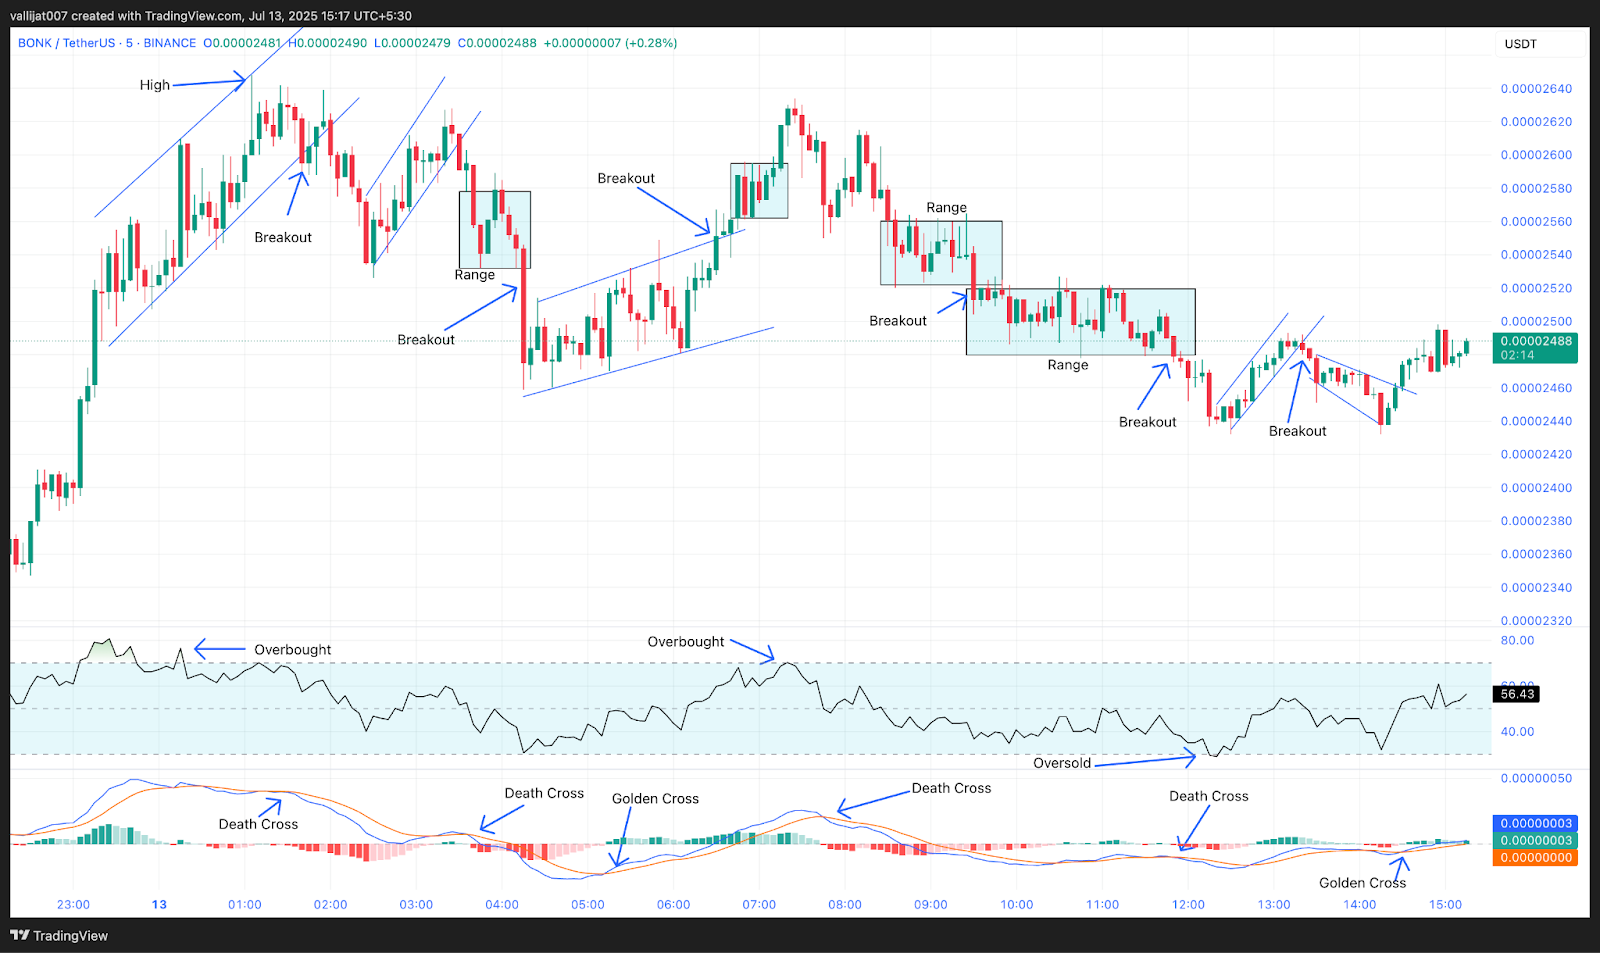
Chart 1: BONK/USDT M5 Chart, Analysed by vallijat007, published on TradingView, July 13, 2025
Bonk price formed an upward-moving channel, which marked the high for the day at $0.00002648 at 00:15 IST. RSI was above the level of 70, indicating overbought market conditions, suggesting a reversal or at least a pullback. The upward-moving channel broke out at 01:40 IST, supported by a death crossover of the MACD. Price spiked to the downside and formed another upward-moving channel.
The channel again broke out to the downside at 03:30 IST, supported by a death crossover of the MACD. Price spiked to the downside, and a minor range developed. The range again broke out to the downside at 04:15 IST, supported by a death crossover of the MACD. The BONK price formed a strong bearish Marubozu candle, but it did not have follow-through, suggesting exhaustion in the move.
Consecutive Range Breakdowns at 04:00 & 06:20 IST
Price formed another moving channel with very little angle. The channel broke out to the upside at 06:30 IST, supported by a golden crossover of MACD. Price spiked to the upside, and a minor range followed. The minor range broke out to the upside at 07:15 IST, supported by a golden crossover of MACD, but the momentum of the breakout was weak, and the price dropped to the downside at 07:20 IST. RSI was above the level of 70, indicating overbought market conditions, suggesting a reversal or at least a pullback.
Price formed a range. The range broke out to the downside at 09:30 IST, supported by a death crossover of the MACD. Price spiked to the downside, and another range developed. The range broke out to the downside at 11:50 IST, supported by a death crossover of the MACD. BONK price spiked to the downside, pushing RSI below the level of 30, indicating oversold market conditions, suggesting a reversal or at least a pullback.
Price formed an upward-moving channel, which broke out to the downside at 13:20 IST, supported by a death crossover of MACD. Price spiked to the downside, and an expanding triangle pattern formed. The expanding triangle pattern broke out to the upside at 14:30 IST, supported by a golden crossover of the MACD. If the breakout succeeds, then the price may rise to the level of $0.00002700. If the breakout fails, then the price may drop to the level of $0.00002100.
Bonk Struggles for Direction After Volatile Swings Between $0.00002100 and $0.00002648
With highs of $0.00002648 and lows around $0.00002100, bonk price action showed definite indecision. Although the growing triangle breakout at 14:30 IST provided some bullish upside, previous unsuccessful breakouts and poor momentum suggest caution. Extreme RSI cycles point to increased volatility without consistent trend strength. Should Bonk pricing stay above the breakout region, a push toward $0.00002700 might occur. Failure to hold gains, however, could create a route back to the $0.00002100 support. Before committing to directional trades, traders should wait for confirmation with volume and trend indicators as the market stays brittle.


