

Are you looking to invest in Bitcoin Cash (BCH) and want to be backed by detailed price analysis before making the plunge? Then, this BCH price analysis is for you, combining recent price action with some critical technical signals. Whether you aim to catch the next BCH breakout or simply want to understand current market behavior, we’ll walk you through the latest trends. Using real chart data and momentum indicators like RSI and MACD, this review breaks down BCH’s movement across different timeframes to help you make smarter decisions. Let’s dive right into the market insights!
BCH Price Analysis of 28th April, 2025
The Bitcoin Cash (BCH) price action on a 5-minute chart on April 27, 2025, exhibited a sharp bearish sentiment early on, breaking below initial trading range support around $353. As selling intensified, BCH entered a descending channel, slipping steadily lower. Between 00:00 UTC and 03:00 UTC, Bitcoin Cash price action hovered near $353 before marginally rebounding into a tight sideways range between $350 and $357, suggesting temporary equilibrium. RSI during this phase swung between neutral and slightly oversold levels, while MACD showed weak bullish momentum with brief golden crosses. However, neither indicator sustained enough strength to trigger a significant upside move.

Chart 1, Analyzed by Alokkp0608, published on April 28th, 2025.
Between 03:00 UTC and 06:00 UTC, BCH price largely respected the sideways structure, failing to establish higher highs. Minor price attempts to breach the $357 resistance were rejected multiple times, preventing a BCH breakout. In this stretch, RSI oscillated without reaching overbought territory, indicating cautious market sentiment. MACD showed repeated small death crosses, implying underlying bearish pressure. By around 08:00 UTC, sellers reasserted control, driving Bitcoin Cash price into a new, longer moderate downtrend channel. The coin’s price action exhibited systematically lower and lower highs, pointing toward growing weakness, as BCH inched closer to the central support zone at $345.
Between 18:00 UTC and 00:00 UTC, BCH price struggled to break the descending pattern despite brief bounce attempts. Around 21:00 UTC, a sharp recovery effort emerged but failed quickly, leading to another leg downward. Price action eventually tagged the $345 support near the new trading day. During this leg, RSI flirted with oversold territory multiple times, while MACD maintained a bearish bias. However, upon touching support, a notable shift occurred. Buyers entered aggressively, and BCH began a decisive upward channel formation.
BCH Price Outlook: What’s Next for Bitcoin Cash?
From 03:00 UTC onward, momentum for the BCH price improved significantly. RSI readings moved into overbought territory multiple times between 03:00 UTC and 09:00 UTC, showing renewed bullish strength. MACD has confirmed the previous upward trend with golden crosses and expanding histograms. Bitcoin Cash price reached a high of $355 at around 08:35 UTC before hitting resistance and selling pressure. A slight pullback to $352 happened, but was of little conviction, indicating mostly profit-taking and not a significant trend reversal. BCH then began another cautious rally toward the critical resistance level of approximately $360, which suggests a considerable hurdle to push through for any bulls.
Will $360 Resistance Break or Hold?
The price of Bitcoin Cash (BCH) has returned to life after recently bouncing off support at $345, which marks a change in momentum. BCH’s price had bearish pressure and was traded above key short-term support and resistance levels, where buyers are gaining traction. The RSI is pushing further into overbought, and the MACD is confirming bullish momentum, so we could start to see BCH target $360 resistance. This level will be critical, which, if broken, could allow for further upside, but if BCH struggles, this may be a sign that BCH will pull back. Focus on this key level as it will likely define BCH’s next big move.
BCH Price Analysis of April 30th, 2025
The Bitcoin Cash price action on a 5-minute chart on 29 April, 2025 started with a continuation of bullish momentum from the prior day, surging sharply at 00:35 UTC. This spike led into an uptrend channel, sustaining higher lows through the early morning hours. Between 03:00 UTC and 06:00 UTC, BCH price oscillated between $368 and $372 with brief consolidations, followed by multiple overbought RSI prints and a death cross on the MACD near 05:00 UTC. Price action began to flatten by 06:30 UTC as buying strength faded. Between 06:00 UTC and 09:00 UTC, BCH made a last push toward $373 but failed to hold a BCH breakout.

Chart 2, Analyzed by Alokkp0608, published on April 30th, 2025.
Between 09:00 UTC and 12:00 UTC, BCH price traded sideways just below the $376 resistance, forming lower highs while MACD momentum weakened. The RSI hovered near 60 but showed bearish divergence as the price stalled below the resistance level. A decisive BCH breakout occurred after 14:00 UTC as BCH surged and briefly pierced $376 by 16:35 UTC. This marked a key technical event but lacked volume support, causing a sharp rejection. The RSI printed overbought near the breakout, while the MACD lines curved downward, signaling a false breakout. Price quickly reversed and began forming lower highs and lower lows, marking the start of a new bearish channel.
BCH Broke Down to Support, then Rallied Inside a New Uptrend
Between 18:00 and 21:00 UTC, the downtrend continued to gain momentum as BCH price declined from $374 to just under $365. A death cross occurred on the MACD around 19:00 UTC, indicating that there was, at a minimum, continued bearish momentum. The RSI crossed into oversold territory by 20:00 UTC as the coin tested previous intra-day lows. Bitcoin Cash price failed to hold intraday bounces as the structure of the downtrend channel remained intact, guiding price steadily toward the $360 support level. A final sell-off wave completed by 01:45 UTC on 30 April, with the price touching $360 and RSI bottoming below 30, indicating temporary exhaustion in sellers.
The trend reversed between 03:00 UTC and 06:00 UTC on 30 April as BCH price entered a clean uptrend channel. Buyers stepped in aggressively, pushing the price from $360 to a peak of $369 by 04:55 UTC. A golden cross appeared on the MACD near 04:00 UTC, followed by RSI surging into the overbought zone. This BCH breakout reclaimed lost territory, breaking above $365 and briefly challenging $369. However, the move lacked follow-through, and the price slipped into consolidation. By 06:30 UTC, MACD showed slowing upward momentum while RSI began cooling from its highs.
BCH Price Outlook – What Lies Ahead for Bitcoin Cash?
BCH transitioned into a sideways structure between 06:00 UTC and 09:30 UTC. Price ranged between $363 and $367, holding above the lower trendline from the earlier uptrend channel. The MACD registered a death cross near 07:00 UTC, while the RSI fluctuated between 50 and 58 without a clear directional bias. Despite minor dips, the price found consistent short-term support around $364, signaling buyers were active on pullbacks. There was no strong continuation of the earlier breakout, but sellers did not take control, suggesting a balance near a neutral zone.
Bullish Pullback Faces Resistance Near $369
BCH price stabilizes after reclaiming ground from its $360 support zone, but momentum appears neutral in the near term. Prices may continue consolidating between $364 and $369 unless volume increases sharply. Momentum shifted bullish earlier in the day but has since stalled, as MACD shows flattening signal lines and RSI stays under 60. The key support to watch remains at $360, while resistance looms near $369 and again at $376. If BCH clears $369 with volume and MACD confirmation, it could revisit $376. Otherwise, a rejection could pull the price back toward $362–$360. Overall, BCH leans slightly bullish but needs confirmation.
Bitcoin Cash(BCH) Price Analysis of May 2, 2025
The Bitcoin Cash price action on a 5-minute chart over the past 24 hours opened inside a shallow falling sideways path, drifting between $371 and $364. This consolidation dominated until 08:00 UTC. The MACD showed weak directionality here, while RSI dipped near oversold, suggesting slow momentum. A clear BCH breakout emerged around 08:05 UTC, as BCH surged above $365 with momentum building. RSI entered overbought briefly, confirming bullish strength. This climb quickly brought the price to the well-defined resistance level near $373 by 11:05 UTC, where it was sharply rejected. The rally stalled, and BCH price hovered near the resistance, suggesting indecision.
Chart 3- Analyzed by Alokkp0608, published on May 2nd, 2025

Price action between 12:00 UTC and 15:00 UTC turned choppy. BCH price initially consolidated under resistance, then dipped to $367.5 by 13:25 UTC. RSI slid down from overbought while MACD showed a weakening bullish histogram. Another rally attempt followed, but BCH was rejected again at $373 around 15:10 UTC. This second rejection triggered a shift in momentum, confirmed by a death cross on the MACD and falling RSI levels. From there, BCH entered a defined downward channel. Sellers gradually gained control, sending prices lower as each rally attempt became weaker than the last.
Bearish Continuation Breaks Down Into Support Bounce
Between 15:00 UTC and 00:00 UTC, BCH price declined steadily through the descending channel, eventually reaching $359 by 00:10 UTC on May 2. The RSI entered oversold territory multiple times during this slide, and MACD momentum remained bearish, reinforcing the strength of the downtrend. The support zone between $359 and $357.5 absorbed this selloff, marking a solid floor. A bullish spike emerged around 01:55 UTC, breaking out of the descending structure. RSI jumped quickly from oversold, and MACD flipped with a golden cross, signaling a potential short-term trend reversal.
Bitcoin Cash price rebounded sharply in the early hours of May 2, retracing gains toward the $373 resistance by 05:40 UTC. Despite intense bullish pressure and overbought RSI signals, the coin faced rejection for the third time. MACD showed rising histogram bars initially but flattened soon after, hinting at weakening momentum. Post-rejection, BCH price entered a brief sideways phase between $368 and $371. The market appeared indecisive, unable to build follow-through above resistance or fall back toward support, as buyers and sellers remained evenly matched near the top.
Another Rejection as Market Stalls Below Resistance
BCH Price surged again near 08:20 UTC, pushing into the $373 zone, but again faced rejection. This marks the fourth test and failure at this resistance, indicating a strong overhead supply. RSI stayed elevated but below extreme overbought levels, while MACD began narrowing, suggesting diminishing bullish momentum. The inability to clear the $373 level despite multiple attempts could lead to buyer exhaustion. Prices pulled back modestly, stabilizing around $371 at the time of chart capture, signaling hesitation among traders after repeated resistance failures.
Can Bitcoin Cash Overcome the $373 Roadblock or Stall Again?
Bitcoin Cash price remains locked below the critical resistance at $373 despite multiple breakout attempts. Current momentum leans neutral-bullish, but fading strength and repeated failures could soon pressure support levels. If bulls regain momentum, a clean BCH breakout at $373 could open the path toward $377 and higher. On the downside, a fall below $367 would expose $360–$357.5 again. RSI hovers just above 57, showing neutral momentum with a slight bullish lean, while the MACD is slightly positive but losing strength. BCH may consolidate or dip before the next significant move unless buyers regroup fast.
Bitcoin Cash Price(BCH) Analysis of May 6th, 2025
The Bitcoin Cash price action over the last 24 hours shows a transition from a bearish structure into bullish recovery and eventual consolidation. Initially, BCH price followed a downtrend channel, breaking lower around 11:00 UTC and heading toward the key support near $350. This decline was accompanied by a death cross on the MACD and a clear RSI dip into oversold territory just before 12:00 UTC. The price touched a low close to $350 by around 15:45 UTC, where it rebounded, signaling potential buyer interest near that support.

Chart 4- BCH/USDT M5 Chart, Analyzed by Alokkp0608, published on May 6th, 2025.
Between 15:00 UTC and 21:00 UTC, BCH price staged a steady recovery but struggled to maintain momentum beyond $357.50. RSI briefly entered the overbought zone near 17:30 UTC before falling back to mid-range, reflecting a temporary spike in bullish pressure. During this window, a golden cross formed on the MACD around 19:00 UTC, helping to support upward movement, though resistance at $360 proved difficult to break. Price ranged between $355 and $359, showing an early sign of a sideways path starting to develop.
BCH Breakout Attempts and Short-Term Consolidation
Between 21:00 UTC and 03:00 UTC, BCH fell again and nearly recovered to form a series of higher lows. A golden cross happened again at about 0030 UTC, and the RSI again gave up some ground toward oversold before recovering, producing another bullish divergence with respect to price action. The price consistently tested resistance around $360 but failed to break through decisively during this phase. However, the formation of an ascending structure indicated growing bullish pressure building toward a BCH breakout attempt.
Between 03:00 UTC and 06:00 UTC, BCH price finally broke above the key resistance of $360. This BCH breakout followed a steep short-term uptrend channel starting around 02:20 UTC, with RSI entering overbought territory during the breakout. MACD momentum confirmed the move with strong histogram expansion post-breakout. The bullish impulse was quick but clean, followed by some immediate profit-taking that led to slight pullbacks, although price action remained above the former resistance.
Range-Bound Movement Above Key Resistance
From 06:00 UTC onwards, Bitcoin Cash price settled into a sideways path just above the $360 resistance-turned-support zone. Price action showed low volatility in this latest window, reflecting indecision after the BCH breakout. RSI remained stable near mid-levels, showing neither overbought nor oversold conditions, while the MACD formed a new bearish crossover but without significant downside pressure so far. The market appears to be in wait-and-see mode, holding above the key $360 level but lacking follow-through momentum for a continued breakout.
BCH Bulls Face Crucial Test at $360
BCH price now floats just above the key $360 resistance-turned-support, showing signs of weakening momentum after the breakout. Short-term price prediction suggests consolidation within the $357–$362 range unless bulls reignite a push toward $365. Support remains strong at $350 and now at $360, while $365 and $368 are the next resistance levels to watch. RSI shows cooling from earlier overbought levels, hinting at pauses or sideways movement, while the MACD’s latest death cross signals caution. For a bullish continuation, BCH must reclaim bullish MACD momentum and see RSI strengthen with renewed volume to confirm buyer interest.
Bitcoin Cash(BCH) Price Analysis of May 8th, 2025
The Bitcoin Cash price action over the last 24 hours presents an initial period of weakness followed by a sharp reversal and eventual upward breakout. BCH moved within a moderate downtrend channel until 18:00 UTC, hitting a low near $355, which marked a local support level. From there, prices transitioned into a sideways path before initiating a strong uptrend. RSI dipped into oversold territory multiple times during the downtrend, highlighting weakening momentum. The MACD confirmed bearish pressure earlier with a clear death cross around 13:00 UTC, reinforcing the short-term negative trend until the reversal phase began.

Chart 5- BCH/USDT M5 Chart, Analyzed by Alokkp0608, published on May 8th, 2025.
From 18:00 to 21:00 UTC, BCH price stabilized between $355 and $364 in a sideways path, forming a base. Around 21:10 UTC, the price began climbing aggressively, breaking above the previous resistance near $390 and briefly touching $391.6 before pulling back. This was the first signal of bullish recovery as BCH started forming a sharp uptrend channel. RSI surged into the overbought zone shortly after, reflecting renewed buying strength. At the same time, MACD triggered a golden cross, aligning with the upward momentum and validating the start of a new bullish phase through late evening.
Buyers Take Charge With BCH Breakout Above $390
Between 21:00 UTC and 00:00 UTC, the BCH price action remained aggressive, with prices establishing support above $390 after the breakout. The Bitcoin Cash rally strengthened after 00:00 UTC on May 8, as the price shot past $400, reaching around $413 by 01:45 UTC. The breakout area at $390–$392 became a confirmed key support level. RSI continued to show overbought conditions throughout the rise, with short pauses during price consolidation. MACD also maintained a bullish bias, though with brief dips. This stretch of bullish dominance marked a transition from short-term reversal to sustained trend continuation, as buyers pushed towards higher resistance levels.
Attempted Surge Toward $430 Meets Resistance
From 03:00 to 06:00 UTC, BCH entered another uptrend phase, this time targeting the upper resistance near $430. The price climbed steadily through $413 and peaked around $429 by 04:20 UTC, but failed to close above the resistance. This failure to break the $430 barrier signaled exhaustion in bullish momentum. RSI remained in the overbought zone leading into the rejection, but gradually declined afterward, signaling weakening demand. Meanwhile, MACD showed a death cross at approximately 05:00 UTC, reinforcing the slowing momentum and suggesting the need for consolidation after a steep Bitcoin Cash rally.
Consolidation Near Resistance After BCH Breakout
During the final hours from 06:00 to 09:00 UTC, BCH price moved sideways between $414 and $417, consolidating just below the resistance level near $430. Price action showed limited volatility, with bulls defending the newly formed $413–$414 support zone. RSI hovered in the neutral range between 42 and 48, suggesting an equilibrium between buying and selling pressure. MACD lines remained closely intertwined with minimal histogram movement, indicating a neutral short-term trend. This quiet consolidation phase reflects indecision, with traders likely waiting for confirmation of either a BCH breakout above $430 or a retracement to previous support around $390.
Bitcoin Cash Rally Stalls as Momentum Cools Near Resistance
Bitcoin Cash surged from the $355 support to the $429 resistance within 12 hours, but momentum has cooled under the $430 barrier. A short-term bullish trend remains intact above the $390 support zone, yet the inability to breach resistance suggests a potential pullback or extended sideways range. RSI has exited the overbought zone, hinting at reduced buyer dominance, while the MACD death cross adds caution. For further upside, BCH price must decisively break above $430. If rejected again, prices could revisit the $400–$390 support range. Overall, BCH maintains a bullish structure, but signs of fading momentum call for vigilance near resistance.
Bitcoin Cash(BCH) Price Analysis of May 12th, 2025
The Bitcoin Cash price action over the last 24 hours shows a transition from a brief bearish continuation into a consolidation zone, followed by a sharp bullish BCH breakout. After previously sustaining a bullish rally, the asset entered a descending channel beginning around $412, dipping toward a strong support level of $405 by approximately 16:05 UTC. Notably, this decline coincided with two RSI oversold conditions and successive MACD death crosses, affirming downward pressure. However, the channel bottom near $405 catalyzed a reversal, triggering a pivot into an uptrend channel that lifted the price steadily back above $410.
Chart 6- BCH/USDT M5 Chart, Analyzed by Alokkp0608, published on May 12th, 2025.
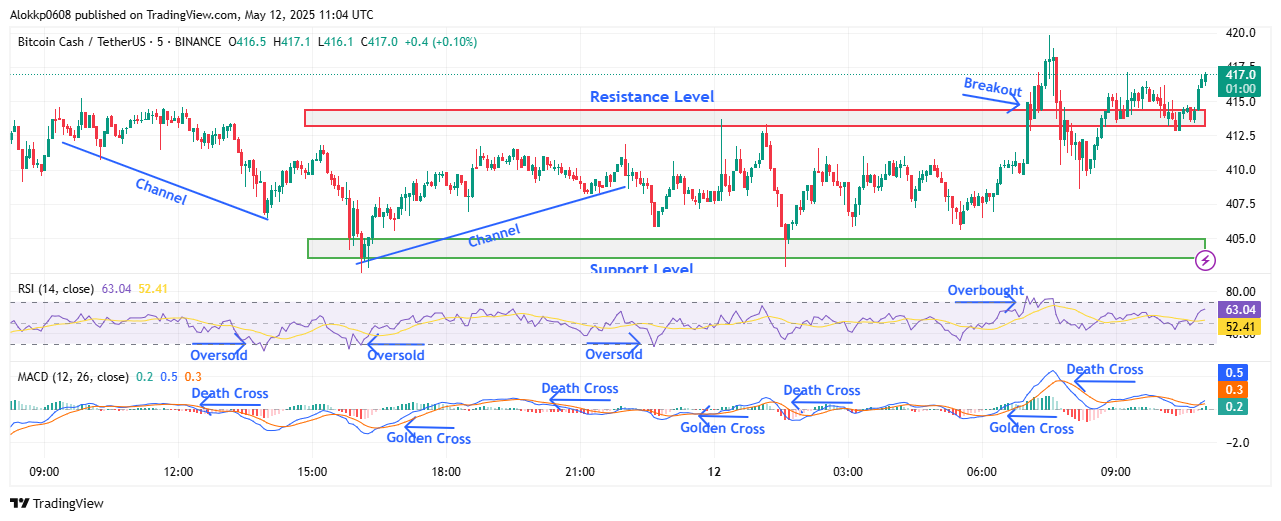
This upward trajectory progressed between 18:00 and 00:00 UTC, peaking around $412 by 22:00 UTC. Despite minor pullbacks, RSI remained relatively stable and avoided overbought conditions, while a MACD golden cross validated renewed bullish momentum. Bitcoin Cash price briefly encountered rejection at the $414 resistance level during the early hours of May 12 but found renewed strength after retesting support around $405 once more. BCH Price fluctuations within the $406–$410 range marked a sideways channel characterized by alternating short-term momentum shifts, with MACD crosses alternating between bullish and bearish stances in a narrow timeframe.
Buyers Regain Control After Dip
Following this range-bound phase, the BCH price surged decisively around 07:00 UTC, breaching the $414 resistance zone with conviction. The BCH breakout to $419.8 was accompanied by an RSI spike into overbought territory, signaling strong momentum despite the risk of short-term exhaustion. MACD also issued a bullish crossover just ahead of the breakout, reinforcing the breakout’s legitimacy. After this upward burst, a modest retracement tested the $414 zone, now turned support, but was quickly absorbed by buyers, suggesting a shift in market structure from consolidation to expansion.
The subsequent recovery after the pullback highlighted bullish resilience. Buyers reclaimed ground efficiently, with price stabilizing above $415 and showing higher lows within the new range. MACD signal line maintained upward slope while avoiding a reversal, and RSI normalized near the 60s without slipping into bearish zones. This behavior indicates that bullish control has not only been reestablished but also remains structurally intact. The $419–$420 zone now emerges as a short-term target, while continued closes above $414 strengthen the case for sustained upside.
Consolidation Near Resistance After BCH Breakout
As of the most recent 3-hour interval leading into 11:00 UTC, BCH price has been trading steadily above the key $414 resistance-turned-support level, holding around $417. Although no fresh highs were posted post-breakout, the price structure remains constructive. RSI hovers just above neutral, suggesting digestion of gains without excessive selling. Meanwhile, MACD lines remain tightly compressed, hinting at a potential inflection point, either continuation or mild correction, pending directional confirmation.
Bulls Establish a Foothold Above Key Resistance
Bitcoin Cash currently exhibits bullish momentum, with price stabilizing above the prior $414 resistance following a confirmed breakout. Momentum remains supportive, though near-term exhaustion is plausible given recent overbought RSI readings. Support levels to monitor include $414 and $410, while resistance lies between $419 and $422. RSI has moderated from the overbought zone and now reflects a healthy trend continuation setup. MACD’s recent golden cross supports upward bias, though a close watch on volume and signal separation is needed to confirm strength. Should consolidation sustain above $414, BCH price is positioned to retest $420 in the coming hours.
Bitcoin Cash (BCH) Price Analysis of May 14th, 2025
The Bitcoin Cash price action over the last 24 hours shows the transition from early sideways trading to trend formation and breakouts. The price was moving sideways until around 14:50 UTC, consolidating post a downtrend and forming a robust base around the $400 support. From this level, a steady uptrend channel emerged, marked by consistently higher lows and increasing volume. A BCH breakout occurred just after 18:00 UTC as the price surged past the resistance level at $408, backed by a golden cross on the MACD and an RSI spike into the overbought zone, confirming upward momentum.
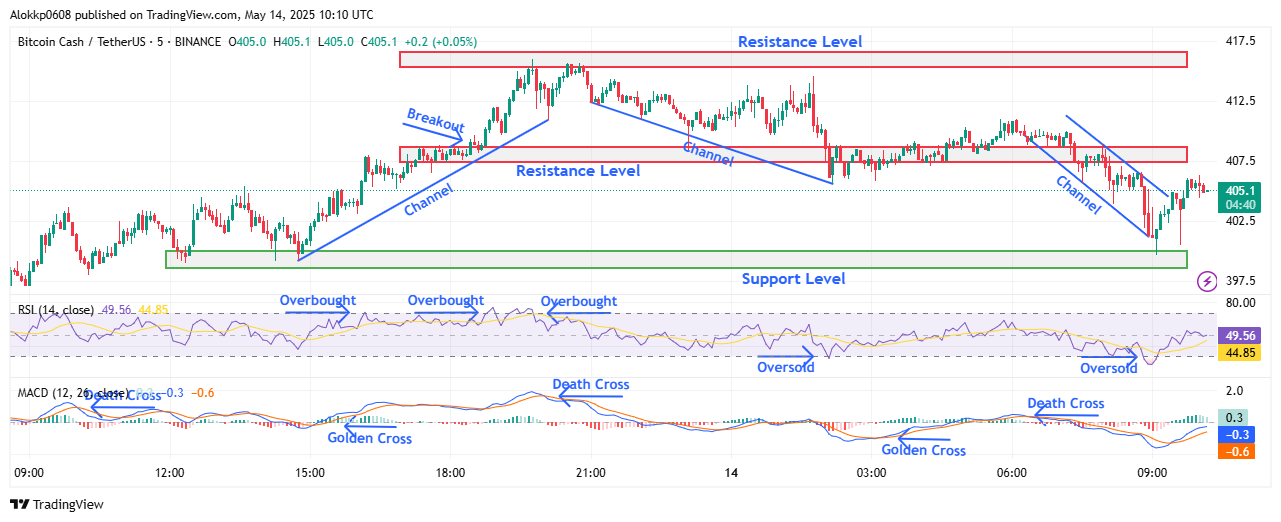
Chart 7- BCH/USDT M5 Chart, Analyzed by Alokkp0608, published on May 14th, 2025.
Momentum carried BCH price toward a new high near $416, tested twice between 19:45 and 20:45 UTC but rejected both times, creating a double top. This resistance zone acted firmly, triggering a downtrend channel that took the price back below $408 by 02:00 UTC on May 14. RSI dropped from overbought to neutral, while a MACD death cross at this level signaled weakening bullish strength. The inability to hold above the BCH breakout zone suggested profit-taking and fading buyer conviction at higher levels, despite earlier momentum signals.
Buyers Regain Control After Dip
Following the retreat from $416, BCH price moved sideways above the earlier resistance zone, now acting as support, until around 07:15 UTC. This period showed reduced volatility, with RSI stabilizing near mid-levels and MACD flattening, hinting at market indecision. Around 07:15 UTC, a sharper downward leg formed another descending channel. In this drop, BCH briefly fell below the key support zone of $400 by 09:05 UTC. The RSI also went into oversold level, and MACD gave a weak bullish crossover signal shortly thereafter, which may indicate the potential for a bounce.
Indeed, a price recovery followed immediately, pulling BCH price back above $402 and gradually toward the $405–$406 area. The RSI bounced sharply from the oversold zone, rising toward 50, reflecting renewed buyer interest at the critical $400 support. At the same time, the MACD histogram showed weakening bearish momentum, supporting the rebound narrative. These signals suggest short-term accumulation behavior around the major support, though price remains technically capped under a now-tested resistance.
Consolidation Near Resistance After Recovery
As of the latest chart reading near 10:05 UTC, BCH price is trading around $406 and hovering just under the $408 resistance zone. While the rebound from $400 shows buyers defending the support level, the recovery lacks strong follow-through so far. RSI remains below 50, hinting at only partial momentum recovery, while MACD is turning slightly positive but without clear separation from the signal line. This positions BCH in a consolidation phase near resistance, where any upside break will require strong volume and fresh bullish confirmation.
BCH Awaits Breakout from $408 Resistance Zone
Bitcoin Cash price has shown resilience by bouncing back from the $400 support, but momentum remains neutral. For further upside, BCH must close decisively above the $408 resistance. If successful, it could re-test the $416 level. On the downside, a rejection could drag it back toward $400. RSI recovery from oversold suggests near-term support, while MACD’s flat but slightly positive signal reflects caution. Traders should monitor for a MACD crossover confirmation or price surge above $408 before committing to fresh long positions. Until then, BCH stays range-bound with cautious optimism.
Bitcoin Cash (BCH) Price Analysis of June 7th, 2025
The Bitcoin Cash price action today shows early sideways consolidation before a bullish breakout above a key resistance. Price stayed in a tight $394–$400 zone until around 02:07 UTC. Both golden and death crosses on the MACD between 00:20 UTC and 02:07 UTC signaled indecision. RSI oscillated close to midline, occasionally tagging overbought or oversold zones without commitment. From 01:30 to 02:40 UTC, a slow uptrend emerged with a small HL at $396.2 and HH near $398.8, eventually pushing price into a more defined upward channel starting just before 03:00 UTC.
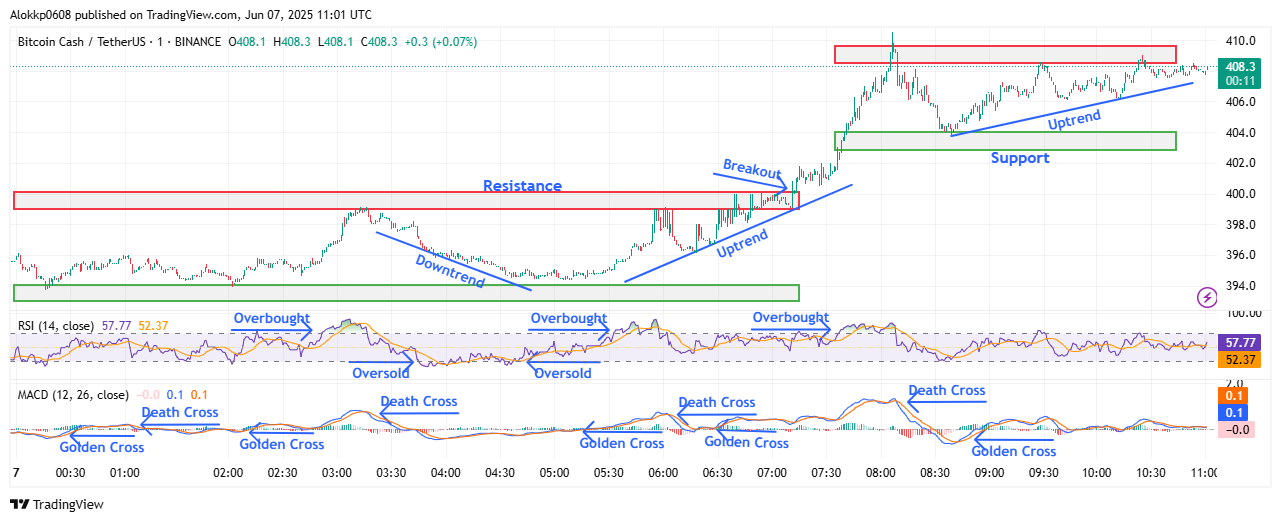
BCH/USDT M-1 Chart, Analyzed by Alokkp0608, published on June 7th, 2025.
Between 02:40 UTC and 05:10 UTC, the price entered a structured uptrend. Price formed clear HLs around $398.8 and $400.6, with HHs breaching $403. The breakout above $400 signaled a psychological and technical RL flip. A golden cross on the MACD at 02:07 UTC supported the bullish move, followed by another at 05:11 UTC that reinforced momentum. RSI entered the overbought zone multiple times, confirming strength behind the push. This phase was marked by steady stair-step gains and supportive MACD histogram growth, building a clean trendline base for further upside pressure.
Breakout Confirmation and Strong Rally Above Resistance
From 05:10 UTC to 07:15 UTC, BCH price displayed aggressive bullish continuation, rallying from around $403 to break above the $410 mark. This section confirmed a breakout of the long-standing $400–$404 resistance zone. Price formed successive HHs, with a major push between 06:40 and 07:11 UTC. The MACD golden cross at 06:28 UTC and RSI re-entering the overbought region confirmed this strength. Notably, the uptrend accelerated right before the breakout, forming a classic ascending triangle structure, which often precedes breakouts. A swift MACD death cross followed at 08:08 UTC, signaling a short-term exhaustion of momentum.
Between 07:15 UTC and 09:00 UTC, BCH price faced resistance near $410, forming a double top at $409.8. The price dipped slightly toward $404.5, respecting a newly formed support zone between $404 and $406. RSI cooled off from its earlier overbought levels, indicating sellers stepping in. MACD confirmed the shift with a bearish cross at 08:08 UTC, and histogram bars turned red briefly. Despite this, the correction was mild and the price held higher lows. The structure still supported bullish bias with HLs around $406, showing buyers defending the new support successfully after the breakout.
New Uptrend Reinforced Despite Short-Term Resistance
From 09:00 UTC to the close at 11:00 UTC, BCH price gradually regained strength after the pullback. Price action formed a clean HL at $406.2 and resumed climbing in a disciplined uptrend, setting higher lows and highs toward $408. MACD flipped back bullish with a golden cross at 08:42 UTC, though without explosive momentum. RSI stabilized around 55–60, suggesting neutral-to-slight bullish pressure. Notably, price respected the uptrend line drawn from earlier support near $398. The current structure indicates accumulation rather than aggressive buying, with resistance still capped at $410, forming a broadening consolidation pattern at the top.
BCH Holds Gains After Breakout but Faces Resistance at $410
Bitcoin Cash price remains in a bullish structure with momentum intact, but faces resistance pressure at $410. Price is holding higher lows above $406, showing buyers are still in control. Immediate support levels lie at $406 and $404, while the major resistance to watch remains $410. If broken, BCH could target $412–$415 next. MACD is modestly bullish after the latest golden cross, though the lack of steep histogram growth suggests slowing momentum. RSI remains elevated but below overbought, hinting at potential for another push. Unless $404 breaks down, the short-term bias remains cautiously bullish for the next few hours.
Bitcoin Cash Price Analysis of June 19th, 2025
The Bitcoin Cash price action today shows an early struggle inside a tight channel between $454.5 support and $458 resistance. Prices opened with a downward move, tagging the support by 00:14 UTC, then pivoted into a sharp rise by 00:21 UTC. A brief breakout above resistance occurred at 00:31 UTC, reaching $459.7 before stalling. The RSI surged into overbought territory, and MACD formed a golden cross just before the move. However, momentum faded quickly—by 00:58 UTC, a death cross on MACD aligned with a price fall that erased earlier gains, returning back to the $454.5 support.
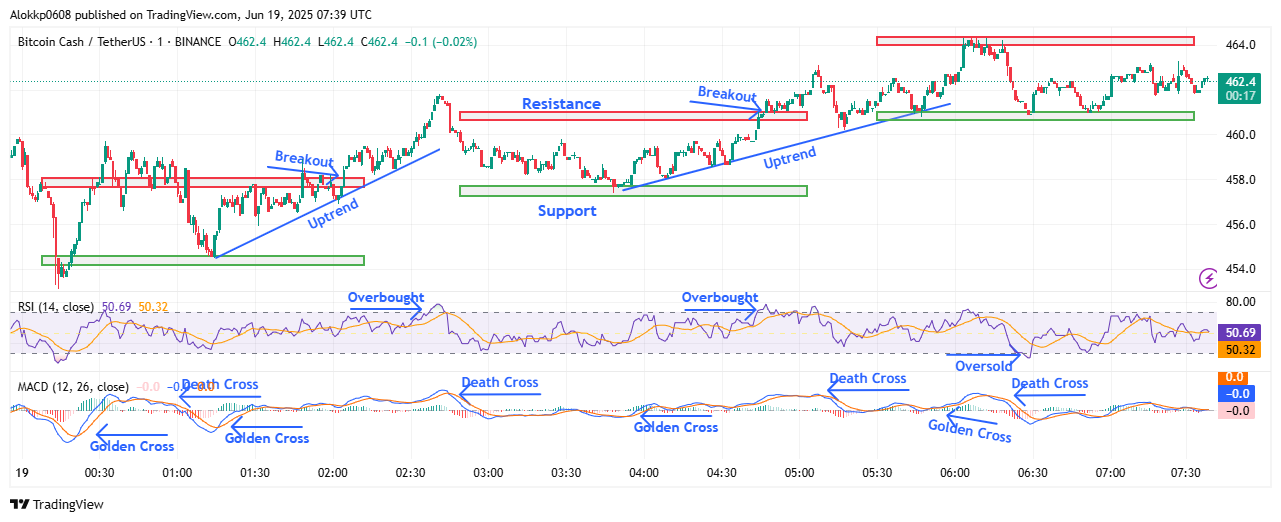
BCH/USDT M-1 Chart, Analyzed by Alokkp0608, published on June 19th, 2025.
By 01:15 UTC, buyers stepped in again, initiating a strong upward push. The MACD issued a fresh golden cross, and BCH pierced above the $458 level around 02:04 UTC. The rally extended to a high of $461.8 by 02:41 UTC, printing a clear Higher High (HH) and confirming a short-term uptrend. But resistance held, triggering a quick dip to $458.5 by 02:44 UTC as the MACD issued a death cross. The short rally-reversal pattern around this time introduced a new structure range, with support raised to $457.5 and resistance adjusted to $461. Momentum showed fatigue as RSI cooled down after a brief overbought phase.
Uptrend Falters Amid Resistance Rejections
Between 03:00 and 04:47 UTC, BCH Price consolidated near the new support at $457.5. After several Higher Lows (HLs), an upward leg resumed by 03:55 UTC, supported by another golden cross on the MACD. The price finally broke above $461 at 04:47 UTC, confirming a new bullish structure. This BCH breakout introduced a fresh support/resistance band between $461 and $464. The price action showed stair-stepping HHs, although volume looked light. The RSI hovered just below overbought, showing caution among buyers. The structure remained constructive, but the pace of ascent slowed, signaling a shift from aggressive to cautious accumulation.
Rejection at $464 Triggers Pullback to Support
The bullish momentum peaked near 06:05 UTC when BCH price hit the $464 resistance zone. Despite multiple attempts, buyers failed to break through. This rejection coincided with an RSI snapdown from overbought territory and a death cross on the MACD by 06:19 UTC. Prices reversed and declined steadily, reaching the $461 support by 06:28 UTC. This pullback confirmed a Lower High (LH) against the earlier $464 peak and marked the beginning of a sideways to corrective phase. The RSI briefly dipped toward oversold while MACD flattened, suggesting momentum exhaustion rather than a reversal into full bearish control.
Sideways Drift Forms Tight Trading Zone
From 06:30 UTC to the chart’s end at 07:38 UTC, BCH traded in a compressed range between $461 and $464, bouncing between support and resistance. Price action printed several short swings, but the structure showed no new HH or LL, indicating a stalling trend. MACD produced another death cross shortly after 07:00 UTC, although the signal lines remained close, hinting at indecision. RSI oscillated near midline with no directional bias. Overall, the market entered a sideways congestion phase, possibly waiting for volume to return or macro triggers to spark a breakout from the narrowing structure.
Consolidation Holds as Buyers Look for Direction
The latest structure suggests Bitcoin Cash price is in a holding pattern just below the $464 resistance. With repeated failures to break this level and RSI flattening near 50, momentum appears neutral. MACD’s frequent golden and death crosses point to indecision, not strength. Immediate support rests at $461, followed by deeper support at $457.5. On the upside, reclaiming and holding above $464 is key for any bullish continuation. The short-term outlook remains rangebound unless a BCH breakout or breakdown develops. The price action today, from the open through the end of the chart, reflects a market caught between fading rallies and cautious dip buying.


