

Despite occasional recovery attempts, Cardano showed a gradual downward shift throughout the session. After marking the session high near $0.718, the price formed an upward-moving channel that soon broke to the downside, pulling ADA lower. A support zone developed around $0.691, while resistance clustered near $0.7025. RSI frequently shifted between oversold and overbought zones, signalling instability and range-bound behaviour. Cardano’s structure suggested increasing bearish pressure, with minor upward moves failing to sustain. Consolidation patterns dominated the session as momentum weakened. Let’s take a look at Cardano price analysis to see how ADA reacted to the patterns.
Cardano (ADA) Price Analysis of July 11, 2025
The Cardano price action on July 11, 2025, was driven by a sequence of technical breakouts and momentum shifts. The session opened with a converging triangle pattern that marked the low for the day at $0.6173. A golden crossover of MACD triggered upside movement, followed by a series of converging triangles and channel formations. Despite temporary pullbacks and overbought RSI conditions, Cardano maintained upward momentum throughout the day. Strong bullish signals, especially during the U.S. session, helped the price push higher, ultimately setting the high for the day at $0.7223 before momentum showed signs of fatigue.

Chart 18: ADA/USDT M5 Chart, Analysed by vallijat007, published on TradingView, July 11, 2025
The Cardano price formed a converging triangle pattern. The converging triangle pattern marked the low for the day at $0.6173. The pattern broke out to the upside at 06:55 UTC, supported by a golden crossover of MACD. Price spiked to the upside and formed another converging triangle pattern. The second pattern broke out to the downside at 09:40 UTC, supported by a death crossover of the MACD. Price spiked to the downside and formed an upward-moving channel. The channel broke out to the downside at 12:00 UTC, supported by a death crossover of MACD, and formed another converging triangle pattern.
Channel Reversal at 04:45 UTC Precedes Final High Formation
This pattern broke out to the upside at 14:55 UTC, supported by a golden crossover of MACD, leading to the formation of a moving channel. The channel broke out to the upside at 16:20 UTC, supported by a golden crossover of MACD. Price spiked to the upside and formed a range. At 16:35 UTC, RSI moved above the level of 70, indicating overbought market conditions, suggesting a reversal or at least a pullback. The range broke out to the upside at 17:05 UTC, supported by a golden crossover of MACD. Price spiked to the upside and formed a downward-moving channel.
The channel broke out to the upside at 18:50 UTC, supported by a golden crossover of MACD, and formed an upward-moving channel. The channel again broke out to the upside at 21:15 UTC, supported by a golden crossover of MACD, and a range developed. At 21:45 UTC, RSI moved above 70, indicating overbought market conditions. The range tried to break out to the downside at 00:15 UTC on 11th July 2025, supported by a death crossover of MACD.
But the breakout failed, and the Cardano price rose to the upside, forming a downward-moving channel. The downward-moving channel broke out to the upside at 04:45 UTC, supported by a golden crossover of MACD, and an upward-moving channel appeared. The channel broke out to the downside at 06:35 UTC, supported by a death crossover of MACD, but the momentum failed, and the price formed an upward-moving channel, which marked the high for the day at $0.7223.
Cardano Climbs to $0.7223 Amid Bullish Momentum but Overbought Conditions Signal Caution
The Cardano price climb to $0.7223 reflected a strong bullish trend backed by consistent golden MACD crossovers and breakout patterns. However, repeated overbought RSI readings above 70 late in the session indicate that a pullback may be near. Most downside breakouts failed to sustain, highlighting buyer control, but weakening follow-through on late breakouts suggests potential exhaustion. If the price holds above $0.7000, it may retest the daily high. However, failure to hold this zone could lead to a correction toward $0.6700. Traders should monitor MACD and RSI closely as consolidation or a trend shift may be imminent.
Cardano Price Analysis for April 28, 2025
After marking the day’s high at $0.718, Cardano formed a minor upward-moving channel, which broke out to the downside at 01:15 UTC, supported by a Death Cross of MACD. The price dropped to the level of $0.697. In the meantime, RSI dropped below 30, indicating oversold market conditions. Cardano moved to the upside to $0.70 and formed a resistance area there. A range appeared, which broke out to the downside at 11:55 UTC, but the price could not break the level of $0.691 and created a support zone there.

Chart 1: Analysed by vallijat007, published on TradingView, April 28, 2025
A resistance area also appeared in the Cardano price at $0.7025. The resistance broke at 18:40 UTC, supported by a Golden Cross of MACD. The ADA breakout spiked to the upside and formed a range. In the meantime, RSI moved above 70, indicating overbought market conditions and suggesting a reversal or at least a pullback in ADA price. The RSI supported the formation of the range. The range broke out to the downside at 23:00 UTC, supported by a Death Cross of MACD.
Downside Breakout Threatens Drop to $0.670
In the early hours, the Cardano price formed a range that broke out to the downside at 01:20 UTC and marked the low for the day at $0.682. RSI dropped below 30, indicating a reversal or at least a pullback. If the ADA breakout succeeds, Cardano may fall further to $0.670, which acts as a psychological level. If the breakout from the range fails, the price may spike to $0.720, breaking its previous high. Overall, Cardano’s trend is downwards with some minor upward spikes. Traders should be cautious before taking an upside breakout trade in Cardano.
Downward Bias Persists, Key Levels in Play
Cardano remains in a downward trend, with strong resistance near $0.720 and critical support around $0.682. A confirmed breakdown below current levels could target $0.670, a psychological and technical support zone. Conversely, a failure to hold below $0.682 could spark a short-term recovery toward $0.720. Traders should be cautious with breakout trades, as recent ADA price behaviour favours quick reversals and false moves. RSI and MACD suggest unstable momentum, reinforcing the need for confirmation before taking directional positions. Until a decisive breakout occurs, expect Cardano to remain volatile within its broader bearish structure.
Cardano Caught Between $0.6850 Support and $0.7200 Resistance
Cardano began the session inside a downward-moving channel, which broke to the upside at 06:05 UTC, supported by a Golden Cross of MACD. A price spike occurred after the move, combined with an upward-moving channel that is a typical indicator of trending behavior. RSI’s movement above 70 indicated an oversold market situation, which might lead to an upcoming correction. The upward channel later broke down at 12:20 UTC, supported by a Death Cross. Despite the breakdown, the price rose daily to $0.7179. Cardano established a resistance zone at $0.7175 and support around $0.7085, maintaining a broad trading range structure. Let’s take a look at Cardano Price Analysis to see how it reacted to each pattern.
Cardano Price Analysis for April 30, 2025
A downward-moving channel appeared in the price of ADA. The downward-moving channel broke out to the upside at 06:05 UTC, supported by a Golden Cross of MACD. The price spiked to the upside and formed an upward-moving channel, a traditional pattern for a strong trend. In the meantime, at 06:20 UTC, RSI moved above 70, indicating overbought market conditions and suggesting a reversal or at least a pullback. The RSI supported the formation of the upward-moving channel. The upward-moving channel broke out to the downside at 12:20 UTC, supported by a Death Cross of MACD.

Chart 2: Analysed by vallijat007, published on TradingView, April 30, 2025
The ADA breakout from the upward-moving channel failed to form a spike; instead, price moved to the upside and marked the high for the day at $0.7179. Cardano’s price formed a resistance area of $0.7175 and a support area of $0.7085. The ADA price broke out to the downside from the support area at 20:00 UTC, supported by a Death Cross of MACD. Price fell to the downside and formed a converging triangle pattern, marking the day’s low at $0.6888. The ADA price shows range-bound behavior, with breakout moves hitting target prices within a larger trading zone.
Will Bears Push to $0.6850 or Can Bulls Regain Control?
The converging triangle pattern formed yesterday broke out to the upside, supported by a Golden Cross. Price spiked to the upside and formed another converging triangle. This second converging triangle broke out to the downside at 05:00 UTC, supported by a Death Cross of MACD. If the ADA breakout succeeds, Cardano may mark another low and reach $0.6850. If the downside breakout fails, then Cardano may rise to the level of $0.7200. As Cardano shows trading range behavior, traders should be cautious before taking breakout trades and exit at the target level instead of holding swing positions.
ADA Remains Range-Bound With Defined Targets
The Cardano price continues to trade within a defined range, with recent breakout attempts quickly reverting into consolidation. After a brief upside move, the ADA price formed a second converging triangle that broke down at 05:00 UTC. If the breakdown holds, ADA may test $0.6850. If it fails, the next upside target is $0.7200 if the trading range behaviour persists. Given the current range-bound setup, traders should treat breakouts cautiously and focus on short-term targets rather than extended swing trades. Momentum indicators confirm indecision, so trading only on confirmed moves with clear exits at support or resistance zones is critical.
Cardano (ADA) Price Analysis for May 2, 2025
ADA displayed a strong upward momentum as the price went up the whole day. After marking the day’s low at $0.6791, Cardano formed an expanding triangle pattern, which broke out to the downside at 03:45 UTC, supported by a Death Cross of MACD. Price spiked to the downside and formed a small range, which broke out to the upside at 04:55 UTC, supported by a Golden Cross of MACD. The ADA price spiked upward and formed another small range, which attempted to break to the downside at 06:05 UTC.
But the ADA breakout failed, and the price formed an upward-moving channel. The upward-moving channel broke out to the upside at 08:15 UTC, supported by a Golden Cross of MACD. The ADA price again spiked and formed another upward-moving channel, which also broke out to the upside at 10:15 UTC, supported by a Golden Cross of MACD. This time, however, the spike failed to form a new channel, and instead, a range developed.

Chart 3: Analysed by vallijat007, published on TradingView, May 2, 2025
Meanwhile, at 08:30 UTC, RSI moved above 70, indicating overbought conditions and suggesting a reversal or a pullback. The range broke out to the downside at 13:30 UTC, supported by a Death Cross of MACD. Price dropped to $0.6945, and at 13:55 UTC, RSI fell below 30, signaling oversold market conditions, which suggested a reversal or price recovery.
ADA’s Make-or-Break Levels: Will $0.7255 High Hold?
Cardano price reversed to the upside and formed a converging triangle, which broke out to the downside at 17:35 UTC, supported by a Death Cross of MACD. However, the downside breakout quickly faded, and the price recovered slightly, forming a downward-moving channel. This channel broke out to the upside at 21:00 UTC, supported by a Golden Cross of MACD. Price spiked upward and formed a downward-facing converging triangle, which broke out to the downside at 23:00 UTC, supported by a MACD crossover.
The price spiked downward again and formed a range, which broke out to the upside at 02:15 UTC on 2 May 2025, marking the high of the day at $0.7255. Cardano will continue its rise, potentially breaking through $0.7300 if the price remains above the ADA breakout bar. If the breakout procedure fails and triggers buy interest from investors, the price of Cardano will retreat to $0.7050. ADA’s price may extend beyond $0.7000 when this level breaks through with strong momentum before reaching $0.6750.
Currently, Cardano is trading within a highly volatile environment, where breakouts are frequent but often have follow-through. Volatility is elevated, and directional moves are long-lived, supported by substantial volume and clear momentum signals. Market players should track confirmation signs while steering clear of feeble trading signals. The price will determine future market movements since the significant levels of $0.7300 and $0.7000 must be crossed before validating the next clear directional trend.
Cardano Faces Key Test Amid Volatile, Low-Follow-Through Breakouts
Numerous Cardano price breakouts occur within a stable price range on Cardano, as MACD signals tend to produce fleeting market changes with enduring results between volatile periods. The price movements demonstrate reaction patterns because RSI alerts often result in market turnarounds. The price that sustainably exceeds $0.7300 would validate an ongoing bullish trend, but the market could return to bearish control if prices cannot stay above $0.7050. The Cardano price could drop to $0.6750 following a sustained breakthrough of $0.7000. The market requires robust momentum alongside increased volume to validate a breakout, and traders must wait for confirmation near critical technical areas.
Cardano (ADA) Price Analysis of May 6, 2025
During daily trading, Cardano price reached its peak at $0.6920 while forming an expanding triangle pattern, which indicates an elevated level of price volatility. This pattern broke to the downside at 09:55 UTC, supported by a Death Cross on the MACD, triggering a sharp drop. A converging triangle appeared on Cardano price charts as bearish trend pressures consolidated. At 10:25 UTC, RSI fell below 30, signaling oversold conditions and a potential rebound. The triangle eventually broke to the upside at 16:15 UTC, supported by a Golden Cross, but the move stalled after hitting $0.6725.

Chart 4: ADA/USDT M5 Chart, Analysed by vallijat007, published on TradingView, May 6, 2025
Cardano formed an expanding triangle pattern, which marked the high for the day at $0.6920. This pattern is typically indicative of increasing volatility and uncertainty, often preceding a breakout. The expanding triangle broke out to the downside at 09:55 UTC, supported by a Death Cross of the MACD, signaling bearish momentum. Following the breakout, the ADA price spiked sharply downward and formed a converging triangle pattern, a sign of temporary consolidation within a broader trend.
ADA’s Make-or-Break Moment: Oversold Bounce vs. Bearish Pressure
In the meantime, at 10:25 UTC, RSI dropped below the 30 level, indicating oversold market conditions. Market behavior suggested that either a price inversion or a temporary market pullback was possible, and it materialised later within the session. The price movement remained confined inside the converging triangle area throughout several hours while showing inconsistent market behavior. At 16:15 UTC, the converging triangle broke out to the upside, supported by a Golden Cross of the MACD, signaling renewed bullish interest. The price burst upward, reaching $0.6725. This rally, however, was short-lived.
By 18:30 UTC, RSI had risen above the 70 mark, indicating overbought market conditions and suggesting a reversal or at least another pullback was likely. The larger converging triangle formed by Cardano then hit the session’s lowest point at $0.6529. This converging triangle has become the main focal point for monitoring future market movements. If the Cardano price breaks out from this triangle pattern upward, it might recover to intersect the $0.6900 resistance level, which corresponds with the day’s initial peak.
A downside breakout could force price movement towards the $0.6400 ADA support level, which potentially could interest new buying operations. The price of Cardano shows a conflicted market where bullish and bearish momentum fight for dominance, while two key momentum indicators, named RSI and MACD, signal important market movements. Traders need to track these indicators to validate which direction the breakout will take. The upcoming trend phase in Cardano will most likely be determined by extended price movements that exceed triangle edges while showing indicator alignment and significant trading volume. The price action will likely continue to trade within a bound, as minor but short-term spikes appear occasionally.
Cardano Triangle Squeeze: Impending Volatility Ahead
Cardano price is now trading within a larger converging triangle that marked the day’s low at $0.6529. A breakout above this pattern could send the price back toward the $0.6900 resistance area. However, if the triangle breaks to the downside, the ADA price may fall to the $0.6400 ADA support zone. Momentum indicators like MACD and RSI are flashing mixed signals, highlighting ongoing indecision. Traders should wait for a clear breakout supported by volume before positioning. Until then, the asset is likely to remain range-bound, with fast intraday swings offering only tactical, short-term setups.
Cardano (ADA) Price Analysis of May 8, 2025
Cardano price began the session in a downward-moving channel, which broke out to the upside at 03:35 UTC, supported by a Golden Cross of MACD. After the Cardano breakout, the price moved higher and consolidated briefly before breaking down again. Despite this, the price reversed and formed an upward-moving channel, only to break down at 10:25 UTC as RSI signaled overbought conditions. Price action evolved into a converging triangle, which later broke to the downside, forming an expanding triangle and marking the low at $0.6550. The day was marked by failed follow-throughs, with volatility concentrated in short intraday swings.

Chart 5: ADA/USDT M5 Chart, Analysed by vallijat007, published on TradingView, May 8, 2025
Cardano price formed a downward-moving channel, breaking out to the upside at 03:35 UTC, following a golden crossover of the MACD. After the Cardano breakout, the price pushed up and initiated a small consolidation range. This range broke on the downside at 05:10 UTC when underpinned by a MACD crossover. But this breakout was not successful in maintaining the momentum, and similarly, the price rebounded in an upward-moving channel.
At 09:00 UTC, the RSI moved above the 70 level, signaling overbought conditions and suggesting that a pullback or short-term reversal was likely. As anticipated, the upward-moving channel broke to the downside at 10:25 UTC, supported by another MACD crossover. The price spiked lower and developed into a converging triangle pattern, signaling short-term consolidation amid uncertainty.
Cardano’s Pivotal Moment: Can Bulls Sustain the Rally or Will Bears Push Back?
By 13:20 UTC, RSI went below the 30 level, suggesting that the market had already been oversold and that there was either a reversal or at least a pullback. The converging triangle pattern later went to the downside, with a death crossover of the MACD as support. The Cardano price jumped to a low, which formed an expanding triangle pattern and hit the lowest level of the day at $0.6550.
Further on, the triangle went upward at 18:25 UTC with the support of a golden crossover in the MACD. This breakout, however, was unable to give rise to strong momentum for the price to rise again, and it turned down. Cardano then created a channel that was still moving upwards but broke out on the downside at 23:20 UTC, supported by a death crossover of the MACD. The downside breakout did not form a meaningful spike either, and the ADA price looks to settle in a small range.
The range exploded to the upside at 00:55 UTC on 8 May 2025, with the golden crossover of MACD in support. The price has surged sharply to the upside and is trading at approximately $0.7000. If the momentum of the buy continues, the ADA price can reach the $0.7500 barrier. Nevertheless, if the selling pressure resumes, Cardano may slide down to the $0.6500 support zone. Momentum indicators should be watched very carefully by traders to determine the next move.
Watch for Momentum Confirmation Near $0.7000
Cardano price is currently trading near $0.7000, following an upside breakout from a range at 00:55 UTC, backed by a Golden Cross of MACD. Although the price spiked higher, sustained momentum remains uncertain. If the breakout holds and buying pressure increases, the next target could be the $0.7500 resistance zone. Conversely, if momentum fades, Cardano could slide back toward the $0.6500 support level. The RSI and MACD remain critical for validating the direction of the next move. Until one of these levels is decisively breached with volume and indicator confirmation, Cardano is likely to remain range-bound in the short term.
Cardano (ADA) Price Analysis of May 12, 2025
Cardano token’s recent price action has been dominated by short-term reversals and a lack of sustained momentum, reflecting a broader environment of indecision. After reaching the day’s high, the price broke down from a range and later from an upward channel, both confirmed by MACD death crossovers and RSI dips into oversold territory. While these signals hinted at reversals, any bounce has been met with hesitation. A bullish breakout from a converging triangle provided a brief push higher, but the move lacked follow-through. The price has since settled into a tight range, reflecting weak momentum and low conviction from market participants.
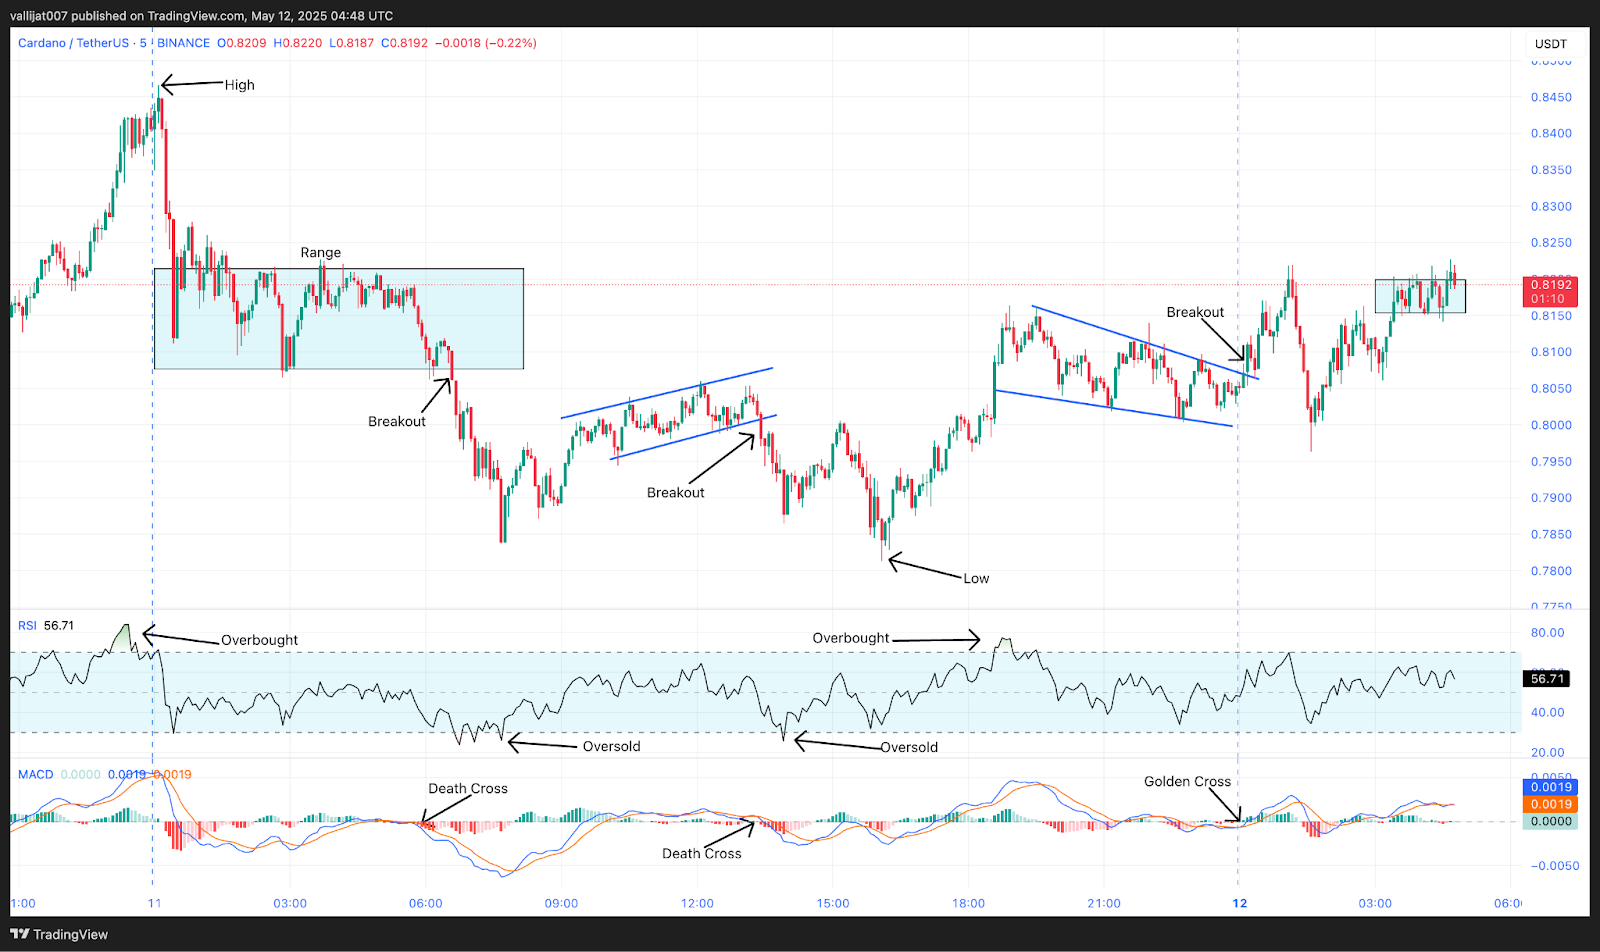
Chart 6: ADA/USDT M5 Chart, Analysed by vallijat007, published on TradingView, May 12, 2025
After marking a high for the day at $0.8466, the Cardano price dropped and formed a range. The range broke out to the downside at 06:35 UTC, supported by a death crossover of MACD. The Cardano price spiked to the downside, which pushed RSI below the level of 30, indicating oversold market conditions and suggesting a reversal or at least a pullback. The price then formed an upward moving channel, which again broke out to the downside at 13:25 UTC, supported by another death crossover of MACD. The price dropped further, marking the low for the day at $0.7813. In the meantime, at 13:55 UTC, RSI again dropped below 30, confirming oversold conditions and implying a possible reversal.
Triangle Breakout to $0.8215: Measured Move Achieved
After marking the low, the Cardano price spiked to the upside and formed a downward-facing converging triangle. The converging triangle broke out to the upside at 00:10 UTC, supported by a golden crossover of MACD. The price moved up to $0.8215, which aligns with the measured move based on the size of the triangle. A new range has now appeared in the price. If the range breaks out to the upside, the price may reach $0.8500. If the range breaks to the downside, it may drop to $0.7800.
The Cardano token is currently showing trading range behavior, with low volatility and weak momentum. The ADA price is moving sideways, and most breakout attempts fail to reach their targets. Traders and investors should be cautious before attempting breakout trades in Cardano due to this ranging behavior. A decisive move above $0.8500 or below $0.7800 with strong momentum may be required to establish a clear trend. Until then, Cardano is likely to remain in its consolidation phase.
So far, momentum signals from indicators such as MACD and RSI are still weak relative to a neutral market outlook. The poor trading volumes further mean that traders hesitate and await new information to fuel ADA price movements. Attention to critical breakout zones on the part of traders, as well as estimation of convergence between the pattern of price and the signal of the indicator, is very important for forecasting the direction of the next price movement. In the absence of direct confirmation, it may be reasonable to rely on range-trading strategies rather than make judgements between directional measures.
Sideways Stalemate: Cardano Price Stuck in Low-Volatility Market
Attempts by buyers and sellers to achieve control do not generate momentum. Market action stays sluggish, the sideways action prevailing with low levels of trading volumes and indicators hinting at no clear bias. The MACD and RSI indicators have provided little information thus far, with failed efforts to break out being a standard feature in the past. An upward breakout with heavy volume and confirmed through a convergence of indicators probably signals the onset of the next trend. Traders should continue sticking to strategies that adopt the neutral position until such distinct signals are thrown up.
Cardano (ADA) Price Analysis of May 14, 2025
Cardano’s latest session is currently manifesting an overwhelming bullish trend where most breakouts are significantly tilting to the upside and executing their projections. The price first came out of a bearish-moving expanding triangle with the support of a golden MACD crossover that caused a steep rise in its price. Once it carved through several ranges and channels, the Cardano token hit its daily top before it settled down to reverse trends. Being overbought, RSI situations indicated possible pullbacks. Despite the occasional dips, the structure is holding higher lows and constant buying pressure, thus showing market interest and bullish momentum behind the rally.
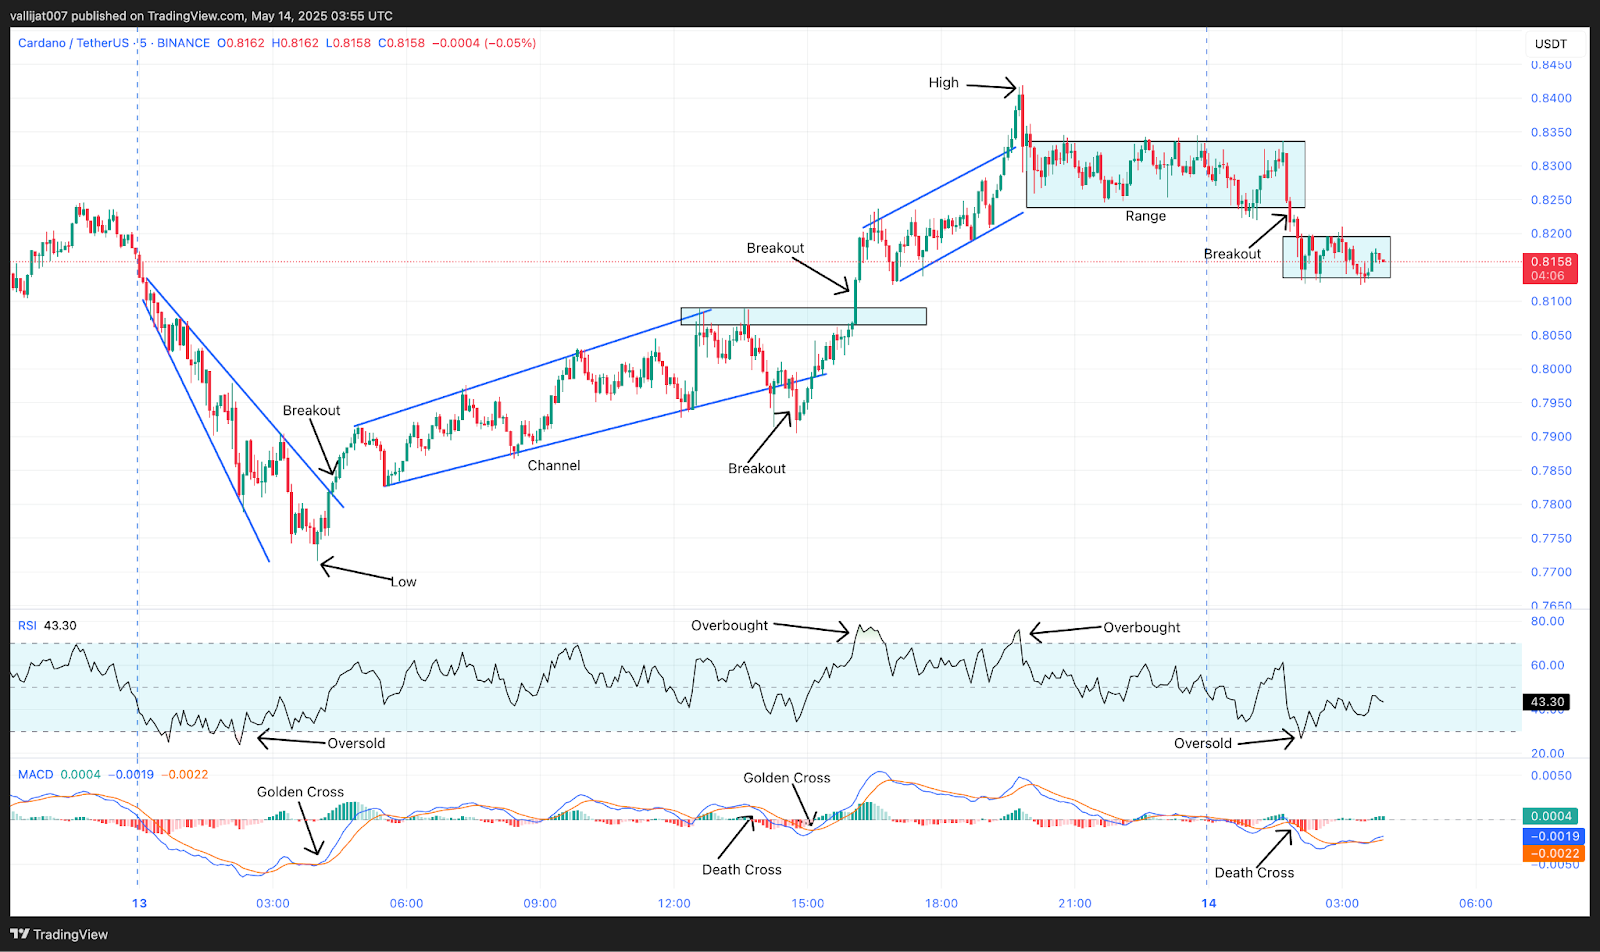
Chart 7: ADA/USDT M5 Chart, Analysed by vallijat007, published on TradingView, May 14, 2025
The Cardano token formed a downward-moving expanding triangle pattern, which marked the low for the day at $0.7716. The downward-moving expanding triangle broke out to the upside at 04:20 UTC, supported by a golden crossover of MACD. Price spiked to the upside and formed an upward-moving channel. The upward-moving channel broke to the downside at 14:40 UTC, supported by a death crossover of MACD, but the Cardano price soon reversed to the upside. Price formed a range at the level of $0.8070. The resistance level broke to the upside at 16:05 UTC, supported by a golden crossover of MACD.
Death Cross Triggers Drop: Can Bears Break $0.7700 Support?
Price spiked to the upside and formed an upward-moving channel, which marked the high for the day at $0.8417. In the meantime, at 16:10 UTC, RSI moved above the level of 70, indicating overbought market conditions, suggesting a reversal or at least a pullback. After marking the high for the day, the price formed a range. The range broke out to the downside at 01:50 UTC, supported by a death crossover of MACD. Price spiked to the downside and formed another range. In the meantime, at 02:05 UTC, RSI dropped below the level of 30, indicating oversold market conditions, suggesting a reversal or at least a pullback.
After the initial drop in the Cardano price, Cardano shows an upward-moving bias trend, with most of the breakouts happening to the upside and pushing the price to their target area. If the small range that is currently developing in ADA price breaks to the downside, then Cardano may drop to the level of $0.7700. If it breaks to the upside, then the ADA price may rise to the level of $0.8500. Currently, Cardano is trading at the level of $0.8150. Traders and investors should be cautious before placing any downward breakout trade, as Cardano shows bullish momentum.
Cardano Maintains Bullish Momentum Above Key Level
Cardano is still demonstrating a bullish bias, but upside breaches give a consistent increase in the Cardano price, and below are relatively weak pullbacks. The price action continues to be constructive as we see higher highs sustaining on positive momentum signals. Although RSI has shown overbought and oversold readings, those have mostly resulted in short-term pullbacks before quick rebounds that have supported trend momentum. Since the Cardano price is currently consolidating around support, the traders should pay attention to the breakout direction that will be confirmed. If there is a breakout in the range, then a continuation to recent highs is probable. However, any downside break is to be taken with caution since the wider structure is inclined to buyers.
Cardano (ADA) Price Analysis of May 19, 2025
Cardano’s price action over the session displayed a volatile mix of breakout attempts, most of which failed to follow through, reinforcing a broader consolidation with bearish bias. The session began with a bullish breakout from a range, pushing price into an upward channel, only to be checked by overbought RSI conditions. This set the tone for the day, as subsequent upside attempts were either short-lived or quickly reversed. Multiple MACD crossovers confirmed shifting sentiment, but none established lasting momentum. Cardano price continued cycling through patterns, channels, ranges, and triangles until it eventually marked a session low after repeated downside breakouts.
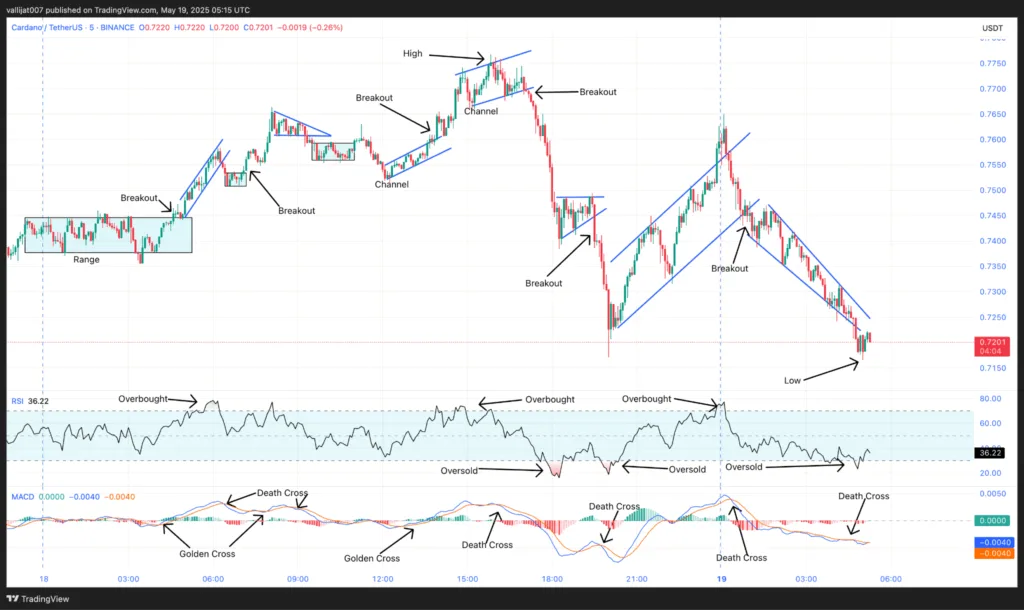
Chart 8: ADA/USDT M5 Chart, Analysed by vallijat007, published on TradingView, May 19, 2025
A range appeared in the Cardano price, which broke out to the upside at 04:35 UTC, supported by a golden crossover of MACD. Price spiked to the upside and formed an upward-moving channel. In the meantime, at 05:25 UTC, RSI moved above the level of 70, indicating overbought market conditions, suggesting a reversal or at least a pullback. The upward-moving channel broke out to the downside at 06:20 UTC, supported by a death crossover of MACD, but the price failed to form a downward trend.
Failed Rally to $0.7767: Death Cross Reasserts Bearish Control
Instead, the Cardano price formed a minor range that broke out to the upside at 07:10 UTC, supported by a golden crossover of MACD. Cardano price spiked to the upside and formed a converging triangle pattern. The converging triangle pattern broke out to the downside at 09:20 UTC, supported by a death crossover of MACD. Price failed to form a downward spike; instead, another range appeared in the price, which tried to break out to the upside, but the upside breakout failed.
An upward-moving channel appeared in the ADA price, which broke out to the upside at 13:55 UTC, supported by a golden crossover of MACD. Price spiked to the upside and formed another upward-moving channel, which marked the high for the day at $0.7767. The upward-moving channel broke out to the downside at 17:00 UTC, supported by a death crossover of MACD. Price spiked to the downside and formed a converging triangle pattern. The converging triangle pattern again broke out to the downside at 19:30 UTC, supported by a death crossover of MACD.
Price spiked to the downside to the level of $0.7175. In the meantime, at 19:50 UTC, RSI dropped below the level of 30, indicating overall market conditions suggesting at least a pullback. An upward-moving channel appeared in the ADA price, which broke out to the downside at 01:05 UTC on 19th May 2025, supported by a death crossover of MACD. The price dropped and formed a converging triangle pattern. The converging triangle pattern broke out to the downside at 04:45 UTC, supported by a death crossover of MACD. The Cardano price dropped to the downside, marking the low for the day at $0.7166.
Cardano Coin Weakens as Breakouts Lose Traction
Cardano price has steadily lost ground through a series of failed breakouts and declining highs, culminating in a fresh session low. While early bullish momentum sparked brief rallies, overbought RSI and weak follow-through revealed underlying market fatigue. Repeated breakdowns from converging triangle formations, each confirmed by MACD death crossovers, highlight bearish control. With RSI dipping into oversold territory and price unable to hold above support levels, the risk of further downside remains. Until strong momentum emerges or key levels are reclaimed, Cardano coin may remain under pressure or move sideways. Traders should approach cautiously, watching for volume-backed confirmation before acting on any breakout.
Cardano (ADA) Price Analysis of May 23, 2025
Cardano price action during the session was marked by a series of sharp swings, with the market bouncing between support and resistance levels but respecting technical signals closely. After establishing the session low at $0.8067, the price made multiple attempts to trend upward, each time facing breakdowns from trendlines and channels, though none succeeded in breaching the established support near $0.8075. Despite several death crossovers of MACD, downside moves lacked follow-through, while golden crossovers supported brief upward spikes. Overbought and oversold RSI conditions added to the choppy but technically reactive behavior, culminating in a range breakout attempt near session end.

Chart 9: ADA/USDT M1 Chart, Analysed by vallijat007, published on TradingView, May 23, 2025
Cardano price marked the low for the day at $0.8067 and moved to the upside. An upward-moving trendline appeared in the price, which broke out to the downside at 00:28 UTC, supported by a death crossover of MACD. Price spiked to the downside but failed to break its previous low, creating a support area at the level of $0.8075. Price again rose to the upside and another upward moving trendline appeared in the price, which broke out to the downside at 01:04 UTC, supported by a death crossover of MACD. But price again failed to break its support level and rose to the upside, followed by an upward-moving channel.
GoldenCross Breakout Tests 0.8414 Resistance
The upward-moving channel broke out to the downside at 01:41 UTC, supported by a death crossover of MACD, but the Cardano price failed to have follow-through. Instead, a range appeared in the price. The range broke out to the upside at 02:05 UTC, supported by a golden crossover of MACD. Price spiked to the upside and formed a converging triangle pattern. In the meantime, at 02:15 UTC, RSI moved above the level of 70, indicating overbought market conditions, suggesting a reversal or at least a pullback.
The converging triangle pattern with a support level at $0.8250 broke out to the upside at 03:39 UTC, supported by a golden crossover of MACD. Cardano price spiked to the upside, followed by an upward-moving channel. The upward-moving channel marked the high for the day at $0.8414. The upward-moving channel broke out to the downside at 04:05 UTC, supported by a death crossover of MACD. ADA price spiked to the downside and formed a downward-moving channel.
In the meantime, at 04:20 UTC, RSI dropped below the level of 30, indicating overall market conditions suggesting a reversal or at least a pullback. That downward-moving channel broke out to the upside at 04:27 UTC, supported by a golden crossover of MACD, but the price failed to have follow-through. Instead, a range formed in the ADA price. The range broke out to the upside at 04:45 UTC, supported by a golden crossover of MACD. If the breakout succeeds, then the price may rise to the level of $0.8500. If the breakout from the range fails, then the price may drop to the level of $0.8000.
Cardano Token Caught Between Breakout and Reversal
Cardano token showcased resilience, with strong buying at key support levels and repeated bouncebacks despite downside breakouts. Although the Cardano price action was turbulent, the bullish bias remained intact as upward structures outnumbered successful bearish breakdowns. With the most recent range breaking to the upside on a golden MACD crossover, buyers are again testing momentum. If follow-through holds, price may climb toward the $0.8500 mark. However, failure at this level could trigger a pullback toward $0.8000 support. The traders should watch for volume and momentum to validate the next move.
Cardano (ADA) Price Analysis June 2, 2025
Cardano price opened the session exhibiting bullish momentum as a downward-moving channel broke to the upside, initiating a sequence of upward movements that marked the high for the day at $0.6898. This early strength was confirmed by a golden crossover of MACD and led to the formation of a triangle, which also broke to the upside, pushing the Cardano price to a session high. However, the rally was quickly checked as the RSI signaled overbought conditions, prompting a reversal. What followed was a series of alternating breakout attempts, both bullish and bearish, with most failing to sustain direction. Cardano trend fluctuated through channels, ranges, and triangles and dropped to the day’s low of $0.6741. Currently, the ADA price is trading at 0.6787.

Chart 10: ADA/USDT M1 Chart, Analysed by vallijat007, published on TradingView, June 2, 2025
Cardano price formed a downward moving channel, which broke out to the upside at 00:38 UTC, supported by a golden crossover of MACD, and formed a converging triangle. The converging triangle broke out to the upside at 00:57 UTC, supported by a golden crossover of MACD, marking the high for the day at $0.6898. In the meantime, at 01:10 UTC, RSI moved above the level of 70, indicating overbought market conditions, suggesting a reversal or at least a pullback.
Golden Cross Breakout Faces Overbought Rejection
After marking the high, the ADA price formed a range that broke out to the downside at 01:25 UTC, supported by a death crossover of the MACD. In the meantime, at 01:30 UTC, RSI dropped below the level of 30, indicating oversold market conditions, suggesting a reversal or at least a pullback. The range broke out to the downside at 02:11 UTC, supported by a death crossover of MACD, and formed an upward-moving channel.
The upward-moving channel broke out to the downside at 02:47 UTC, supported by a death crossover of MACD, and formed a downward-moving channel, which marked the low for the day at $0.6741. The downward-moving channel broke out to the upside at 03:24 UTC, supported by a golden crossover of MACD, and formed a range. The range broke out to the upside at 03:40 UTC, supported by a golden crossover of MACD, and formed a downward-moving channel. The downward-moving channel broke out to the upside at 04:00 UTC, supported by a golden crossover of MACD, and formed a converging triangle pattern.
In the meantime, at 04:17 UTC, RSI moved above the level of 70, indicating overbought market conditions, suggesting a reversal or at least a pullback. The converging triangle pattern broke out to the downside at 04:50 UTC, supported by a death crossover of MACD, and formed a range. The range broke out to the upside at 05:05 UTC, supported by a golden crossover of MACD. If the breakout succeeds, then the price may rise to the level of $0.70; if the breakout fails, then the ADA price may fall to the level of $0.67.
Sideways Action Signals Trader Caution
The Cardano price showed a volatile but indecisive pattern throughout the session. Although early bullish signals took the Cardano trend to its peak, overbought RSI readings and repeated MACD death crossovers ushered in a series of pullbacks. The absence of follow-through in both directions points up a consolidating market where traders are responding to technical signals without dedicating themselves to continuous trends. Traders should be wary and wait for a clear breakout before entering trend-based positions as ADA moves between the $0.67 and $0.70 thresholds.
Cardano (ADA) Price Analysis June 5, 2025
Cardano price started the session in a tight range, establishing the day’s low at $0.6654. A golden MACD crossover triggered an upside breakout, but the rally quickly transitioned into a downward-moving channel. As RSI crossed into overbought territory, signs of a pullback emerged. Despite short-lived bearish patterns, bullish momentum pushed ADA into multiple converging triangle patterns, with each breakout supported by golden MACD signals. The uptrend peaked with the day’s high at $0.6811 before another pullback set in. Throughout the session, Cardano exhibited strong price structure and resilience, backed by repeated bullish technical confirmations. Currently, Cardano token is trading at $0.6770
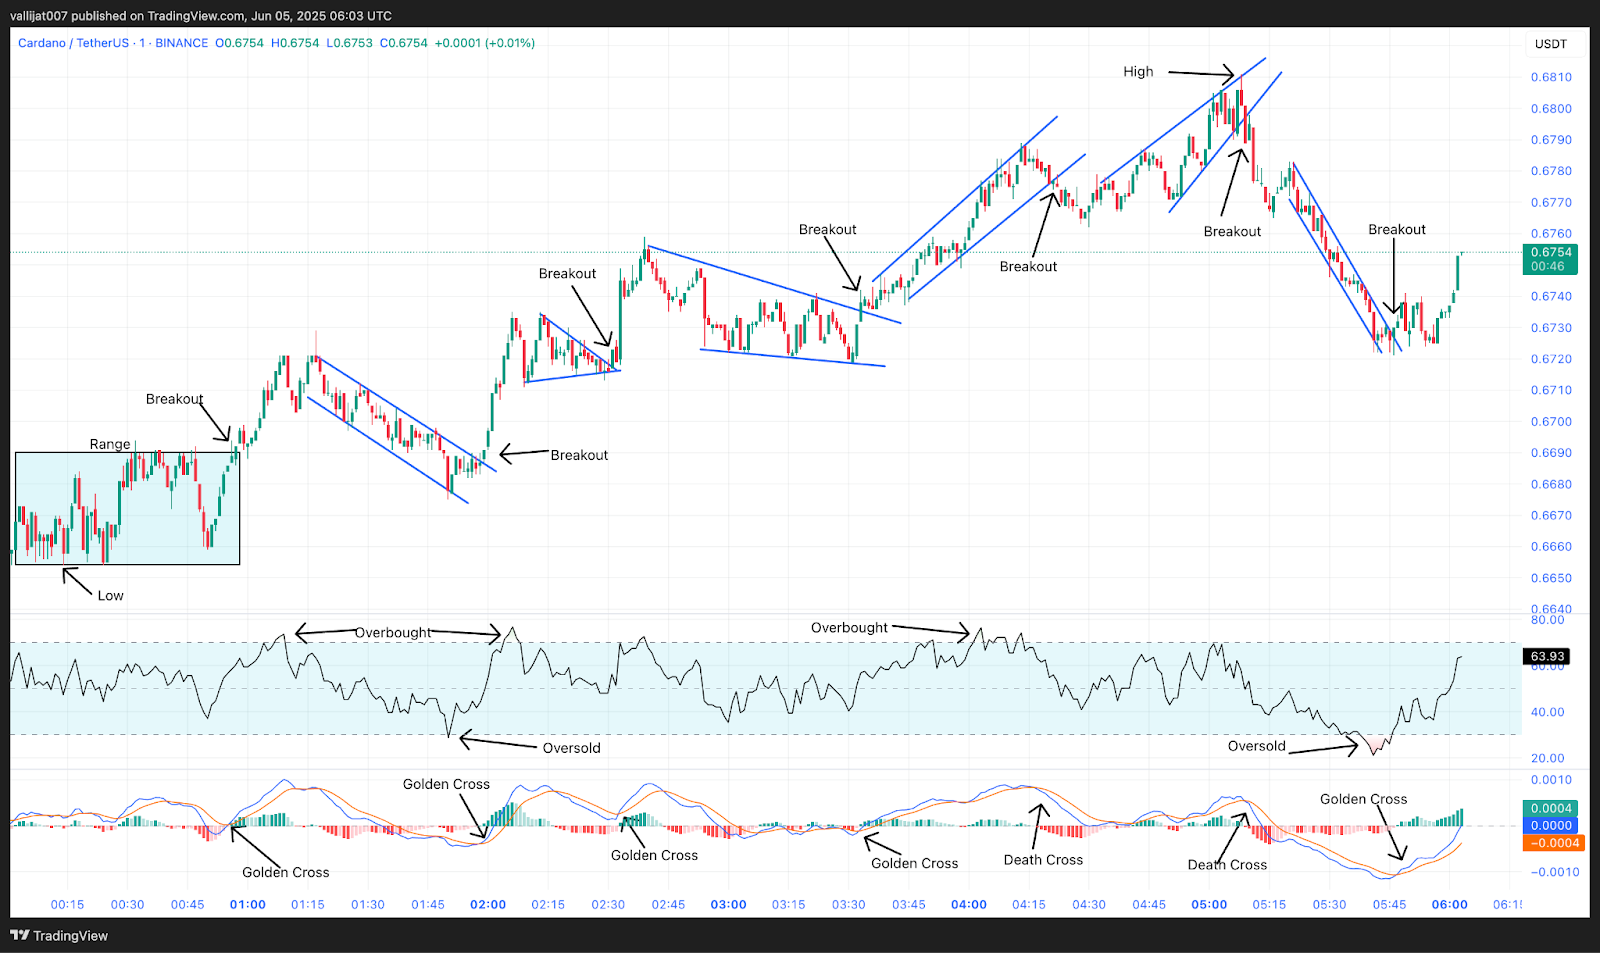
Chart 11: ADA/USDT M1 Chart, Analysed by vallijat007, published on TradingView, June 5, 2025
Cardano price formed a range, which marked the low for the day at $0.6654. The range broke out to the upside at 00:57 UTC, supported by a golden crossover of MACD, and formed a downward-moving channel. In the meantime, at 01:10 UTC, the RSI moved above the level of 70, indicating an overbought market condition and suggesting a reversal or at least a pullback.
From Oversold to Recovery, ADA’s Battle Between Bullish and Bearish Signals
The downward-moving channel broke out to the upside at 01:59 UTC, supported by a golden crossover of MACD, and formed a converging triangle pattern. The converging triangle pattern broke out to the upside. The price moved back to the upside and formed another converging triangle pattern. This second pattern broke out to the upside at 03:33 UTC, supported by a golden crossover of MACD, and formed an upward-moving channel.
An upward-moving channel broke out to the downside at 04:22 UTC, supported by a death crossover of MACD. However, the downside breakout faded, and the price rose again, forming a converging triangle pattern. This converging triangle pattern marked the high for the day at $0.6811. It then broke out to the downside at 05:09 UTC, supported by a death crossover of the MACD. The ADA price spiked to the downside and formed a downward-moving channel.
At 05:40 UTC, the RSI dropped below 30, indicating an oversold market condition, suggesting a reversal or at least a pullback. The downward-moving channel broke out to the upside at 05:47 UTC, supported by a golden crossover of MACD. If the upside breakout succeeds, then the price may rise to the level of $0.7000. If the breakout fails, the price may drop to $0.6600. Currently, the Cardano price is in a strong uptrend, and traders and investors should be cautious before placing a downward breakout trade.
Uptrend Holds but Signals Mixed in the Cardano Token
Cardano price displayed a steady upward bias, with breakouts repeatedly forming and succeeding across several technical patterns. While pullbacks occurred, especially following overbought RSI readings, they were quickly countered by bullish momentum and MACD golden crossovers. The market established a clear upward rhythm, though sharp corrections created short-term uncertainty. A failed breakout at $0.6811 brought the ADA price lower into a downward channel, but this too reversed quickly. If the current upside breakout continues, ADA may target $0.7000. However, a failed move could pull it back to $0.6600. Traders should remain cautious, particularly against entering short positions during ongoing trend strength.
Cardano (ADA) Price Analysis June 6, 2025
Cardano coin opened the session with a low at $0.6210 and quickly began reversing as it broke above a downward trendline, supported by bullish MACD signals. Momentum carried the price through a series of bullish patterns, including an upward moving channel, a converging triangle, and multiple ranges, each confirming golden crossovers of MACD. RSI signaled both oversold and overbought conditions during the session, reflecting volatility. The high of the day was marked at $0.6412 as price action maintained a strong upward bias. As of the last breakout, ADA remains in a bullish setup, hinting at the potential for further upside. Currently, Cardano price is trading at $0.6400.
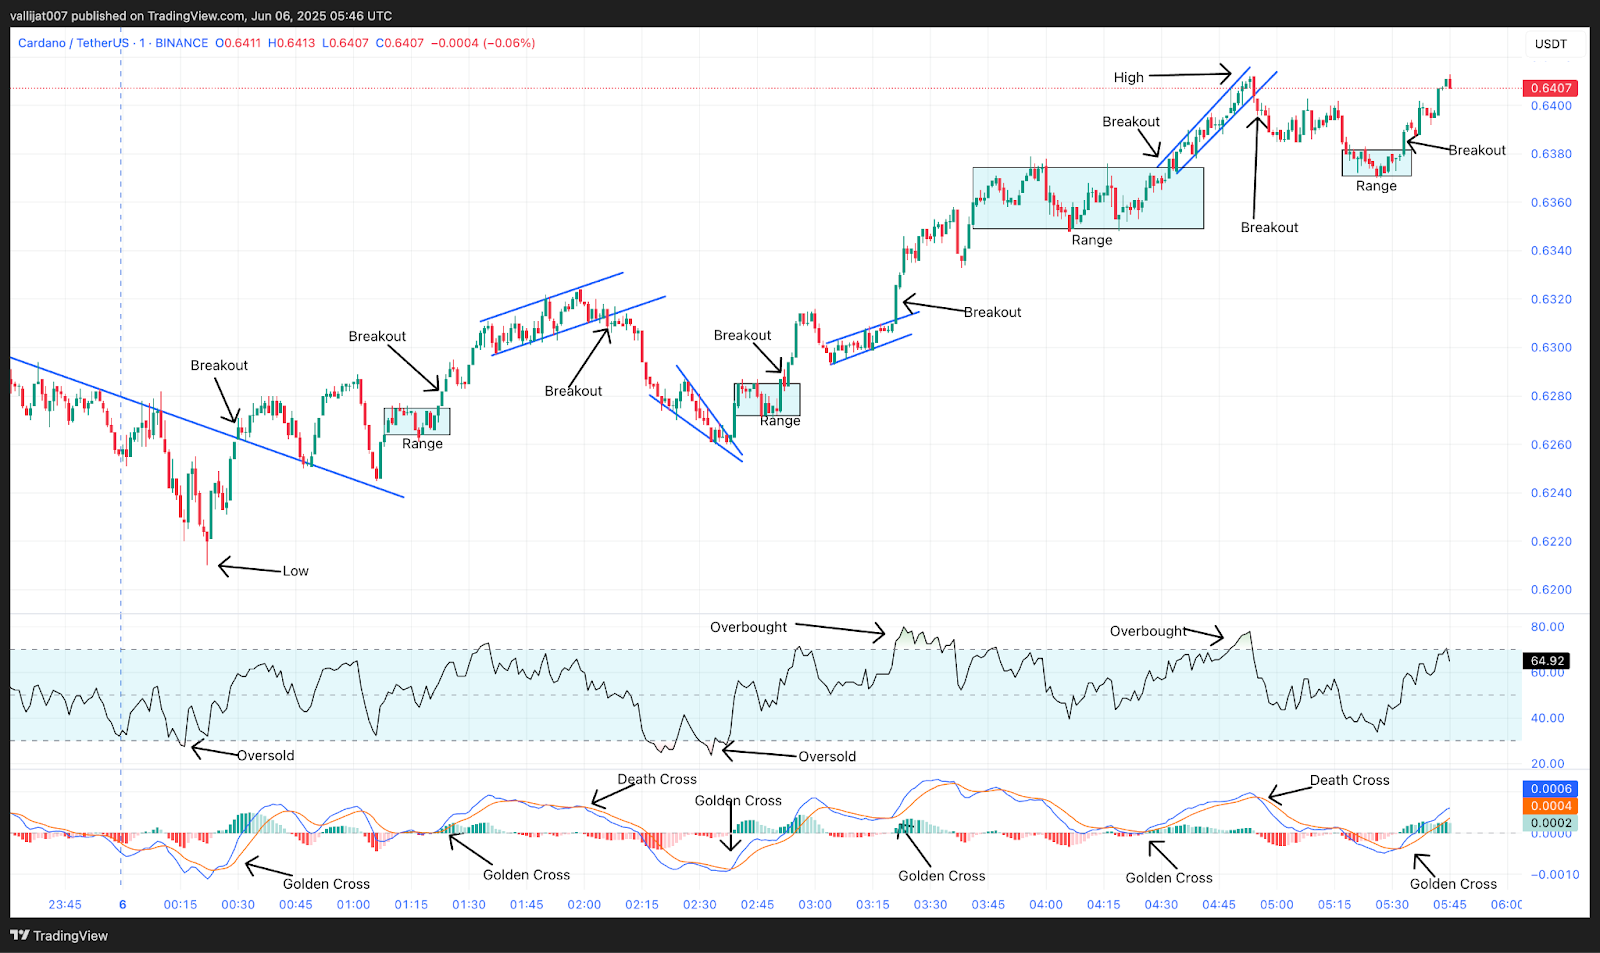
Chart 12: ADA/USDT M1 Chart, Analysed by vallijat007, published on TradingView, June 6, 2025
Cardano price marked the low for the day at $0.6210 and formed a downward moving trendline. The trendline broke out to the upside at 00:30 UTC, supported by a golden crossover of MACD, as the price moved upward and formed a range. The range broke out to the upside at 01:23 UTC, supported by a golden crossover of MACD, and formed an upward-moving channel. The channel broke out to the downside at 02:06 UTC, supported by a death crossover of MACD, and led to the formation of a converging triangle pattern.
ADA’s Bullish Surge: Repeated Golden Crosses Drive Price Higher
At 02:20 UTC, the RSI dropped below 30, indicating oversold market conditions, suggesting a reversal or at least a pullback. The converging triangle pattern broke out to the upside at 02:39 UTC, supported by a golden crossover of MACD, and formed a range. The range broke out to the upside at 02:53 UTC, supported by a golden crossover of MACD, and formed an upward-moving channel.
This channel broke out upward once more at 03:21 UTC, backed by yet another MACD golden crossover, then followed by a range. The RSI rose over 70 at 03:25 UTC, pointing to overbought circumstances and possibly a reversal or pullback. Supported by a MACD golden crossover, the range broke out to the upside at 04:32 UTC and created another channel going upward, marking the day’s high at $0.6412.
The channel broke out to the downside at 04:55 UTC, supported by a death crossover of MACD, and formed a range. The range broke out to the upside at 05:34 UTC, supported by a golden crossover of MACD. If the breakout succeeds, the ADA price may mark another high and rise toward $0.6600. If the breakout fails, the price may drop to the $0.6100 level. Traders and investors should be cautious before placing any downside breakout trades, as Cardano coin currently shows bullish momentum.
Bullish Momentum Intact, But Watch Overbought Signals
With regular golden crossovers and upward breakouts across technical patterns, the Cardano price continues to demonstrate strong bullish momentum. Although this upward trend could drive the ADA price toward the $0.6600 level, traders should be mindful of the numerous RSI overbought indications, which suggest the possibility of near-term corrections. On the other hand, a decline toward $0.6100 remains conceivable if the current breakout fails. Although the market’s recent instability calls for strict risk management, the trend remains positive overall. Investors should watch for a confirmed follow-through above the resistance level before initiating long trades.
Cardano (ADA) Price Analysis of June 9, 2025
The Cardano price started the trading day by forming an expanding triangle pattern, which marked the high at $0.6719. However, early bullish momentum quickly reversed as multiple death crossovers on the MACD guided price action lower. Repeated failures to break key resistance at $0.6695 and a declining RSI led to a series of lower breakdowns, forming converging triangles and ranges. As the RSI repeatedly dipped below 30, conditions indicated consistent oversold pressure. Despite intermittent recoveries and golden MACD crossovers, the Cardano trend remained bearish. Eventually, Cardano formed a downward-moving channel, hitting its low for the day at $0.6569 before showing signs of stabilization. Currently, the ADA price is trading at $0.6600.
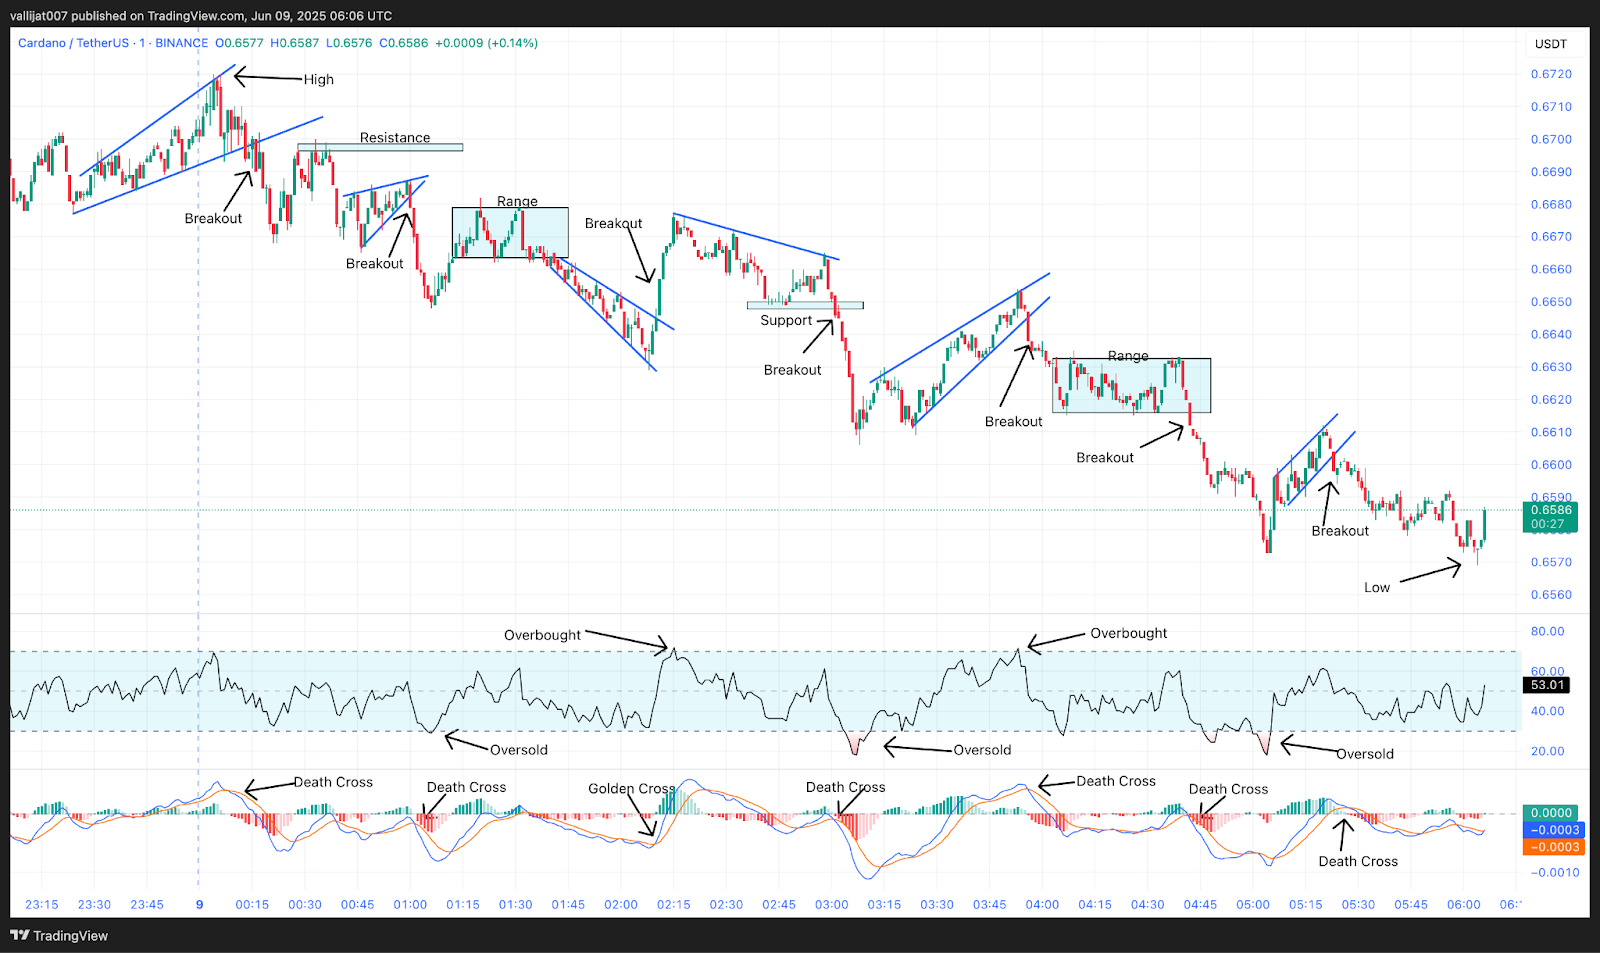
Chart 13: ADA/USDT M1 Chart, Analysed by vallijat007, published on TradingView, June 9, 2025
The Cardano price formed an expanding triangle pattern, which marked the high for the day at $0.6719. The expanding triangle pattern broke out to the downside at 00:16 UTC, supported by a death crossover of MACD, with Cardano trend moving to the downside and forming a resistance area at $0.6695. As the price was unable to break the resistance area, it developed a converging triangle pattern. The converging triangle broke out to the downside at 01:00 UTC, supported by a death crossover of MACD, and the Cardano price formed a range. At 01:05 UTC, RSI dropped below 30, indicating oversold market conditions and suggesting a reversal or at least a pullback.
Channel Breakouts and Reversals Define ADA Price Movement
The range broke out to the downside at 01:40 UTC, supported by a death crossover of MACD, and formed an expanding triangle pattern. The expanding triangle broke out to the upside at 02:11 UTC, supported by a golden crossover of MACD, pushing RSI above 70, which also suggested a reversal or at least a pullback. The Cardano price then followed a downward-moving trendline. As it was unable to break this trendline, a support area at $0.6650 developed.
Supported by a MACD crossover, the supporting region fell to the downside at 03:00 UTC and created an upward-trending convergent triangle pattern. RSI fell below 30 at 03:05 UTC, once more implying oversold market conditions and pointing to a reversal or at least a pullback. Supported by a MACD death crossover, the converging triangle broke to the downside at 03:56 UTC and established a range.
At 04:42 UTC, the range broke out to the downside, backed by yet another MACD crossover, which created an upward-moving channel. RSI once more dipped below 30 at 05:05 UTC, indicating oversold situations and maybe a reversal or pullback. Supported by a MACD death cross, the rising channel then broke out to the downside at 05:23 UTC, therefore establishing the low for the day at $0.6569.
ADA Struggles Between $0.6719 High and $0.6569 Low
Cardano price action highlighted persistent bearish pressure, with most upside moves failing to gain traction. The high of $0.6719 was quickly rejected, and MACD death crossovers consistently signaled downward momentum. Multiple dips in RSI below 30 confirmed oversold conditions, suggesting the market struggled to find a firm bullish footing. After reaching the day’s low at $0.6569, buyers appeared cautiously, though no strong trend reversal was confirmed. If the ADA price breaks below the low, it may target the $0.6500 level. Conversely, a push above the day’s high could open the door to a move toward $0.6800. Caution is advised.
Cardano (ADA) Price Analysis of June 14, 2025
Cardano price opened the session trading within a narrow range, which marked the high for the day at $0.6660. The early breakout to the downside set a bearish tone, and a series of price structures, including ranges, channels, and triangle patterns, reflected the market’s struggle to sustain directional momentum. The low for the day was recorded at $0.6174 following oversold RSI conditions, which suggested possible reversals, but upside moves repeatedly lost steam. Throughout the session, MACD crossovers accompanied nearly every structural shift, yet most breakouts failed to follow through decisively, keeping ADA trapped in a volatile yet indecisive trading zone.
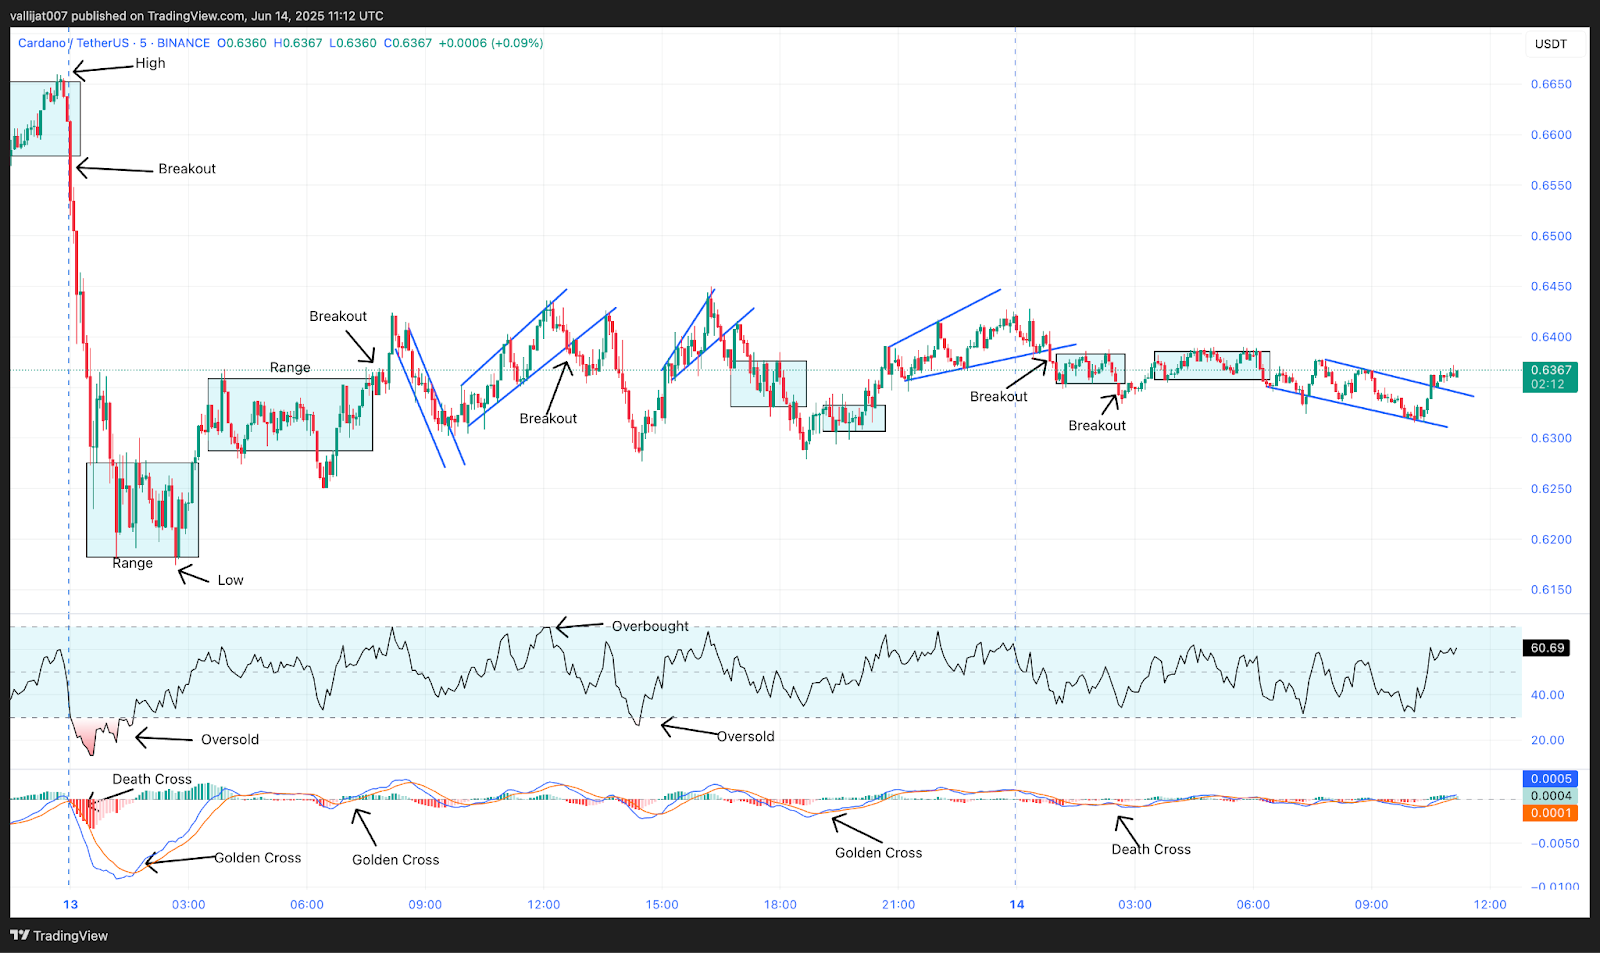
Chart 14: ADA/USDT M5 Chart, Analysed by vallijat007, published on TradingView, June 14, 2025
Cardano price formed a range, which marked the high for the day at $0.6660. The range broke out to the downside at 00:00 UTC, supported by a death crossover of the MACD and ADA price spike to the downside, and formed another range. At 00:25 UTC, RSI dropped below the level of 30, indicating oversold market conditions, suggesting a reversal or at least a pullback. The range marked the low for the day at $0.6174. The range broke out to the upside at 03:15 UTC, supported by a gold crossover of the MACD price spike to the upside, and formed another range.
Failed Upside Breakout at 08:05 UTC Leads to Channel Reversal
The range broke out to the upside at 08:05 UTC, supported by a golden crossover of the MACD price back to the upside, but the upside momentum soon faded, and the ADA price formed a downward-moving channel. The downward-moving channel broke out to the upside at 09:55 UTC, supported by a golden crossover of the MACD price spike to the upside, and formed an upward-moving channel. The upward-moving channel broke out to the downside at 12:40 UTC, supported by a death crossover of the MACD price spike to the downside. At 14:25 UTC, RSI dropped below the level of 30, indicating oversold market conditions, suggesting a reversal or at least a pullback.
Final Channel Structure Emerges Following 06:15 UTC Breakdown
Price formed an expanding triangle pattern. The expanding triangle pattern broke out to the downside at 16:30 UTC, supported by a death crossover of the MACD, a Cardano price spike to the downside, and formed a range. The range broke out to the downside at 18:15 UTC, supported by a death crossover of the MACD price spike to the downside, and another range developed. The range broke out to the upside at 20:10 UTC, supported by a gold crossover of the MACD price spike to the upside, and formed an expanding triangle pattern. The expanding triangle pattern broke out to the downside at 00:50 UTC on 14th June 2025.
Supported by a death crossover of the MACD Cardano trend spike to the downside, and formed a range. The range broke out to the downside at 02:35 UTC, supported by a death crossover of MACD, but the downside breakout failed, and the price rose to the upside, developing another range. The second range again broke out to the downside at 06:15 UTC, supported by a death crossover of the MACD Cardano trend spike to the downside, and formed a downward-moving channel. If the channel breaks out to the upside, then it may rise to the level of $0.6900. If the channel breaks out to the downside, then it may drop to the level of $0.6000.
$0.6660 High to $0.6174 Low: Cardano Stalls Amid Repeated Failed Breakouts
Cardano price action on June 13 into early June 14 showed clear signs of exhaustion and uncertainty. Despite multiple MACD-driven breakouts and oversold RSI signals, ADA remained caught in whipsaw movements. Upside attempts, particularly the one at 08:05 UTC, quickly reversed, while downside breakouts often lacked conviction. The final structure to emerge was a downward-moving channel after repeated failures to establish a trend through expanding triangles and range consolidations. If this channel breaks to the upside, ADA may attempt a move toward $0.6900. Conversely, if bearish momentum returns, the price could test support at $0.6000. Traders should watch for confirmation before acting on any breakout.
Cardano (ADA) Price Analysis of June 22, 2025
Beginning its trading day, Cardano formed an upward-moving channel; strong buying pressure propelled the price to the session high of $0. 5882. The early bullish move set off an RSI reading over 70, signifying overbought conditions and foreshadowing a possible pullback. As anticipated, the upward channel fractured at 02:10 UTC, thereby initiating a series of falling patterns and rejected upside efforts. A series of ranges and triangle formations followed, indicating increasing uncertainty. The Cardano price eventually slipped to the day’s low of $0.5443, highlighting growing bearish sentiment across the session.
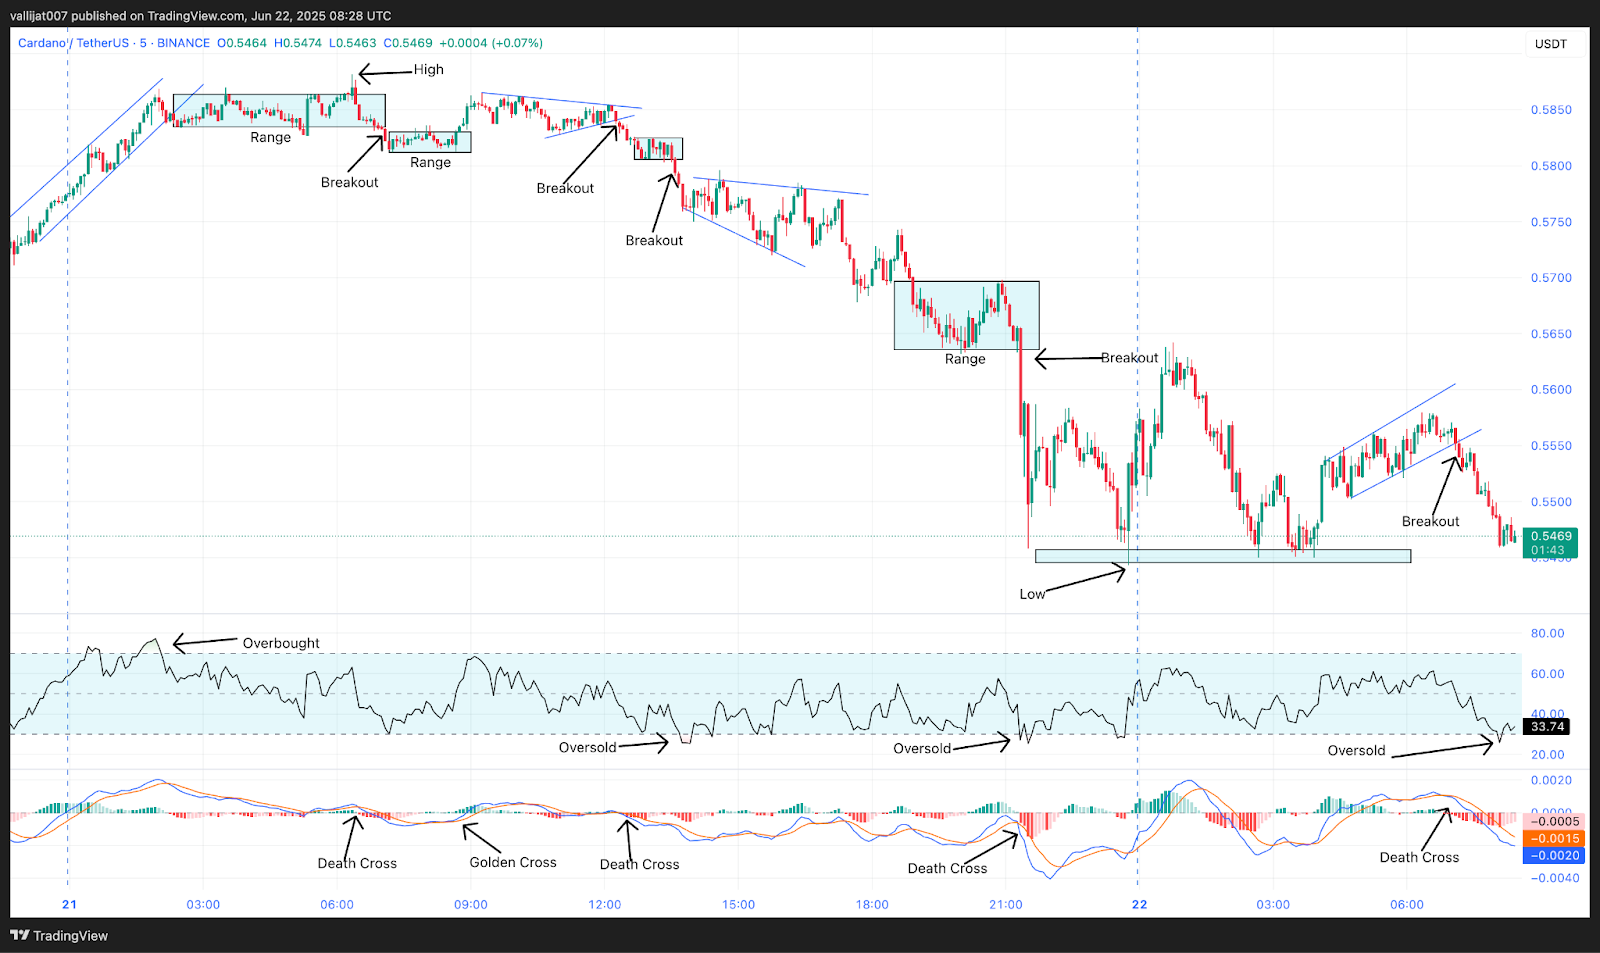
Chart 15: ADA/USDT M5 Chart, Analysed by vallijat007, published on TradingView, June 22, 2025
Cardano price formed an upward moving channel, which pushed the RSI above the level of 70, indicating overbought market conditions, suggesting a reversal or at least a pullback. The upward-moving channel broke out to the downside at 02:10 UTC, supported by a death crossover of MACD. Price failed to form a spike; instead, a range followed. The range marked the high for the day at $0.5882. The range broke out to the downside at 07:05 UTC, supported by a death crossover of MACD, and formed another range. The range broke out to the upside at 08:45 UTC, supported by a golden crossover of MACD, and formed a converging triangle pattern.
Support Area Forms at $0.5460 During Late Session
The converging triangle pattern broke out to the downside at 12:15 UTC, supported by a death crossover of MACD, and another range followed. The range broke out to the downside at 13:35 UTC, supported by a death crossover of MACD, and formed an expanding triangle pattern. At 13:50 UTC, RSI dropped below the level of 30, indicating oversold market conditions, suggesting a reversal or at least a pullback.
The expanding triangle pattern failed to break out to either side, and the Cardano trend developed into a range. The range broke out to the downside at 21:20 UTC, supported by a death crossover of MACD, marking the low for the day at $0.5443. The Cardano trend formed a support area at the level of $0.5460. At 21:35 UTC, RSI again dropped below the level of 30, indicating market conditions suggesting a reversal or at least a pullback.
An upward-moving channel appeared. The upward-moving channel broke out to the downside at 07:10 UTC on 22 June 2025, supported by a death crossover of MACD. If the breakout succeeds, then the ADA price may fall to the level of $0.5100. If the breakout fails, then the ADA price may rise to the level of $0.5800. Traders and investors should be cautious before placing an upward breakout trade, as the Cardano price shows bearish momentum.
$0.5460 Support Under Pressure as Bearish Momentum Builds
After marking a low at $0.5443, Cardano established a short-term support zone at $0.5460. However, repeated breakdowns backed by MACD death crossovers and oversold RSI readings suggest that this support may not hold for long. A new upward-moving channel emerged but broke down again by 07:10 UTC on June 22, supported by bearish momentum. If the current breakout to the downside succeeds, the Cardano price could fall toward the $0.5100 level. On the other hand, a failed breakdown might push ADA back up toward $0.5800. Traders should remain cautious, as the prevailing pattern reflects weak buyer conviction and a bias toward lower levels.
Cardano (ADA) Price Analysis of June 27, 2025
Cardano price action began with an upward-moving channel, showing early bullish strength. However, the upward-moving channel broke to the downside at 01:05 UTC, though the breakout failed to hold. Price rebounded and spiked higher, forming a range that broke to the upside at 02:50 UTC, supported by a golden MACD crossover. This rally pushed ADA to the high of the day at $0.5819. Shortly after, RSI exceeded 70 at 03:00 UTC, signaling overbought conditions and setting the stage for a bearish correction. Currently, Cardano price is trading at $0.5550.

Chart 16: ADA/USDT M5 Chart, Analysed by vallijat007, published on TradingView, June 27, 2025
Cardano price formed an upward-moving channel. The upward-moving channel broke out to the downside at 01:05 UTC, supported by a death crossover of MACD, but the downside breakout failed, and the Cardano trend rose to the upside and formed a range. The range broke out to the upside at 02:50 UTC, supported by a golden crossover of MACD, with Cardano trend spiking to the upside, marking the high for the day at $0.5819. At 03:00 UTC, RSI moved above the level of 70, indicating overbought market conditions, suggesting a reversal or at least a pullback.
Expanding Triangle Breakdown at 08:25 UTC Initiates Range Formation
Following marking the high for the day, the ADA price fell to the downside and created a downward-moving channel. Backed by a golden crossover of MACD, the downward-moving channel broke out to the upside at 05:55 UTC to create an expanding triangle pattern. Supported by a death crossover of MACD, the expanding triangle pattern broke out to the downside at 08:25 UTC, and a range arose. RSI fell under the 30 level at 09:10 UTC, signaling oversold market conditions and implying a turnaround or at least a correction.
Daily Low Established at $0.5488 Following Bearish Breakout
The range broke out to the downside at 12:00 UTC, supported by a death crossover of MACD, and formed another expanding triangle pattern. At 13:10 UTC, RSI dropped below the level of 30, indicating overall market conditionssuggesting a reversal or at least a pullback. The expanding triangle pattern broke out to the upside at 14:25 UTC, supported by a golden crossover of MACD, and formed a downward-moving trendline.
The trendline broke out to the upside at 17:00 UTC, supported by a golden crossover of MACD, and formed an expanding triangle pattern. The expanding triangle pattern broke out to the downside at 21:10 UTC, supported by a death crossover of MACD, marking the low for the day at $0.5488. After marking the low, the ADA price rose to the upside and formed another expanding triangle pattern. The expanding triangle pattern broke out to the downside at 04:15 UTC on 27th June 2025, supported by a death crossover of MACD.
$0.5488 Low Highlights Post-Rally Reversal in ADA
After hitting the day’s high, Cardano price entered a sequence of corrective structures. A breakout from a downward channel led to an expanding triangle, which failed at 08:25 UTC, initiating a consolidation phase. With back-to-back RSI dips below 30 at 09:10 and 13:10 UTC and repeated MACD death crossovers, bearish sentiment intensified. ADA marked its session low at $0.5488 following a breakdown at 21:10 UTC. Although brief rebounds emerged, they lacked strength, and another bearish breakout occurred at 04:15 UTC the following day. As Cardano hovers near support, the $0.5480–$0.5820 range will be critical for defining the next directional move.
Cardano (ADA) Price Analysis of July 7, 2025
Cardano price traded within a highly volatile technical setup, marked by a series of converging triangle breakouts and rapid directional shifts. The price began consolidating within triangle patterns, repeatedly breaking to the upside with MACD support, only to lose momentum soon after. The day’s high was recorded at $0.5947 following a failed bullish continuation, while the low occurred during a brief sell climax that quickly reversed. RSI frequently crossed key levels, flagging both overbought and oversold zones, reflecting an indecisive market. Overall, Cardano’s price behavior showed volatility amid frequent trend changes without strong directional conviction.

Chart 17: ADA/USDT M5 Chart, Analysed by vallijat007, published on TradingView, July 7, 2025
The Cardano price formed a converging triangle pattern, which broke out to the upside at 03:50 UTC, supported by a golden crossover of MACD. Price spiked to the upside and formed another converging triangle pattern. At 04:00 UTC, RSI was above the level of 70, indicating overbought market conditions, suggesting a reversal or at least a pullback. The second converging triangle pattern again broke out to the upside at 06:10 UTC, supported by a golden crossover of MACD. Price spiked to the upside, but the breakout failed, and price formed another converging triangle pattern.
Daily High Established at $0.5947 After Overnight Breakout
The third converging triangle pattern again broke out to the upside at 08:35 UTC, supported by a golden crossover of MACD. Price spiked to the upside, and a range developed. The range broke out to the upside at 10:25 UTC, supported by a golden crossover of MACD, and price again formed a converging triangle pattern. The converging triangle pattern again broke out to the upside at 12:20 UTC, supported by a golden crossover of MACD, and a range developed. The range broke out to the upside at 13:20 UTC, supported by a golden crossover of MACD.
Price spiked to the upside, but the momentum was not strong, and Cardano price dropped to the downside, forming an upward-moving channel. At 13:45 UTC, RSI was above the level of 70, indicating overbought market conditions, suggesting a reversal or at least a pullback. The upward-moving channel broke out to the downside at 17:10 UTC, supported by a death crossover of MACD. Price spiked to the downside but formed a sell climax, and price saw a safe recovery, rising to the upside to form an expanding triangle pattern.
At 18:45 UTC, RSI dropped below the level of 30, indicating oversold market conditions, suggesting a reversal or at least a pullback. The expanding triangle pattern broke out to the downside at 23:00 UTC, supported by a death crossover of MACD. Cardano price spiked to the downside, and a range followed. The range broke out to the upside at 02:00 UTC on 7th July 2025, supported by a golden crossover of MACD. Price spiked to the upside, and another expanding triangle pattern formed, marking the high for the day at $0.5947.
Cardano Shows Weak Breakout Follow-Through Between $0.5947 and Support Zones
The Cardano price intraday movement was dominated by converging and expanding triangle formations, with multiple golden crossovers on MACD driving initial bullish setups. However, most breakouts lacked follow-through, often reversing quickly and forming new consolidation structures. RSI’s oscillation between extremes confirmed short-lived momentum bursts. ADA fell from its peak of $0.5947, falling back and creating a new expanding triangle later in the session. The present pattern shows a lack of a definite trend; therefore, traders should remain cautious unless ADA sharply breaks above $0.5950 or below nearby support. Still fractured, momentum favors consolidation over breakout transactions.


