

Is Coinbase on the brink of a breakout, or will it remain trapped below $200? The COIN price has been trapped between a strong resistance at $200.32 and key support at $193.87 for several sessions, and traders are closely monitoring every move. Despite early signs of strength on May 8, the Coinbase stock once again failed to secure a breakout, showing fluctuations near the upper boundary. Price action has remained reactive to intraday MACD signals, offering quick momentum shifts but no sustained trend. With volatility narrowing and pressure building at both ends of the range, the next confirmed move could define the short-term direction. Let’s break down how the Coinbase price behaved throughout the last 24 hours.
Coinbase (COIN) Price Analysis of May 8, 2025
The Coinbase price analysis over the last 24 hours shows that the price remained range-bound between resistance at $200.32 and support at $193.87. The day began at 13:30 UTC, with the COIN price opening near $196.50. Early candlesticks moved sideways before buyers pushed the price up to $198.20 by 14:00 UTC, testing short-term strength. At 14:15 UTC, the MACD printed a death cross, indicating the shift in momentum. Sellers responded immediately, and the price dropped below $196 by 14:45 UTC. From 15:00 to 15:30 UTC, bearish pressure built slowly. A second death cross confirmed further downside at 15:40 UTC, and the Coinbase stock declined to $194.90 by 16:20 UTC.

Chart 1 – COIN/USDT M5 Chart, Analysed By Anushri Varshney, Published on TradingView, May 8, 2025
At 17:20 UTC, the MACD formed a golden cross, giving bulls a signal to re-enter. Despite initial attempts to break above $200, the price struggled to maintain upward momentum, retracing to support near $194. Resistance near $197 remained firm, and the move lost momentum. By 18:10 UTC, another death cross appeared, pushing the COIN price back toward support. The price dropped gradually to its intraday low of $194.10 at 18:40 UTC, just above the $193.87 support.
At 18:55 UTC, the MACD flipped again with a clean golden cross. A slow recovery began. Between 19:00 and 20:30 UTC, price action turned upward. COIN climbed above $195.50 and stabilized above $196. A final golden cross appeared at 20:50 UTC, supporting continued strength into the close. The Coinbase price ended the session near $196.60, showing a full round-trip from resistance rejection to support defense and recovery.
COIN Price Stalls Near Resistance After Morning Surge
The COIN price opened strong near $196.70 at 13:30 UTC, quickly climbing to $199.50 by 14:45 UTC. This bullish move followed a MACD golden cross just before 14:00 UTC. However, resistance at $200.32 limits further gains. By 15:15 UTC, the MACD printed a death cross, triggering a pullback. The Coinbase price dipped back toward $197.40 by 16:30 UTC. A brief rebound followed, but another death cross at 18:00 UTC signaled continued weakness. The Coinbase stock stayed below $198.20, struggling to reclaim earlier momentum.
COIN Awaits Breakout as Range Tightens
Coinbase (COIN) continues a very tight range, with resistance at $200.32 and support at $193.87. The rejection caused a pullback in the COIN price, and it was unable to hold above the price level of $198. As there was early bullish price action to start, the price failed at the $198 level after it could not show follow-through, indicating hesitancy from buyers. The price held above the $193.87 support, indicating weak seller conviction. A final golden cross near the close hinted at a potential recovery, though confirmation is still pending. The price remains at a decision point: a breakout above $200.32 could signal a shift in sentiment, while failure to break resistance could lead to continued sideways movement.
Coinbase (COIN) Price Analysis For May 13, 2025
The COIN Price analysis over the last 24 hours shows a clear rejection at $214, followed by a slow drift back into support near $205. The COIN Price remained range-bound throughout the session with multiple signs of weakening momentum after an early attempt to rally. The day started around $207.50 with a minor bullish push. By 13:30 UTC, the Coinbase stock made a strong move toward $213.90, testing the resistance zone formed from previous highs. However, the breakout attempt was short-lived.

Chart 2- COIN/USDT M5 Chart, Analysed By Anushri Varshney, Published on TradingView, May 13, 2025
A positive candlestick at 13:45 UTC marked a strong rejection, dragging the price sharply down to $206 by 14:00 UTC. This move triggered a brief golden cross on the MACD, but momentum faded quickly. From 14:00 UTC to 16:00 UTC, the COIN Price moved sideways between $206 and $211. Candlestick bodies tightened, and volume dropped. The RSI remained near 70, signaling an overbought region with no continuation from buyers. Around 14:30 UTC, the MACD printed a death cross, which hinted at a likely trend reversal.
Downward Channel Forms as COIN Price Struggles Near Support
At 16:15 UTC, Coinbase Price attempted a minor breakout once again, pushing briefly above $210. However, this move created a lower high compared to the earlier peak. The price then entered a downward-sloping channel, beginning a gradual drop until 18:30 UTC. A second MACD death cross appeared during this slide, while RSI dipped close to the oversold mark at 17:50 UTC, reflecting growing bearish pressure.
By 18:30 UTC, the COIN price tested the support zone at $205 for the second time in the session. Buyers defended the level once again, preventing a breakdown. A few green candles followed between 18:45 UTC and 20:00 UTC, but the bounce lacked strength. Price hovered between $206 and $208 through the evening session, showing hesitation around support. In the final hours, from 21:00 UTC to 23:55 UTC, the Coinbase stock remained stable but weak. No major volume spike or pattern reversal occurred. The MACD histogram flattened out, and RSI stayed neutral, indicating a neutral movement heading into the next session.
What’s Next for Coinbase Stock After Holding Key Support?
The Coinbase Price ended the day just above the $205 support zone, a level that held firm despite heavy selling pressure in the afternoon. After a failed breakout near $214, the COIN Price slipped into a downward channel and printed two MACD death crosses, signaling fading bullish strength. Although buyers defended the lower boundary well, the lack of follow-through on the recovery suggests the upside is still limited. RSI moved out of the oversold zone but stayed weak, hovering below 50. This points to possible sideways movement unless a strong breakout occurs. For the Coinbase stock to regain bullish momentum, a clean push above $210 is critical. Until then, the price may be stuck in $205 and $214. Traders should be careful and look for either a change in volume or for a break above or below this range that ultimately leads to the next clear direction of price action.
Coinbase (COIN) Price Analysis For May 17, 2025
The COIN price analysis over the last 24 hours shows a clear sequence of bullish momentum, ranging consolidation, and a strong recovery breakout, with price action navigating key trend channels. The session began with a steady uptrend as the Coinbase price climbed through an upward channel early in the day. This rally started around 13:00 UTC, moving from the $260 zone to test the $268 level by 14:15 UTC. The move was supported by a golden cross on the MACD, while the RSI pushed past 70, signaling an overbought condition. The momentum here was sharp, showing strong buyer interest early on.
After peaking near $268.60, the COIN price pulled back in a minor downtrend from 14:20 to 14:35 UTC. Red candles appeared as the RSI cooled off, and a death cross formed on the MACD, confirming weakening bullish pressure. However, the sell-off was short-lived. The Coinbase stock resumed its climb within a second upward channel from 14:35 UTC to around 15:45 UTC. This push brought the price to the day’s high of roughly $270. The RSI again touched overbought levels, and another MACD death cross signaled slowing momentum at the top.
COIN Price Slides, Then Recovers With Bullish Breakout
From 15:50 UTC onward, the COIN price entered a sideways range, trading between $266 and $269 for several hours until 18:00 UTC. During this time, the MACD remained flat and RSI hovered in neutral territory. This consolidation reflected uncertainty as buyers and sellers balanced out.

Chart 3- COIN/USDT M5 Chart, Analysed By Anushri Varshney, Published on TradingView, May 17, 2025
Later in the evening, around 18:15 UTC, a fresh downward channel formed. The Coinbase price dropped from the $267 area down to around $258 by 19:30 UTC. Multiple death crosses on the MACD confirmed the trend shift, while RSI slid to the 40s, showing fading momentum. Selling pressure picked up, and the trend turned clearly bearish. But by 19:40 UTC, a sharp reversal came in. The price broke out of the downward channel with solid green candles, quickly reclaiming ground and pushing back above $266. A golden cross on the MACD supported this rebound, and RSI rose back toward 57, pointing to revived buying interest but still below overbought levels.
COIN Price Rebounds Above $266 After Drop to $258 Support
The Coinbase price action over the last 24 hours reflects a typical mix of momentum-driven rallies, consolidation, and a healthy pullback before recovery. After testing the $270 resistance twice during the day, the COIN price lost steam and slipped into a downward channel, reaching as low as $258. This level acted as strong support, and buyers quickly stepped back in, triggering a breakout backed by a golden cross on the MACD and rising RSI. The recent close near $266.59 suggests confidence is returning, but the real test lies at the $270 resistance. A clean break above it could open up further upside, while failure might pull the price back toward the $264-$258 zone. Momentum indicators now lean slightly bullish but are not overextended. As long as Coinbase stock holds above the $264 support, the outlook for short-term recovery remains intact. Traders should watch for volume confirmation on any move above $270.
Coinbase (COIN) Price Analysis For May 20, 2025
The Coinbase Price analysis over the last 24 hours shows a shift from early downside pressure into a quiet consolidation phase. The COIN price started the session with mild strength near $265.69 but quickly entered a downward channel as selling pressure increased after 13:00 UTC. Between 13:05 and 13:30 UTC, the Coinbase stock dropped from $265.75 to around $263.40. The breakdown was fast, and the downward channel was confirmed as COIN kept forming lower highs. A short bounce followed after 14:00 UTC when the MACD gave a golden cross, helping the price touch $265 again. But the upside was short-lived.
At 15:30 UTC, the COIN price reacted to a MACD death cross, dropping back toward $263.80. From there, the selling eased. Price action entered a sideways trading range between $262.80 and $266.20, and this tight channel held for the rest of the day. Between 16:00 and 17:00 UTC, Coinbase stock remained flat, with little movement. MACD turned sideways, and RSI hovered near 50, reflecting a lack of trend. A second death cross appeared on the MACD at 17:00 UTC, but the price stayed stable near $264.20. There was no major sell-off after this signal, hinting at fading bearish momentum.
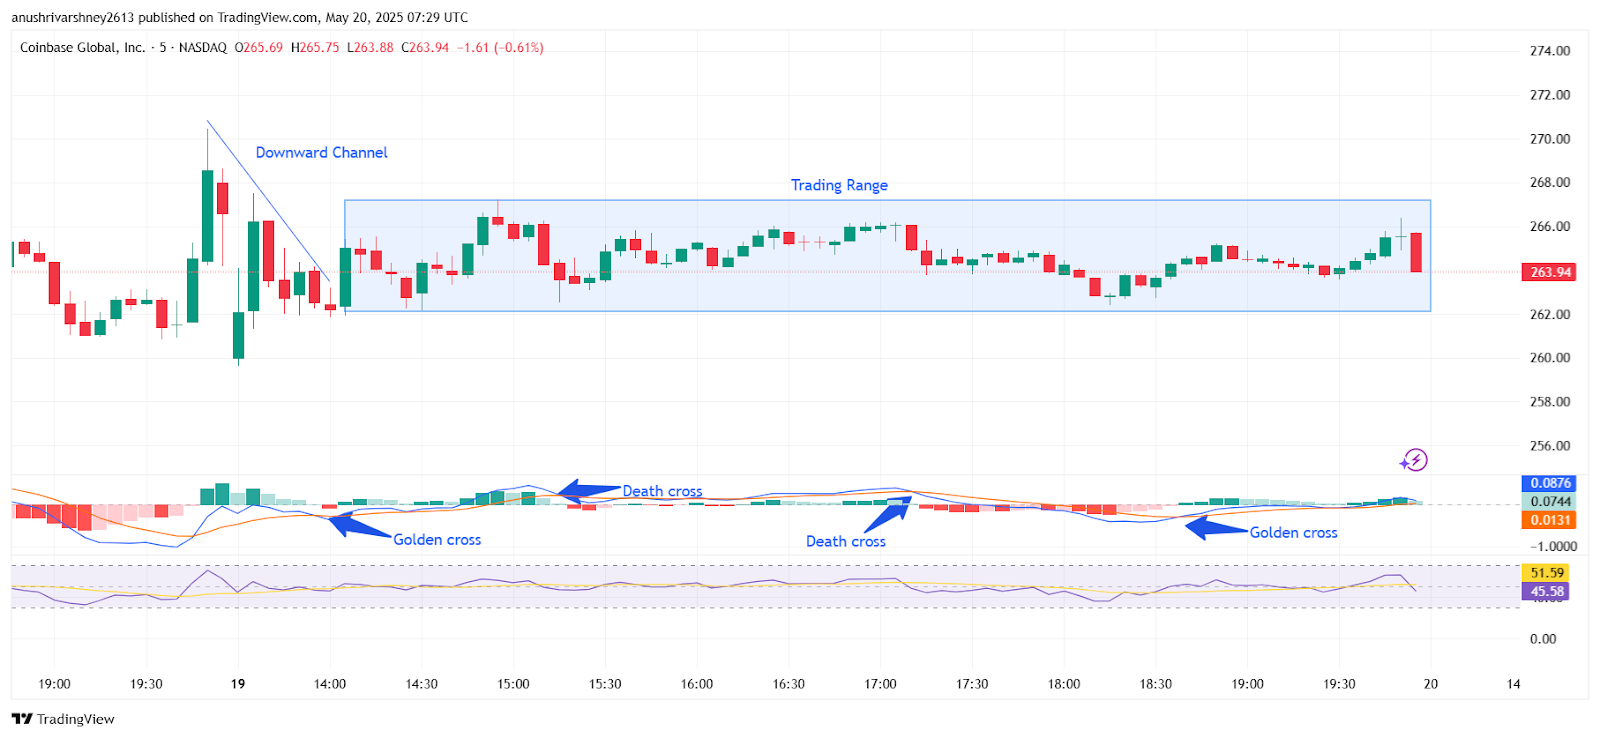
Chart 4- COIN/USDT M5 Chart, Analysed By Anushri Varshney, Published on TradingView, May 20, 2025
The COIN price showed some signs of recovery after 18:30 UTC. A slow grind upward began, and the MACD printed another golden cross near 19:00 UTC. This led to a mild move higher, with COIN testing the top of the range around $266.15 at 19:45 UTC. Buyers tried to break above the resistance, but volume didn’t support a breakout.
COIN Price Struggles to Break $266.20, Closes With Mild Loss
Right before the close, a sharp red candle erased those gains. The Coinbase price dropped back to $263.94 by 20:00 UTC, giving up the intraday bounce. The session closed with a mild 0.61% loss. Despite multiple MACD crossovers, the Coin stock failed to establish any clear trend. RSI also remained stuck between 45 and 52, confirming a neutral stance. Bulls need a breakout above $266.20 to trigger momentum toward $270. On the downside, a clean break below $262.80 could invite more selling. Until then, the Coinbase stock is likely to stay rangebound in the short term.
COIN Price Consolidates In Range-Bound Between $262.80 and $266.20
The Coinbase price remained trapped within a narrow $3.40 range, trading between $262.80 and $266.20 for most of the session. The COIN price displayed low volatility, with no strong directional bias. A total of three MACD crossovers, two golden crosses, and one death cross reflected the indecisive momentum throughout the day. Despite these signals, the Coinbase stock failed to break out, holding firm inside the clearly defined trading box. RSI levels between 45 and 52 confirmed the neutral sentiment.
As of now, both bulls and bears appear cautious. A clean breakout above $266.20 could shift momentum toward the $270 mark. Conversely, a break below $262.80 might push the price toward $260 or lower. Until either level is broken, the COIN price will likely continue trading sideways. This consolidation phase may set the stage for a more decisive move once volume picks up and market direction becomes clearer.
Coinbase (COIN) Price Analysis For May 23, 2025
The COIN price analysis shows a mixed performance over the last 24 hours, marked by alternating trading ranges, sharp channel moves, and key RSI and MACD signals. The Coinbase price opened the day with a volatile candle, reaching above $273.50 before falling into a consolidation range between $270.50 and $272.20. This sideways phase persisted through the early morning hours, forming a clear trading range that lasted until 15:00 UTC.
By 15:10 UTC, the Coinbase stock broke out of the range with a surge, entering an upward channel. This short-term uptrend pushed prices steadily higher, forming higher highs and lows. The COIN price moved from $271 to nearly $275 by 15:50 UTC, with RSI pushing into the overbought zone and MACD flashing a golden cross around 15:25 UTC, a sign of bullish momentum.
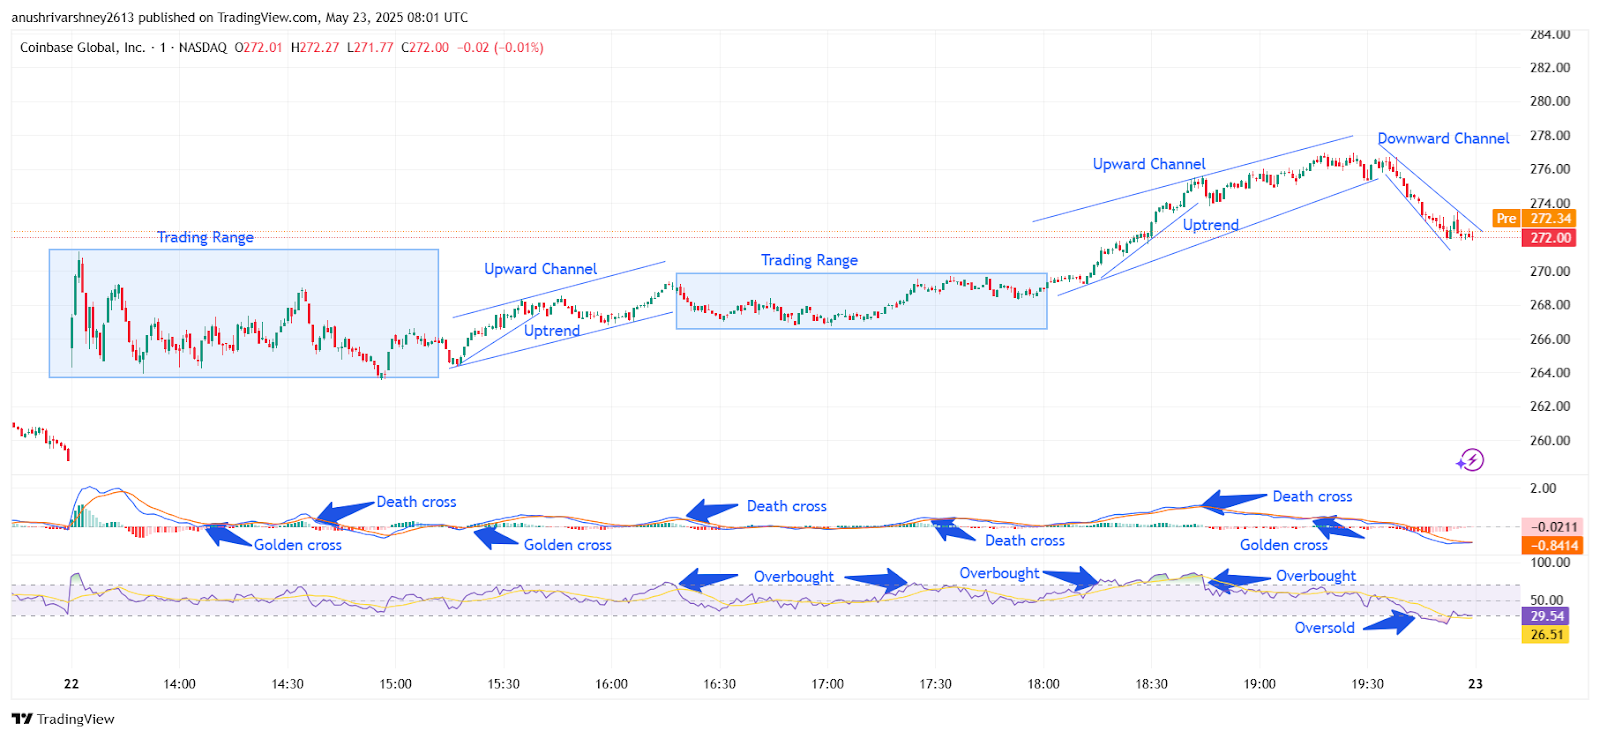
Chart 5- COIN/USDT M5 Chart, Analysed By Anushri Varshney, Published on TradingView, May 23, 2025
However, by 16:00 UTC, the upward channel lost strength. The price retraced briefly and then shifted back into a sideways movement between $273.80 and $275.20. This tight range held until around 17:10 UTC. In that time, RSI slowly worked itself back to neutral from overbought, and MACD crossed bearish near 16:40 UTC, which suggested lingering bullish strength. At 17:20 UTC, a renewed rally emerged, and the Coinbase price surged again, breaking out into a second upward channel. The trend remained bullish through the evening, with COIN pushing as high as $278.20 by 18:30 UTC.
COIN Price Drops from $277.50 to $271.80 Amid MACD Death Cross
Again, RSI spiked into overbought conditions around 18:15 and 18:40 UTC, which could suggest exhaustion. However, MACD is providing a flattening signal around this same time, which suggests weakening of that previous uptrend. The momentum waned after 19:00 UTC. A death cross appeared on the MACD, and COIN entered a downward channel. The price declined steadily from $277.50 to $271.80 by the session close. RSI confirmed this shift, dropping sharply and entering the oversold region by 20:00 UTC. The Coinbase stock struggled to rebound afterward, holding between $271.50 and $272.50 into the close.
Overall, the COIN price saw multiple trend shifts: two strong upward channels, two sideways ranges, and a sharp downward move by day’s end. Technical signals like MACD crosses and RSI extremes added precision to the reversals. The Coinbase price is currently under pressure, and unless bulls reclaim the $275 level, weakness may persist. Eyes now turn to the next MACD signal and RSI behavior for signs of recovery or deeper pullback.
Coinbase Stock Faces Key Test After Sharp Intraday Reversal
The Coinbase stock ended the session with notable weakness after failing to hold gains from its earlier upward channels. Despite two strong uptrends and brief overbought conditions on the RSI, the COIN price reversed sharply late in the day. The MACD confirmed the shift with a death cross around 19:00 UTC, and price action broke into a downward channel that dragged the Coinbase price from near $278 down to $271.
This move shifted short-term sentiment, with RSI entering oversold territory by the close, signaling caution for bulls. The final price action settled around $272, showing that buyers lacked follow-through strength at higher levels. COIN must reclaim the $275–$276 resistance zone to restore upward momentum. Failure to do so may keep the stock under pressure, with $270 as the key support level. Traders should watch for fresh MACD signals and RSI divergence to catch any potential reversal or confirmation of an extended downside.


