

If you want to invest in or buy Cosmos and wonder what the right price to start accumulating Cosmos is, then you are at the right place. As we go through the analysis, we will determine different patterns and how Cosmos reacts to them. We will also see support and resistance, which is a good area for any instrument to buy or sell. Without any further delay, let’s dive into the Cosmos price analysis and explore different opportunities arising from it.
Cosmos Price Analysis of May 3, 2025
Cosmos began the session with an upward-moving channel, reaching the high of the day at $4.51 at 03:05 UTC. RSI rose above 70, signaling overbought conditions and hinting at a possible reversal. A breakdown followed at 04:30 UTC, supported by a golden crossover of MACD, sending the Cosmos price lower to establish support at $4.410 and resistance at $4.470. At 16:15 UTC, the ATOM price attempted to break resistance with MACD support but failed. Later, at 19:35 UTC, the support was tested and broken during a death cross, leading to a brief range.

Chart 1: Analysed by vallijat007, published on TradingView, May 3, 2025
RSI dropped below 30 at 19:45 UTC, confirming oversold pressure before the range broke down further at 21:45 UTC. Cosmos marked a low at $4.320, with new resistance forming at $4.370. An upward-moving channel appeared in Cosmos, which marked the high for the day at $4.51 at 03:05 UTC. RSI moved above the level of 70, indicating overbought market conditions, suggesting a reversal or at least a pullback. The upward-moving channel broke to the downside at 04:30 UTC, supported by a golden crossover of MACD. ATOM price dipped to the downside and formed a support area at $4.410 and a resistance area at $4.470.
ATOM’s Bearish Momentum: Why Every Rally Attempt is Failing
Price attempted to break the resistance area at 16:15 UTC, supported by a golden crossover of MACD, but the upside Cosmos breakout failed. An attempt was made to break the support area at 19:35 UTC, supported by a death cross of MACD. Price moved to the downside and formed a small range. In the meantime, at 19:45 UTC, RSI dropped below the level of 30, indicating oversold market conditions, suggesting a reversal or at least a pullback.
The range broke to the downside at 21:45 UTC, supported by a death cross of MACD. Price moved to the downside but failed to form a downward-moving channel. Price marked the low for the day at $4.320. Cosmos created a resistance area at $4.370. Cosmos is currently in a downtrend with successful downside breakouts, and any attempts to break out to the upside have failed. If Cosmos breaks the resistance area at $4.370, then it may rise to the level of $4.400. If the price drops to the level of $4.300, then there will be a high chance that Cosmos could reach the level of $4.200.
Cosmos at a Key Decision Point
Cosmos price is currently trending lower, with downside Cosmos breakouts holding while upside attempts continue to fail. The daily high at $4.51 triggered overbought signals, and since then, price action has weakened. A key support lies at $4.30; if this breaks, the next target is $4.20. On the upside, $4.37 is the immediate resistance, and a breakout above this could push Cosmos toward $4.40. However, given repeated failed bullish attempts and the presence of MACD death crosses, the trend favors bears for now. Traders should remain cautious and wait for a confirmed breakout or support hold before taking positions.
Cosmos (ATOM) Price Analysis of May 7, 2025
Beginning the session with a downward-moving channel, Cosmos broke out to the upside at 13:20 UTC, backed by a Golden Cross of the MACD. The Cosmos price, however, lacked momentum and stopped around the $4.075 resistance area. Cosmos fell to a daily low of $3.980 following the rejection, where RSI dropped under 30, indicating oversold conditions. Price shot above $4.075 in response to this, backed once more by a bullish MACD crossover. Forming a new upward-moving channel, the ATOM price surged to $4.160, the day’s high, before heading into overbought territory.

Chart 2: ATOM/USDT M5 Chart, Analysed by vallijat007, published on TradingView, May 7, 2025
A downward-moving channel appeared in Cosmos price action, which broke out to the upside at 13:20 UTC, supported by a Golden Cross of the MACD. However, the ATOM price failed to establish a sustainable trend following the breakout. Instead, it formed a resistance area at the $4.075 level, where buying momentum stalled.
Following the rejection at ATOM resistance, Cosmos dropped to $3.980, marking the low for the day. At the same time, RSI fell below the 30 level, signaling oversold market conditions and suggesting a possible reversal or at least a short-term pullback. Buyers responded, and the price spiked to the upside, breaking above the $4.075 resistance level. This breakout was also supported by a Golden Cross on the MACD, confirming renewed bullish momentum.
ATOM’s Pivotal Levels: 4.00 Support vs 4.20 Resistance
The upward movement led to the formation of an upward-moving channel, with the Cosmos price eventually marking the high for the day at $4.160. However, at 01:30 UTC, the RSI crossed above 70, indicating overbought conditions; as expected, a pullback followed. The upward channel broke out to the downside at 02:05 UTC, supported by a Death Cross of the MACD, leading to a spike lower.
If the breakout from the upward-moving channel holds, Cosmos may drop back to the $4.075 level. This area, which previously acted as ATOM resistance, may now serve as support. If that level fails, the Cosmos price could decline further to $4.00, another key support zone. On the other hand, if the downside breakout fails and buying strength returns, Cosmos could rebound and rise toward the $4.200 level.
Reflecting market uncertainty, both MACD and RSI signals now sit almost at their basic levels. This points to Cosmos starting a consolidation phase. If this lateral movement persists, it might accumulate momentum for the following significant directional shift. To predict the next trend with confidence, traders should look for a confirmed breakout with volume above $4.160 or a confirmed breakdown below $4.000. Until then, short-term fluctuation might continue inside this range.
ATOM’s Next Move: Consolidation or Breakdown?
After topping at $4.160, RSI crossed above 70, and Cosmos pulled back sharply. At 02:05 UTC, the upward channel broke to the downside, supported by a Death Cross on MACD, signaling potential short-term weakness. If the pullback holds, $4.075 could act as support. A breakdown below this level might take Cosmos to $4.000. Conversely, if buying resumes and the breakdown fail, Cosmos could rebound toward $4.200. With both MACD and RSI hovering near neutral levels, Cosmos is likely entering a consolidation. Traders should wait for a clean breakout above $4.160 or a breakdown below $4.000 for a confirmed directional move.
Cosmos (ATOM) Price Analysis of May 16, 2025
The Atom price action throughout the session reflected a tale of two halves: early bearish momentum followed by choppy consolidation. The day began with a breakdown from an upward-moving channel after reaching the session high, triggering a decline through a downward channel and eventually marking the day’s low. Though an expanding triangle breakout hinted at recovery, the lack of follow-through confirmed market hesitation. The second half saw minor bullish attempts, including breakouts from ranges and a rebound from oversold RSI levels, but none evolved into sustained trends. Momentum repeatedly faded as Cosmos coin settled into a range-bound structure defined by rapid reversals.
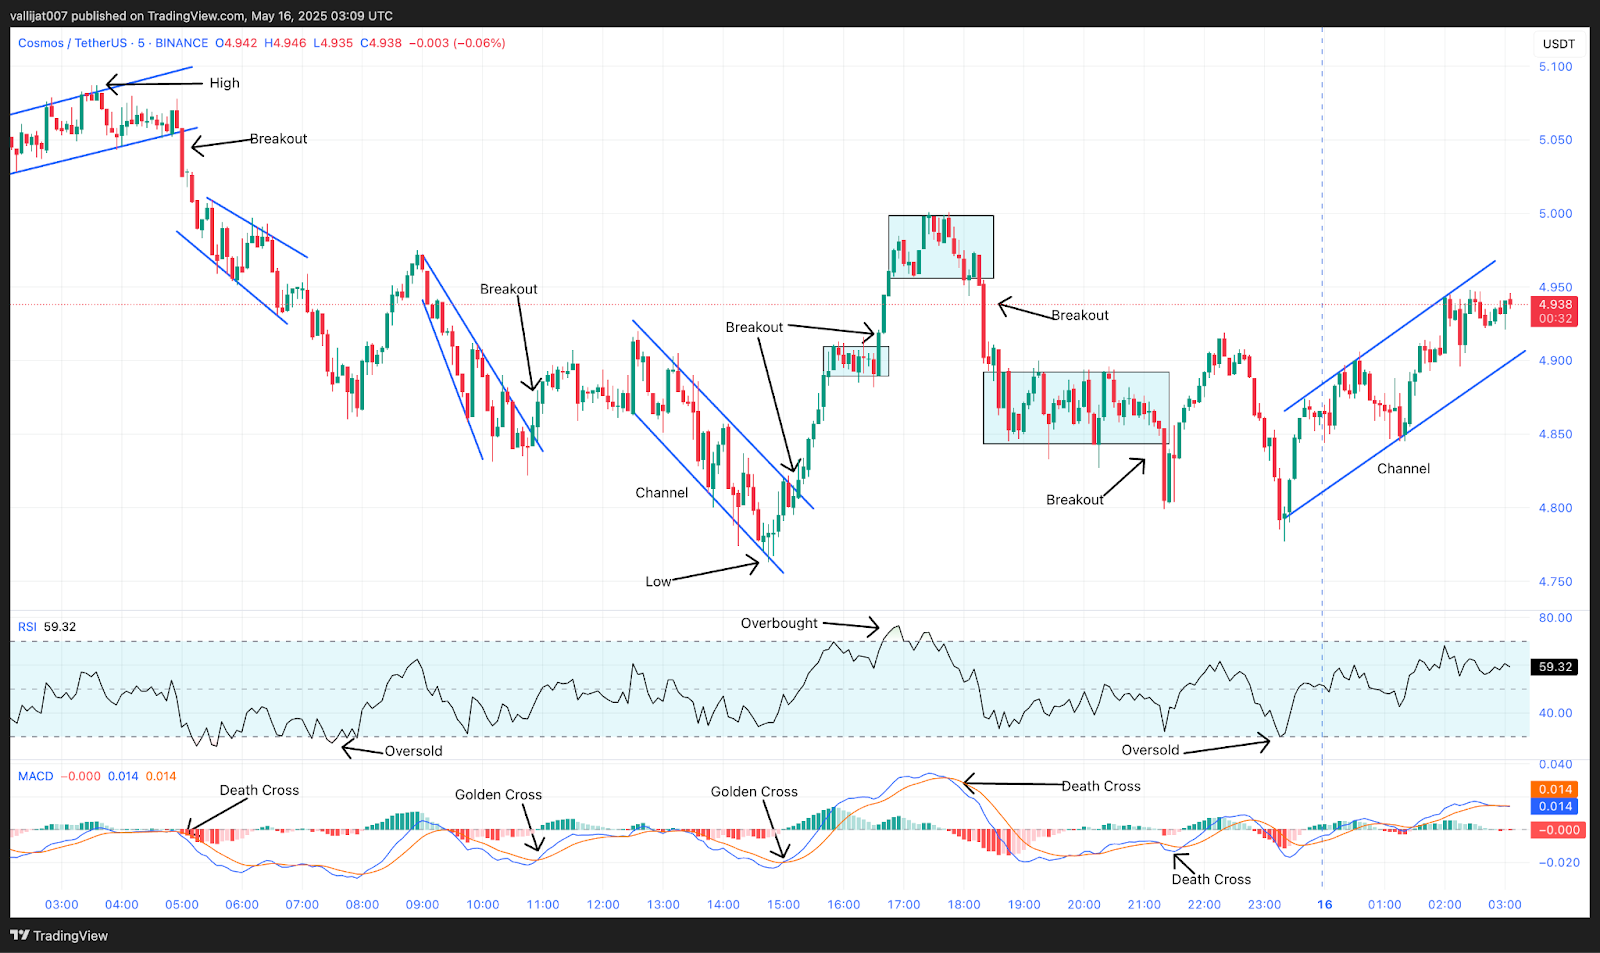
Chart 3: ATOM/USDT M5 Chart, Analysed by vallijat007, published on TradingView, May 16, 2025
An upward-moving channel appeared in the ATOM price, which marked the high for the day at $5.087. The upward-moving channel broke out to the downside at 05:00 UTC, supported by a death crossover of MACD. Price dropped to the downside and formed a downward-moving channel, which pushed the Cosmos price to the level of $4.860. An expanding triangle pattern appeared in the price, which broke out to the upside at 10:55 UTC, supported by a golden crossover of MACD, but the price failed to form an upward trend. Instead, a downward-moving channel appeared in the ATOM price, which marked the low for the day at $4.763.
Channel Formation: Upside Target 5,500 vs.Downside Risk to 4.500
The downward-moving channel broke out to the upside at 15:15 UTC, supported by a golden crossover of MACD. Cosmos coin moved to the upside and formed a minor range, which again broke out to the upside at 16:35 UTC, supported by a golden crossover of MACD. In the meantime, at 16:50 UTC, RSI moved above the level of 70, indicating an overbought market condition, suggesting a reversal or at least a pullback. Another range appeared in the price, which broke out to the downside at 18:20 UTC, supported by a death crossover of the MACD.
The Cosmos price dropped to the downside and formed another range. This range again tried to break out to the downside at 21:20 UTC, supported by a death crossover of MACD, but the price failed to form a successful breakout, and the breakout instantly failed. In the meantime, the price again dropped to the level of $4.780, pushing the RSI below the level of 30, which indicates an oversold market condition, suggesting a reversal or at least a pullback.
The Cosmos price formed an upward-moving channel. If the channel breaks out to the upside, then there is a chance that the price may reach the level of $5.500. If that upward-moving channel breaks out to the downside, the price may drop to the level of $4.500. The price showed bearish momentum in the first half of the session, and the second half of the session showed a consolidation behavior in which most of the breakouts soon failed or reversed to the opposite side.
Golden Cross Dilemma: Strong Signals But Weak Follow-Through
The ATOM price is trading within an upward-moving channel after a session marked by early weakness and late-stage indecision. While bullish signals have emerged, supported by golden MACD crossovers and oversold RSI conditions, most upside moves have lacked momentum. A confirmed breakout from the current structure could push the price toward higher levels, but any failure may reopen downside risk. With MACD and RSI offering mixed signals and recent breakouts struggling for follow-through, traders should stay cautious. Until the channel resolves decisively, Atom remains stuck between recovery potential and bearish continuation, with volatility and quick reversals still shaping short-term market behavior.
Cosmos (ATOM) Price Analysis of May 21, 2025
Cosmos coin traded in a volatile but largely indecisive session, cycling through multiple technical formations with limited follow-through. After an early upside breakout from a minor range, the Cosmos price briefly rallied to mark the session high, only to face overbought RSI conditions that signaled an impending pullback. What followed was a series of expanding triangle patterns and channel formations, each producing short-term moves but lacking the strength to sustain a trend. Despite a notable selloff that pushed the ATOM price to its daily low, oversold RSI levels triggered a recovery. However, repeated MACD death crossovers and failed breakouts kept price action confined within a choppy range.
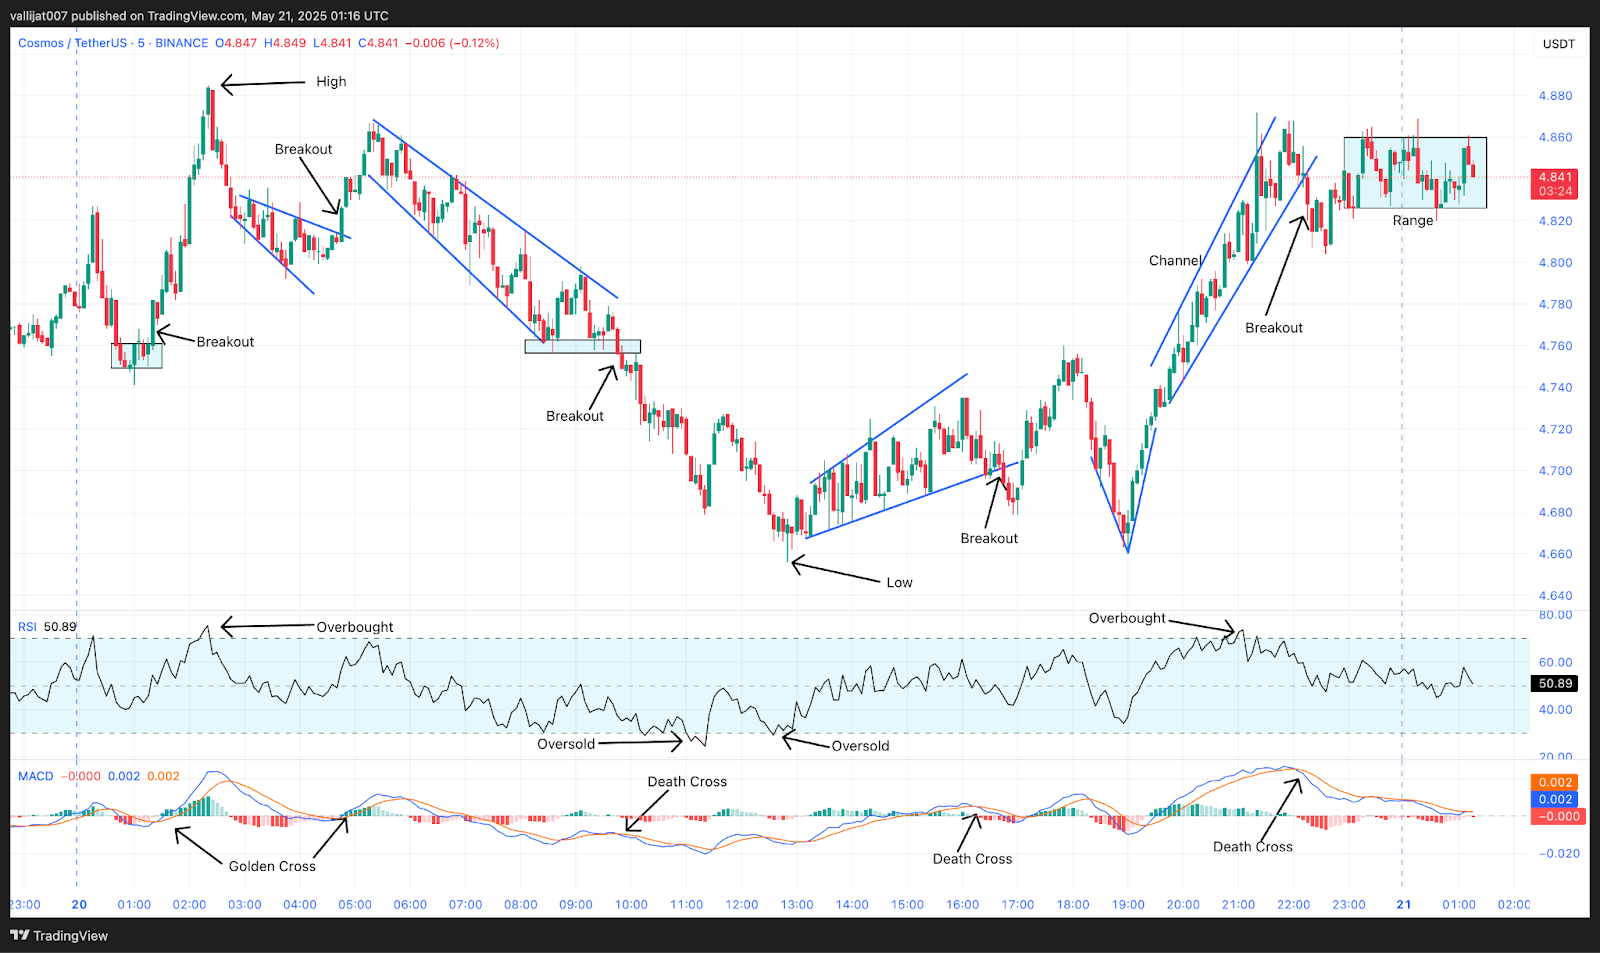
Chart 4: ATOM/USDT M5 Chart, Analysed by vallijat007, published on TradingView, May 21, 2025
Cosmos price formed a minor range, which broke out to the upside at 01:20 UTC, supported by a golden crossover of MACD. Price spiked to the upside and marked the high for the day at $4.885. In the meantime, at 02:20 UTC, RSI moved above the level of 70, indicating overbought market conditions, suggesting a reversal or at least a pullback. After marking the high, the ATOM price dropped to the downside and formed a small expanding triangle pattern.
Oversold RSI Bounce: Temporary Relief or Trend Reversal?
The expanding triangle pattern broke out to the upside at 04:45 UTC, supported by a golden crossover of MACD. Price spiked to the upside but failed to sustain the uptrend, and another expanding triangle pattern appeared in the Cosmos price. The expanding triangle pattern pushed the price to the level of $4.760 and created a resistance zone there. The resistance broke to the downside at 09:50 UTC, supported by a death crossover of the MACD. Price spiked to the downside and marked the low for the day at $4.656.
In the meantime, at 11:00 UTC, RSI dropped below the level of 30, indicating oversold market conditions, suggesting a reversal or at least a pullback. The reversal came in the form of another expanding triangle pattern. This expanding triangle pattern again broke out to the downside at 16:45 UTC, supported by a death crossover of MACD, but price failed to form even a spike, and the breakout failed.
Price again attempted to mark another low, but at 19:00 UTC, Cosmos price formed a V-recovery, which pushed the price higher, and an upward-moving channel appeared in the price. The upward-moving channel broke out to the downside at 22:15 UTC, supported by a death crossover of MACD, but the price failed to form a downtrend. Instead, a range appeared in the price. If the range breaks out to the upside, then the Cosmos price may rise to the level of $5.000. If the range breaks out to the downside, then the price may drop to the level of $4.500.
Cosmos Coin Awaits Breakout as Market Stalls
Cosmos price remains trapped in a consolidation phase after a session filled with failed breakouts and weak momentum. Repeated attempts to break both support and resistance zones have fallen flat, as neither bulls nor bears could sustain control. RSI fluctuations between overbought and oversold territory, together with reversals in MACD, suggest the market is indecisive. We could see the beginning of a new trend if ATOM moves above $5.000 for an upside trend or below $4.500 for more downward moves. Until the trend is clearer, traders need to move with extra care, looking for confirmation and skipping quick opportunities in this uncertain market.
Cosmos (ATOM) Price Analysis of May 28, 2025
Cosmos coin traded with high volatility throughout the session, driven by a sequence of technical patterns and momentum crossovers. The session began with a breakout from a downward-moving channel, followed by the formation and upward breakout of a converging triangle. However, the initial bullish move quickly lost steam as a failed range breakout led to a sharp reversal. An expanding triangle emerged, followed by a breakdown that dragged prices lower into another downward-moving channel. Although several golden crossovers of MACD attempted to lift the Cosmos price, most rallies were short-lived. RSI also signaled overbought conditions mid-session, warning of weakening upside momentum.

Chart 5: ATOM/USDT M1 Chart, Analysed by vallijat007, published on TradingView, May 28, 2025
The Cosmos price formed a downward-moving channel. The channel broke out to the upside at 00:17 UTC, supported by a golden crossover of MACD. Price moved to the upside and formed a converging triangle pattern. The converging triangle broke out to the upside at 00:53 UTC, supported by a golden crossover of MACD, and a range was formed. The range broke out to the upside at 01:08 UTC, marking the high for the day at $4.790, but the breakout failed, and the Cosmos price dropped to the downside, forming an expanding triangle pattern.
Expanding Triangle Breakdown to $4.694 Low
The expanding triangle pattern broke out to the downside at 01:59 UTC, supported by a death crossover of MACD. This formed another downward-moving channel, which marked the low for the day at $4.694. The channel broke out to the upside at 02:41 UTC, supported by a golden crossover of MACD, and the ATOM price formed another range. That range broke out to the downside at 03:00 UTC, supported by a death crossover of MACD, but failed to sustain a trend and reversed.
A second range formed, which broke out to the upside at 03:34 UTC, supported by a golden crossover of MACD, and formed an upward-moving channel. The upward channel broke out to the downside at 03:58 UTC, supported by a death crossover of MACD, and a new downward-moving channel followed. This downward channel broke out to the upside at 04:35 UTC, supported by a golden crossover of MACD.
In the meantime, at 04:46 UTC, RSI moved above the level of 70, indicating overbought market conditions and suggesting that the price may struggle to sustain upward momentum. Price dropped again and formed another range. The range broke out to the downside at 06:00 UTC, supported by a death crossover of MACD, and formed another downward-moving channel. If this channel breaks to the downside, the ATOM price may drop to the level of $4.500. If it breaks to the upside, the price may rise to $5.000.
Indecision Dominates in Cosmos Coin as Momentum Wanes
Cosmos price remains trapped in a highly volatile environment where breakouts lack conviction and trend-following setups often reverse. After multiple shifts between upward and downward channels, traders face a market with little directional clarity. Because RSI is overbought and the MACD failed to sustain gains after going positive, the price is likely to either stay flat or drop further. Traders should only enter a trade after the market breaks out with significant volume. For now, the price is expected to move up and down in a narrow range because the broader market is quiet.
Cosmos (ATOM) Price Analysis June 12, 2025
Cosmos price exhibited a highly technical trading session characterized by frequent breakouts and rapid reversals. The day opened with a converging triangle breakdown and continued through a sequence of ranges and expanding triangle formations. The Cosmos trend reached a high of $4.629 and a low of $4.418. RSI movements were significant throughout the session, repeatedly crossing overbought and oversold levels, signaling volatile momentum shifts. Despite several golden and death crossovers of MACD confirming short-term breakouts, most trends lacked strength, keeping Cosmos range-bound and sensitive to technical triggers. ATOM price is currently trading at $4.420.
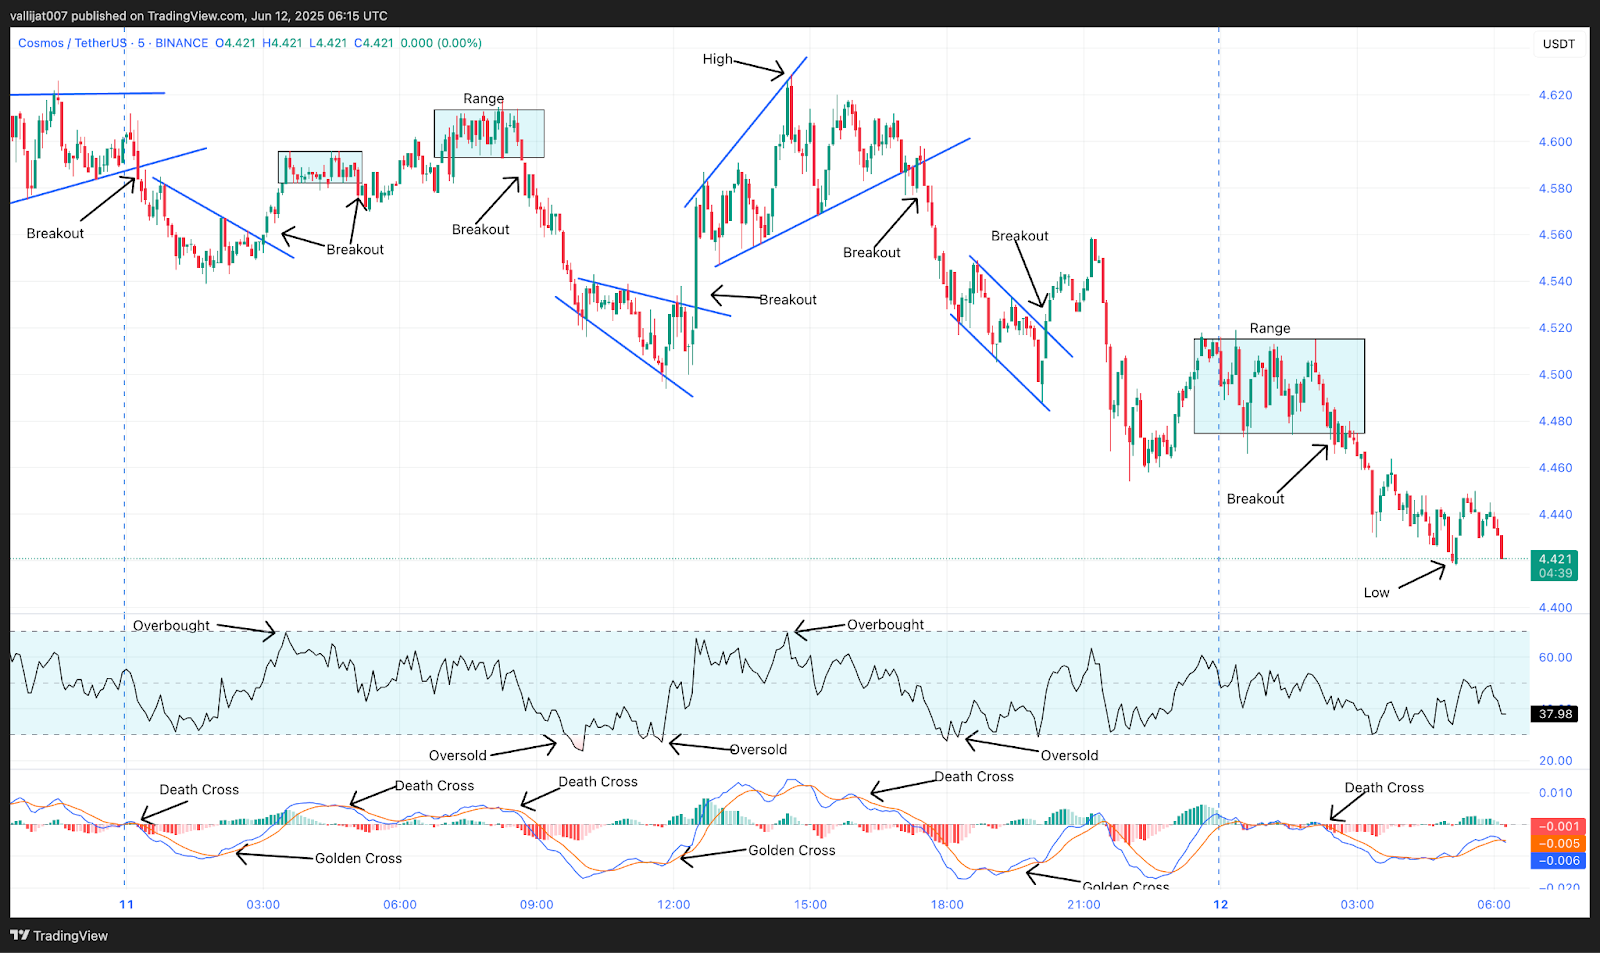
Chart 6: ATOM/USDT M5 Chart, Analysed by vallijat007, published on TradingView, June 12, 2025
Cosmos price formed a converging triangle pattern, which broke out to the downside at 00:15 UTC, supported by a death crossover of MACD. Price moved downward, forming a downward-moving trendline. The trendline broke out to the upside at 03:00 UTC, supported by a golden crossover of MACD, and a range formed. At 03:30 UTC, RSI moved above the level of 70, indicating overbought market conditions and suggesting a reversal or at least a pullback.
Expanding Triangle Pattern Emerges Following Range Breakdown
The range broke out to the downside at 05:05 UTC, supported by a death crossover of MACD, but the breakout soon faded, and price rose to the upside, developing another range. The second range broke out to the downside at 08:45 UTC, supported by a death crossover of MACD, forming an expanding triangle pattern. At 09:50 UTC, RSI dropped below the level of 30, indicating oversold market conditions and suggesting a reversal or at least a pullback.
Expanding Triangle Breakout at 12:30 UTC Reaches Daily High of $4.629
The expanding triangle pattern broke out to the upside at 12:30 UTC, supported by a golden crossover of MACD, and another expanding triangle pattern formed. This second expanding triangle pattern marked the high for the day at $4.629. It broke out to the downside at 17:30 UTC, supported by a death crossover of MACD, and formed a downward-moving channel. At 18:00 UTC, RSI dropped below the level of 30, signaling oversold market conditions and suggesting a reversal or at least a pullback.
The downward-moving channel broke out to the upside at 20:10 UTC, supported by a golden crossover of MACD, but the breakout failed, and the Cosmos trend dropped, forming a range. The range broke out to the downside at 02:30 UTC, supported by a death crossover of MACD, marking the low for the day at $4.418. If the breakout succeeds, the Cosmos price may drop to the level of $4.300. If the breakout fails, the price may rebound to the level of $4.700.
$4.418 Low Tests Support as Volatility Overshadows Direction
Cosmos price ended the session with more confusion than clarity as traders faced choppy momentum and unreliable breakout follow-through. While a high of $4.629 was reached during a bullish breakout from an expanding triangle, bearish momentum later dominated, driving the price toward a session low of $4.418. Oversold RSI conditions near the end of the day hinted at a possible recovery, but MACD signals remained mixed. If ATOM price can reclaim territory above recent resistance levels, a move toward $4.700 may be possible. Failure to hold support could send Cosmos toward the $4.300 level. Market participants should expect continued range-bound behavior with sudden technical shifts.


