

If you want to invest in or buy MANA and wonder what the right price to start accumulating MANA is, then you are at the right place. As we go through the analysis, we will determine different patterns and how MANA reacts to them. We will also see support and resistance, which is a good area for any instrument to buy or sell. Without any further delay, let’s dive into the MANA price analysis and explore different opportunities arising from it.
MANA Price Analysis of May 5, 2025
After hitting the day’s high at $0.3035, Decentraland price began forming a converging triangle pattern, with support identified at $0.2970. That support broke to the downside at 08:30 UTC, driven by a Death Cross of the MACD, causing a sharp drop in price and forming a downward-moving channel. By 08:40 UTC, RSI fell below 30, signaling oversold conditions and suggesting a potential reversal or bounce. The bearish channel deepened, eventually marking the daily low at $0.2873. Multiple Death Cross signals on the MACD confirmed downward momentum throughout the session, reinforcing the bearish tone despite occasional short-lived recoveries along the way.

Chart 1: MANA/USDT M5 Chart, Analysed by vallijat007, published on TradingView, May 5, 2025
After marking the high for the day at $0.3035, Decentraland price formed a converging triangle pattern with support at $0.2970. The support broke to the downside at 08:30 UTC, supported by a Death Cross of the MACD. Price spiked to the downside and formed a downward-moving channel. In the meantime, at 08:40 UTC, the RSI dropped below the level of 30, indicating oversold market conditions and suggesting a potential reversal or at least a pullback. The downward-moving channel pushed the price lower and marked the low for the day at $0.2873.
Converging Triangle Signals Imminent Volatility
Swing points within the channel phase became clear when Death Cross signals appeared on the MACD. The Death Cross signal from MACD at 12:15 UTC caused additional MANA price reduction until it reached the $0.2900 level. At 20:45 UTC, another Death Cross emerged on the MACD chart, thus generating additional pressure that sustained the decreasing trend.
A Golden Cross of the MACD emerged at 23:45 UTC, which broke through the downward channel patterns to create an upward move. The price surged higher to form a new convergent triangular formation, which built support at $0.2960. Price movement out of the converging triangle toward the downside will potentially create another trading low that may lead to a price decline towards $0.2800. The convergence pattern will create an upward movement that will result in price increases towards $0.3100 while examining past resistance points to indicate a possible change in market momentum.
Currently, Decentraland price is showing signs of hesitation, with momentum indicators like MACD alternating between bearish and bullish crossovers, while RSI readings remain in oversold territory. This reflects uncertainty in the market and a potential buildup for a bigger move in either direction. Traders should monitor the structure of the converging triangle closely. A confirmed MANA breakout with increasing volume could offer directional clarity. Until then, the price is likely to oscillate within the range, creating short-term opportunities for range-bound strategies while the broader trend remains indecisive.
Bullish Breakout or Bearish Rejection? MANA’s Pivotal Price Point
Decentraland price has broken out of its downward-moving channel and is now consolidating within a new converging triangle, supported at $0.2960. While the MANA breakout suggests potential bullish intent, mixed signals from MACD and RSI point to indecision. A breakout above this pattern could send the price toward $0.3100, while a downside break might push it to retest $0.2800. With momentum indicators alternating between bullish and bearish crossovers, traders should remain cautious. Confirmation and volume will be key. Until a clear breakout occurs, price is likely to stay range-bound, presenting short-term trading setups without indicating a firm longer-term directional trend.
Decentraland (MANA) Price Analysis of May 9, 2025
The MANA price began the session by marking an early low and forming an upward-moving channel. This bullish structure failed to hold, and the channel broke to the downside early in the session, triggered by a death crossover on the MACD. Despite this bearish signal, price action remained relatively stable, evolving into a narrow range instead of a sharp decline. The market showed signs of trending behavior, attempting an upside MANA breakout mid-morning, backed by a golden crossover of the MACD. However, this attempt lacked momentum, and a clear resistance area was established, which capped further gains for the time being.

Chart 2: MANA/USDT M5 Chart, Analysed by vallijat007, published on TradingView, May 9, 2025
The Mana price marked the low for the day at 0.2978. An upward-moving channel appeared in the price, which broke out to the downside at 04:40 UTC, supported by a death crossover of MACD. Price was unable to form a spike; instead, a range appeared, which shows trending behavior. The range tried to break out to the upside at 10:35 UTC, supported by a golden crossover of MACD, but the upside breakout failed, and price formed a resistance at $0.3170.
At 15:20 UTC, the Decentraland price broke from the resistance area of $0.3170 to the upside, supported by a golden crossover of MACD. Price spiked to the upside and formed another range. In the meantime, at 15:35 UTC, RSI was above the level of 70, indicating an overbought market condition, suggesting a reversal or at least a pullback in the ongoing price movement.
Decentraland Price at Crossroads: Continuation to $0.40 or Consolidation First?
The second range again broke out to the upside at 20:00 UTC, supported by a golden crossover of MACD. Price spiked to the upside and formed an upward-moving channel. In the meantime, at 20:05 UTC, RSI moved above the level of 70, indicating an overbought market condition, suggesting a reversal or at least a pullback in the price.
The upward-moving channel broke out to the downside at 21:40 UTC, supported by a death crossover of MACD, but the breakout failed to form a spike; instead, another range appeared. The range broke out to the upside at 00:00 UTC, supported by a golden crossover of MACD. The breakout marked the high for the day at $0.3381.
Mana price shows a strong trend day, which, if continued, can push the price up to the level of $0.4000. Or there will be a consolidation phase because after a strong trend, markets most of the time consolidate for a while to continue their trend. Traders are encouraged to take a look at the chart and analyse it properly, as the crypto market is very volatile, and every investor and trader should be cautious before placing any trade.
Will the Momentum Sustain or Fade?
The MANA price action throughout the day clearly indicated trend strength, with multiple MANA breakouts supported by momentum indicators. If this upward momentum holds, the asset could challenge its next significant psychological level on the chart. However, markets often enter consolidation phases after sustained trending sessions. A short-term pause could offer MANA the chance to build support before attempting another leg higher. Traders should be on the lookout for weakening volume or failure to hold higher levels, which may signal a shift toward range-bound trading. Key support and resistance zones remain essential to watch for confirmation of either continuation or reversal.
Decentraland (MANA) Price Analysis of May 13, 2025
The Decentraland price action has been defined by volatility within a limited range, marked by failed breakouts and weak momentum. The session began with an upside breakout from a range, leading to a brief rally and the formation of an upward-moving channel. However, this bullish structure quickly broke down, followed by multiple failed downside attempts, despite confirmation from death crossovers. The market showed signs of oversold conditions mid-session, triggering short-lived rebounds that also lacked follow-through. A series of breakout failures and weakening momentum indicators like RSI and MACD have kept the price in a consolidation, with no clear directional bias emerging.
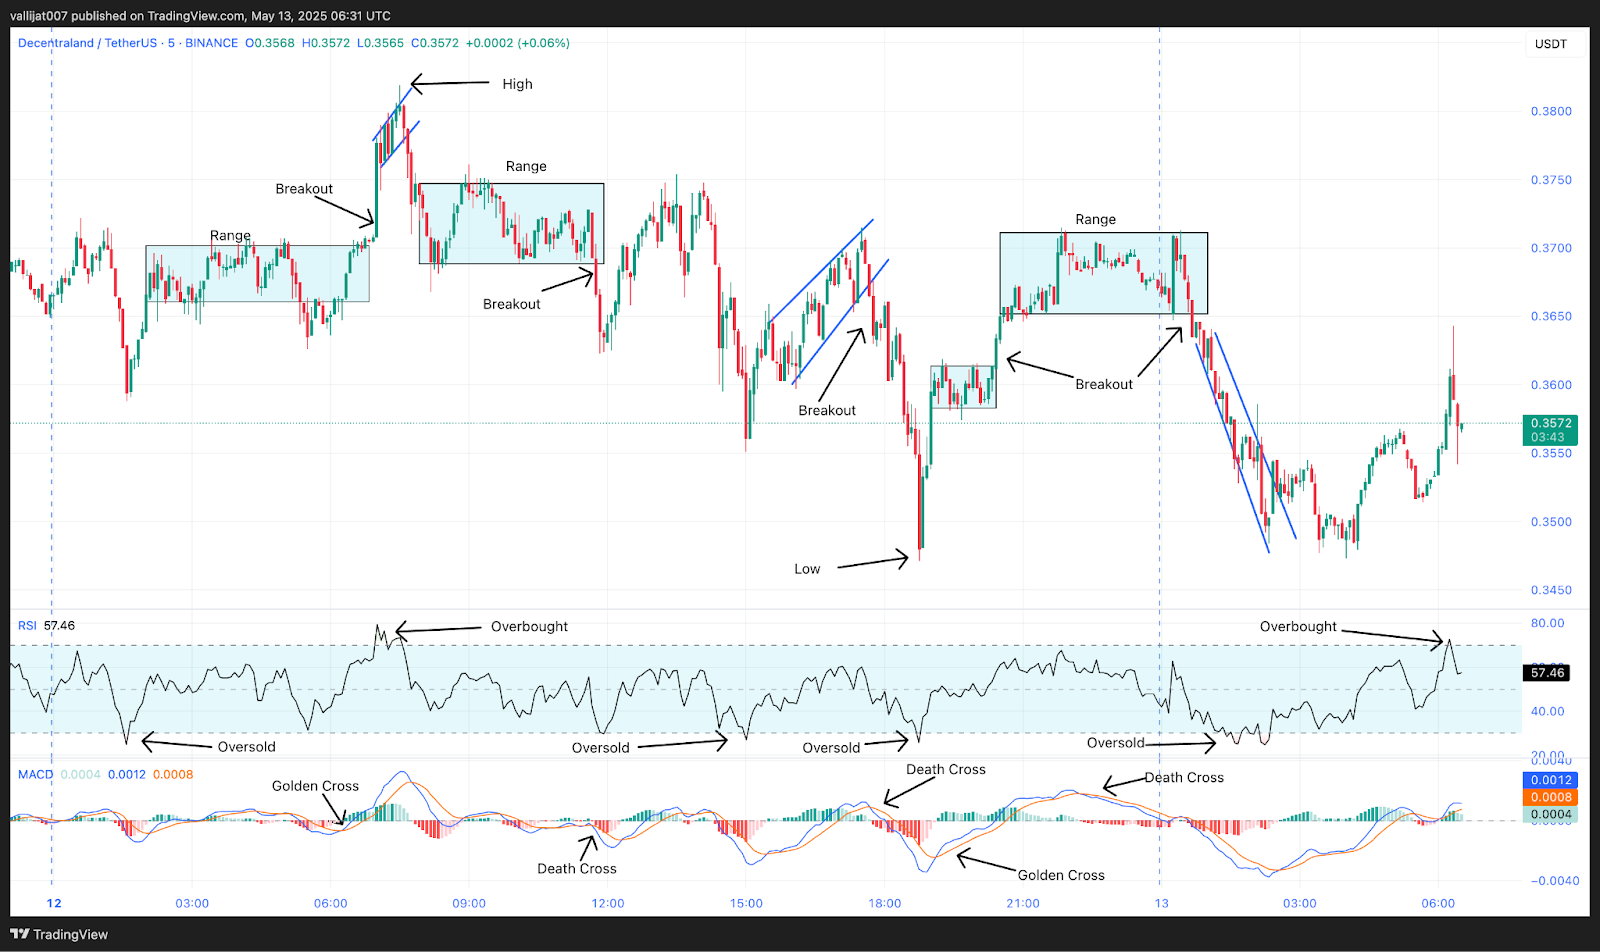
Chart 3: MANA/USDT M5 Chart, Analysed by vallijat007, published on TradingView, May 13, 2025
A range has appeared in the price of Decentraland. The range broke out to the upside at 07:00 UTC, supported by the golden crossover of MACD. MANA price spiked to the upside and formed an upward-moving channel, marking the high for the day at $0.3820. The upward-moving channel broke to the downside at 07:40 UTC, supported by the death crossover of MACD. The MANA price dropped to the downside and formed a range. This range again broke out to the downside at 11:45 UTC, supporting the death crossover of MACD, but the downside breakout failed.
Channel Breakdown to $0.3470: Death Cross Confirms Bearish Shift
An upward-moving channel appeared in the price, which broke out to the downside at 17:40 UTC, supported by the death crossover of MACD. Price dropped to the downside, marking the low for the day at $0.3470. In the meantime, at 18:45 UTC, RSI dropped below the level of 30, indicating an oversold market condition, suggesting at least a reversal. After marking the low, the price moved to the upside and formed a minor range.
The minor range broke out to the upside at 20:25 UTC, supported by the golden crossover of MACD. Price spiked to the upside and formed a larger range. This range broke out to the downside at 00:40 UTC on 13th May 2025, supported by the death crossover of MACD. Price dropped to the downside and formed a downward-moving channel. At 02:25 UTC, the price broke out from the downward-moving channel to the upside, but the upside breakout failed.
Price moved to the downside but was also unable to break the low for the day. This created a sideways movement in the Decentraland price. The price shows a trading range behaviour, with most of the breakouts failing to reach their targets. MACD and RSI both meandered to their base levels, indicating indecision in the market. To set up a clear trend, Decentraland price has to break the resistance level of $0.3800 or the MANA support level of $0.3450. Until price breaks these two critical levels, the Decentraland price may continue its consolidation phase.
False Breakouts Dominate: Bulls & Bears Lack Conviction
MANA price is stuck in the sideways phase as neither bulls nor bears could gain dominance. In spite of the many breakouts up and down, the majority of the moves had neither sufficient strength nor sustaining momentum and quickly reversed. The indecisive is further supported by the fact that the momentum indicators like RSI and MACD have flattened. For a new trend to be developed, the price would have to break above resistance or below MANA support with good confirmation and volume. Until then, traders should proceed with caution, taking no aggressive directional bets. However, in this environment, range-trading techniques are more effective because Decentraland still hovers within its well-defined limits.
Decentraland (MANA) Price Analysis of May 29, 2025
Decentraland price opened the session with the formation of a downward-moving converging triangle. A bullish breakout soon followed, backed by a golden crossover of MACD, sending the price into an upward-moving channel. However, overbought RSI readings suggested a pullback was imminent, and it was. The Decentraland price reversed into a volatile downward swing, forming an expanding triangle that also broke lower. A series of downside breakouts followed, each triggering sharp drops and new technical patterns, including ranges and converging triangles, yet none managed to hold a trend. Breakouts came and went quickly, with bullish and bearish signals alternating in rapid succession.

Chart 4: MANA/USDT M1 Chart, Analysed by vallijat007, published on TradingView, May 29, 2025
The Decentraland price formed a downward-moving converging triangle pattern. The converging triangle pattern broke out to the upside at 00:20 UTC, supported by a golden crossover of MACD, MANA price spike to the upside, and formed an upward moving channel. In the meantime, at 00:25 UTC, RSI moved above the level of 70, indicating overbought market conditions, suggesting a reversal or at least a pullback. The upward-moving channel broke out to the downside at 00:41 UTC, supported by a death crossover of the MACD price spike to the downside, and formed an expanding triangle pattern.
Death Cross Breakdowns Establish $0.3064 Low
The expanding triangle pattern broke out to the downside at 01:10 UTC, supported by a death crossover of MACD, and the price formed a range after the breakout. The range broke out to the downside at 01:25 UTC, supported by a crossover of the MACD price spike to the downside, and formed a converging triangle pattern. The converging triangle pattern broke out to the downside at 02:01 UTC, supported by a death crossover of the MACD price spike to the downside, and formed a range.
The range broke out to the upside at 02:20 UTC, supported by a golden crossover of the MACD price spike to the upside, and marked the high at $0.3163, then formed a range. The range broke out to the downside at 03:34 UTC, supported by a death crossover of the MACD price spike to the downside, and formed a second range. The second range again broke out to the downside at 04:01 UTC, supported by a death crossover of the MACD price spike to the downside, and formed a third range.
The third range again broke out to the downside at 04:34 UTC, supported by a death crossover of the MACD, Decentraland price spike to the downside, and marked the low for the day at $0.3064. In the meantime, at 04:45 UTC, RSI dropped below the level of 30, indicating oversold market conditions, suggesting a reversal or at least a pullback. A recovery pushed the price to the upside, and the price formed a range. The range broke out to the upside at 05:42 UTC, supported by a golden crossover of MACD. If the breakout succeeds, then the price may rise to the level of $0.3200. If the breakout fails, then the price may drop to the level of $0.3000.
Choppy Structure Signals Decentraland Coin Uncertainty
The session pointed out that the Decentraland coin does not have strong directional conviction. Both upward and downward attempts at momentum failed to hold for long. Whenever Decentraland broke out, it was quickly stopped or turned around, so the price remained in a choppy and uncertain pattern. The RSI went from overbought to oversold in a very short time, highlighting the quick changes. The recent breakout on the upside is promising, but until it’s confirmed, the market is still weak. It is wise for traders to wait for a firm pattern and stronger movement before buying, as the MANA price keeps swinging in a narrow and unpredictable range.
Decentraland (MANA) Price Analysis June 3, 2025
Decentraland price began the session with bullish momentum, forming an upward-moving channel that pushed RSI into overbought territory, signaling potential exhaustion. Shortly after, the price broke downward and entered a volatile range-trading environment. The initial rally peaked with the high of the day at $0.2889, but the move was unsustainable. A series of failed breakouts and repeated RSI dips below 30 indicated increased selling pressure. After several breakdowns and minor rebounds, the price eventually hit the low of the day at $0.2822, where another range began to form. Currently, the Decentraland price is trading at $0.2843.
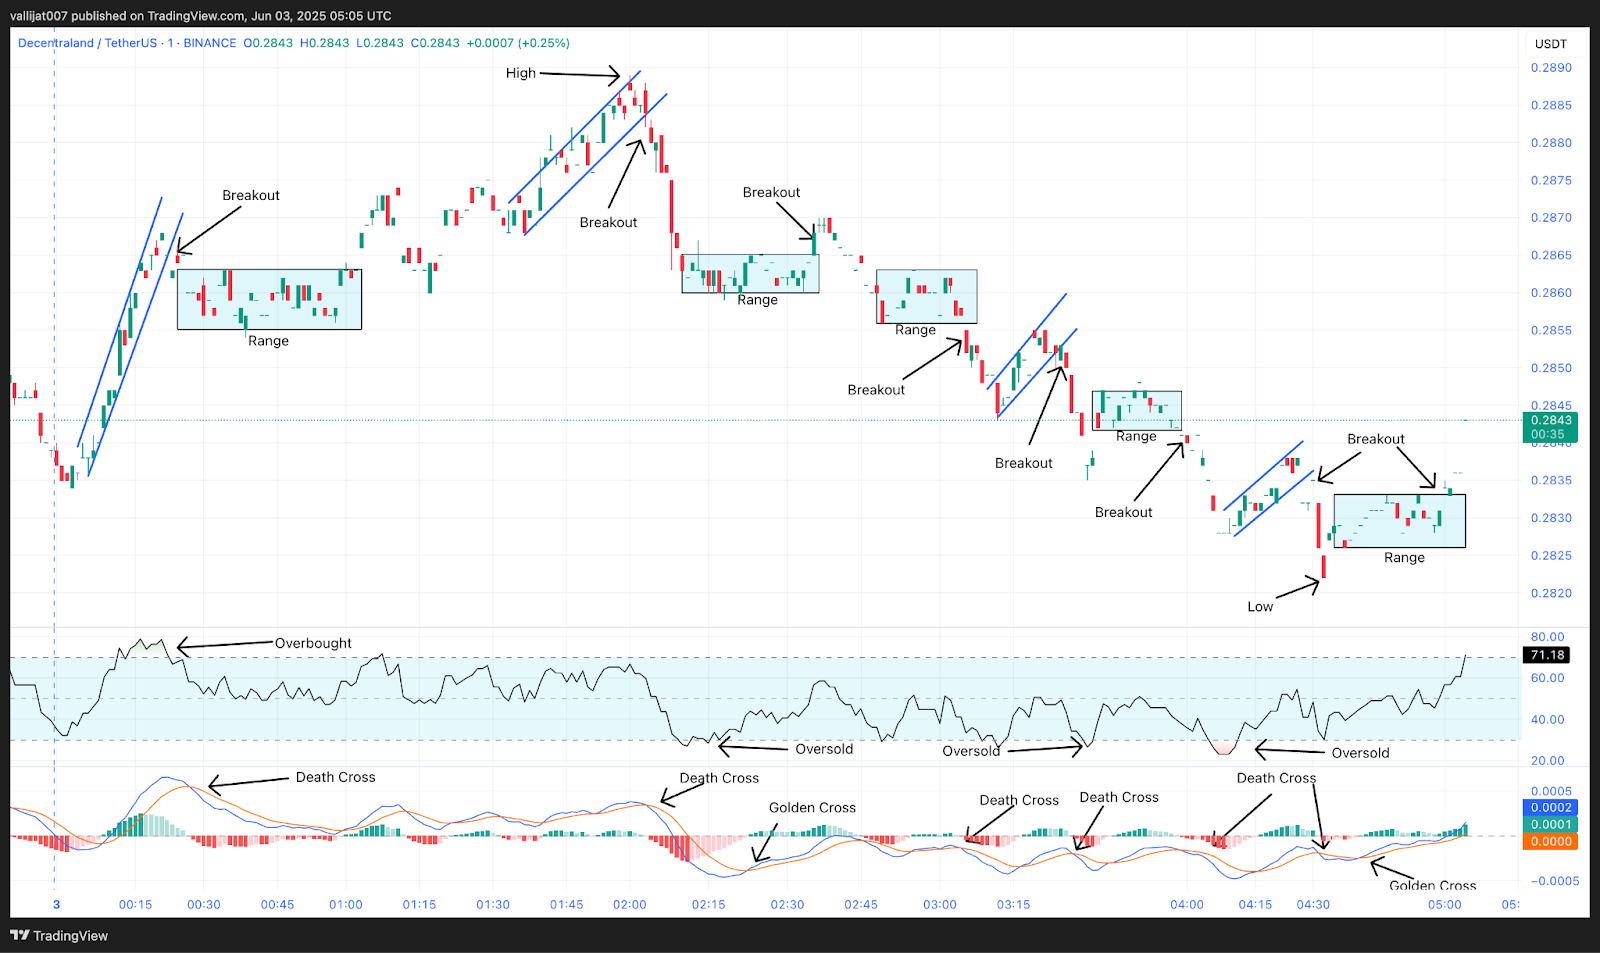
Chart 5: MANA/USDT M1 Chart, Analysed by vallijat007, published on TradingView, June 3, 2025
The Decentraland price formed an upward-moving channel, which pushed the RSI above the level of 70, indicating overbought market conditions and suggesting a reversal or at least a pullback. The upward-moving channel broke out to the downside at 00:24 UTC, supported by a death crossover of MACD, and formed a range. The range broke out to the upside at 01:02 UTC, supported by a golden crossover of MACD. MANA coin spiked to the upside and formed an upward-moving channel, which marked the high for the day at $0.2889.
Death Cross Breakdown Tests $0.2822 Support
Supported by a MACD death crossover, the upward-moving channel broke down to the downside at 02:04 UTC and established a range. RSI fell below the 30 level at 02:11 UTC, showing oversold market circumstances and pointing to either a reversal or at least a pullback. Supported by a golden crossover of MACD, the range broke out to the upside at 02:35 UTC, but the upside breakout failed, and the Decentraland price fell to the downside, forming another range.
The second range broke out to the downside at 03:06 UTC, supported by a death crossover of MACD, and formed an upward-moving channel. At 03:12 UTC, RSI again dropped below 30, indicating oversold conditions and suggesting a reversal or at least a pullback. The upward-moving channel broke out to the downside at 03:27 UTC, supported by a death crossover of MACD, and formed a range. The range broke out to the downside at 04:00 UTC, supported by a death crossover of MACD, and formed an upward-moving channel.
At 04:08 UTC, RSI dropped below the level of 30, again indicating oversold market conditions. The upward-moving channel broke out to the downside at 04:28 UTC, supported by a death crossover of MACD, marking the low for the day at $0.2822. After marking the low, the MANA coin formed a range, which broke out to the upside at 05:00 UTC, supported by a golden crossover of MACD. If the breakout succeeds, then the MANA price may rise to the level of $0.2900. If the breakout fails, then the price may drop to the level of $0.2800.
Range-Bound with Bearish Bias
MANA price action reflects indecision, marked by back-to-back failed breakouts and alternating MACD signals. Oversold RSI levels occurred multiple times during the session, but bulls struggled to reclaim control. If the latest upside breakout holds, price could retest the $0.2900 zone. However, if momentum fails again, sellers may push the token back toward $0.2800. Until a clear breakout is confirmed with volume and trend follow-through, Decentraland is likely to remain stuck in a choppy consolidation phase.
Decentraland (MANA) Price Analysis – June 7, 2025
Decentraland price started the session consolidating in a range, establishing the low of the day at $0.2573. A breakout to the upside triggered an upward-moving channel, but momentum waned, leading to the formation of an expanding triangle. The market repeatedly flashed overbought signals on RSI, indicating hesitation from buyers, especially during two separate instances at 06:15 UTC and 13:45 UTC. Despite attempts to rally, most breakouts showed limited follow-through, turning into further consolidation patterns or reversals. A downward-moving channel formed in the afternoon session, followed by a recovery, and ultimately, the high of the day was reached by the MANA price at $0.2818.
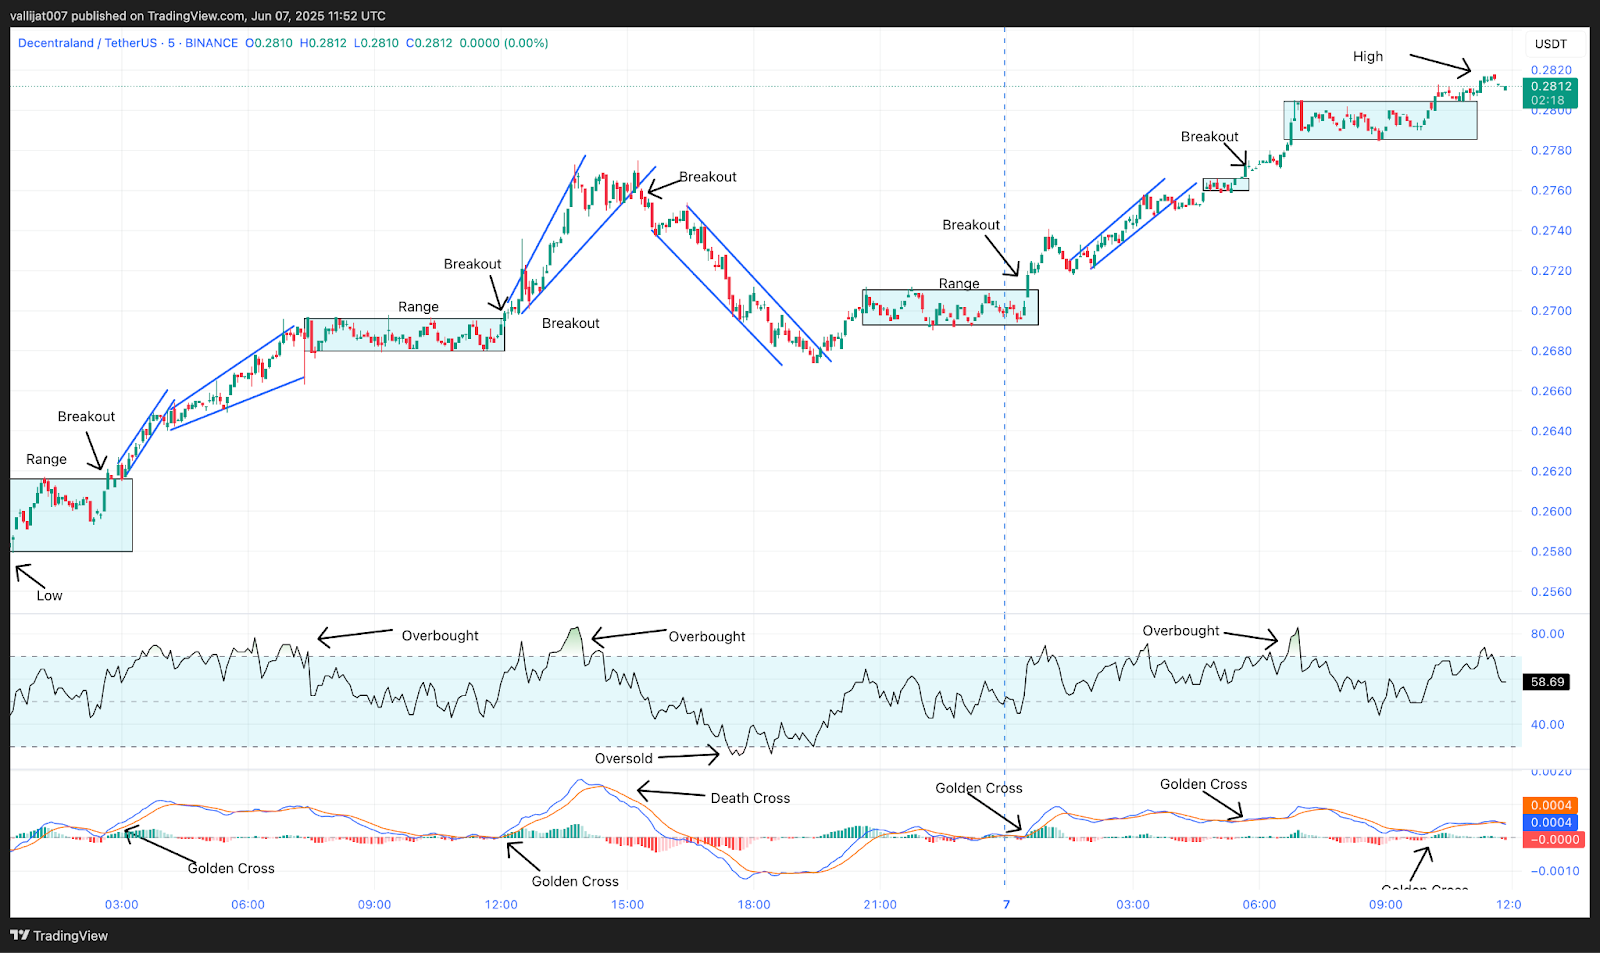
Chart 6: MANA/USDT M5 Chart, Analysed by vallijat007, published on TradingView, June 7, 2025
Decentraland price formed a range, which marked the low for the day at $0.2573. The range broke out to the upside at 02:40 UTC, supported by a golden crossover of MACD, and formed an upward-moving channel. The channel broke out to the downside at 04:05 UTC, supported by a death crossover of MACD, but the momentum soon faded, and the Decentraland price formed an expanding triangle pattern. In the meantime, at 06:15 UTC, RSI moved above the level of 70, indicating overbought market conditions, suggesting a reversal or at least a pullback. The expanding triangle pattern failed to break out in either direction and soon developed into a range.
MANA Breakout Fatigue: Is MANA Building Energy for a Major Move?
The range broke out to the upside at 12:05 UTC, supported by a golden crossover of MACD, and formed another expanding triangle pattern. At 13:45 UTC, RSI again moved above 70, suggesting overbought conditions and a potential reversal. The expanding triangle pattern broke out to the downside at 15:20 UTC, supported by a death crossover of MACD, and formed a downward-moving channel. At 17:40 UTC, RSI dropped below 30, indicating oversold market conditions and suggesting a reversal or at least a pullback.
The downward-moving channel broke out to the upside at 19:40 UTC, supported by a golden crossover of MACD, and formed a range. The range broke out to the upside at 00:30 UTC on 7th June 2025, supported by a golden crossover of MACD, and formed an upward-moving channel. The upward-moving channel attempted to break out to the downside at 04:00 UTC but failed to maintain the trend, and a range developed.
The range broke out to the upside at 05:40 UTC, supported by a golden crossover of MACD, and formed another range. At 06:50 UTC, RSI moved above 70, again suggesting overbought conditions and a potential pullback. The range broke out to the upside at 10:10 UTC, supported by a golden crossover of MACD, marking the high for the day at $0.2818.
$0.2850 Resistance in Sight as MANA Approaches Saturation
MANA price action shows bulls have consistently pushed back from oversold levels, but overbought RSI readings and weak follow-through indicate caution is warranted. The current MANA breakout from the final range suggests renewed bullish momentum, but given the market’s behavior, upside may be limited without stronger volume or broader confirmation. If the current trend sustains, the next resistance at $0.2850 is likely to be tested. However, if momentum fades again, a drop back toward the $0.2600 zone is possible. Traders should monitor RSI and MACD closely, as the market is showing signs of exhaustion near its short-term highs.


