

Are you keeping an eye on DeXe (DEXE) and wondering whether the token is gearing up for its next major move? Then don’t worry, you’re in the right place. Let’s take a closer look at the recent DeXe price action and explore where the latest momentum could lead. While the broader DeFi sector continues to evolve, the DEXE token has shown sharp swings in its early trading history. After a volatile start to the year, it has seen fluctuating volume and mixed sentiment. Since January, DeXe has recorded an approximate 48% decline in value. With that in mind, let’s break down the recent chart activity and examine what technical indicators suggest about the short-term outlook.
DeXe (DEXE) Price Analysis of May 4, 2025
The DEXE price began the day at a price of $13.23. A steady uptrend formed, with the price briefly rising to 13.528 in the early hours. However, a slight correction was seen as a prolonged consolidation phase ensued. From 4:00 UTC to approximately 08:00 UTC, the price worked sideways, forming a narrow range between the support and resistance levels. During this consolidation, the RSI remained just below the midline at 50, signaling limited buying interest. Meanwhile, the MACD formed a death cross around 2:35 UTC, reinforcing the ongoing weakness in momentum. This indecisive movement gave way to a downward trend at 08:30 UTC as bearish pressure intensified.

Chart 1: analyzed by raodevansh18, published on TradingView, May 4, 2025
The downtrend pushed the price action down toward the $13 support zone. The RSI dipped heavily into the oversold territory during this decline, hinting at a bullish reversal. By 12:45 UTC, a strong reversal had taken shape, taking the price up to $13.337 by 17:10 UTC. The MACD formed a wide golden cross as bullish momentum returned with force. Simultaneously, the RSI began surging upward, highlighting renewed interest from buyers. This led to a sharp DEXE breakout as the price pierced past its earlier range. The uptrend continued to build strength throughout the afternoon, with the DEXE token climbing in a structured manner, each pullback finding support at higher levels.
By evening, the RSI touched the overbought zone, while the MACD lines remained bullish. Despite the RSI working close to the overbought zone, momentum remained strong, with price peaking just below the $14.5 resistance mark. However, this zone served as a ceiling for the upward momentum. Around 21:00 UTC, the MACD formed a bearish crossover, and the RSI began to flatten near 70, suggesting the uptrend was losing steam. A brief consolidation phase followed, though the price held firm above $14. A second DEXE breakout attempt occurred near midnight, yet once again, sellers defended the $14.5 mark. Though the MACD hinted at short-term weakness with another death cross, the price didn’t lose significant ground, showing strength in consolidation. The RSI hovered close to the overbought during this period, indicating strong buying momentum.
What Do Technical Indicators Reveal About DEXE?
The MACD indicator has seen some exciting action in the last 24 hours, with rapid interaction between the EMAs. The price has also followed suit, showcasing strong trends and momentous spikes. The RSI has also supported upward trends, rising with the buying momentum but not venturing into the overbought zones. Even as of now, after an extended uptrend, the RSI hasn’t decisively gone above 70. The overall trend looks bullish. However, future action will depend on whether DEXE can make a decisive breakout above the $14.57 resistance.
Short-Term Outlook for DEXE Price
In the immediate term, the price faces a make-or-break moment near $14.5. A confirmed DEXE breakout above this resistance, ideally supported by volume and a golden MACD cross, could open the door for a push toward $15. However, failure to breach this level convincingly may lead to a retracement toward the $13.7–$14 support level. The RSI remains elevated, and any dip without price advancement may trigger short-term selling. Bulls need to maintain momentum or risk a return to the neutral range. Traders should watch for RSI divergence and the next MACD signal for clearer direction in the DEXE token’s performance.
DEXE (DEXE) Price Analysis for May 18
DEXE managed considerable bullish pressure early in the session. However, strong resistance has been seen at $13.28. Rejection from this level has led to a strong decline, leading DEXE to find support at $12.620. The trading session for the DEXE token began with the price at $12.79. The price declined in a clear descending channel, going to $12.516 by 3:20 UTC. This downward-sloping pattern reflected selling pressure, with the DEXE price making lower highs and lower lows.
Supporting the bearish sentiment, the MACD indicator flashed two death crosses, and the RSI remained below the midline, confirming a weak momentum phase. Despite the continuous decline, the DEXE token began showing signs of a reversal as the price approached the green support zone. A golden cross on the MACD marked the beginning of a potential trend shift. This was soon followed by a powerful breakout move.
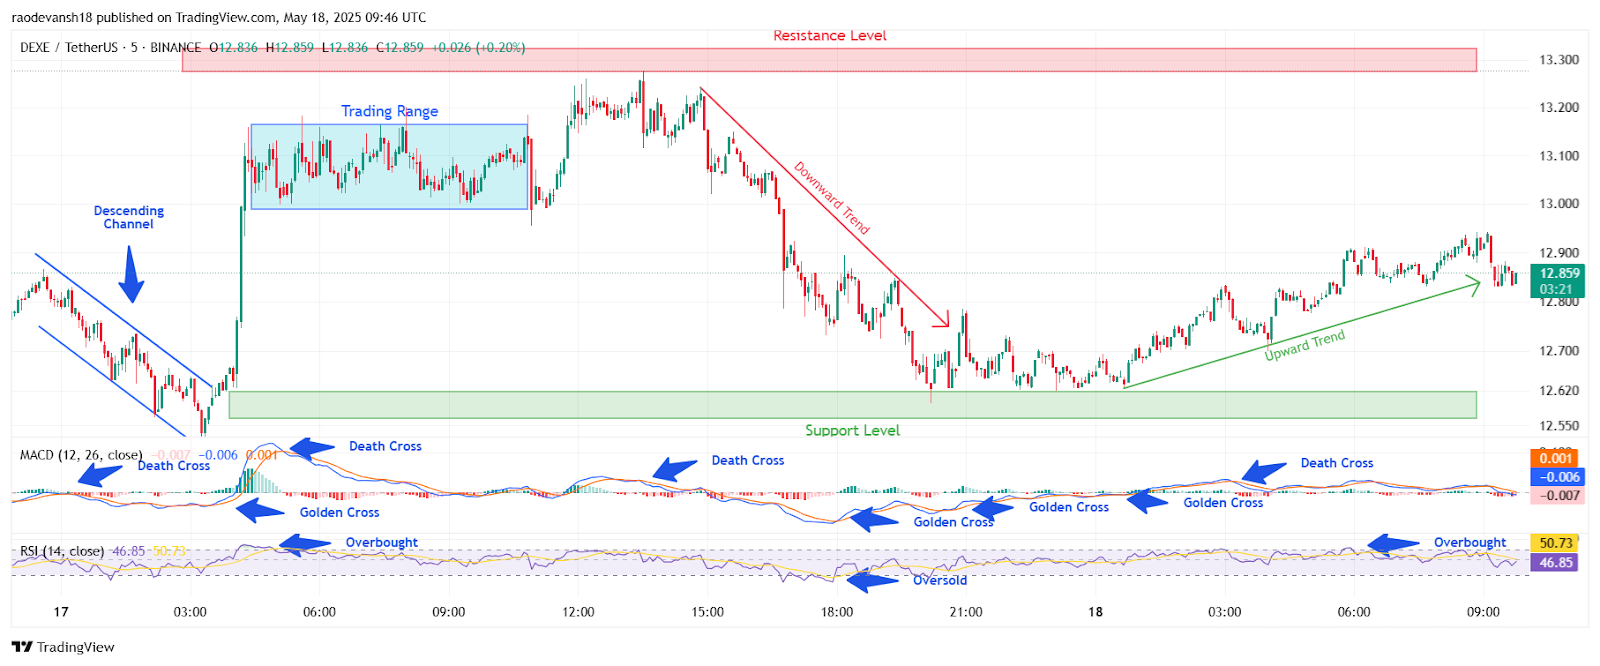
DEXE/USDT, M-5 Chart, analzyed by raodevansh18, published on TradingView, May 18, 2025
Strong DEXE Breakout from Channel Launches into Trading Range
Once the descending channel was invalidated, the DEXE price exploded upward, jumping sharply to $13.125 from the support area at $12.62. This sudden move signaled a strong DEXE breakout, backed by bullish volume and momentum. The MACD histogram flipped positive, and the RSI shot into the overbought zone, further confirming the breakout’s strength. After the rally, the price entered a consolidation phase within a horizontal trading range. This range-bound movement between roughly $12.78 and $13.05 allowed the market to absorb the sharp gains.
During this phase, RSI gradually cooled off, and the MACD flattened, showing reduced volatility and buyer exhaustion. The end of the trading range marked a new downward trend, with the DEXE price declining steadily. This retracement formed lower highs and lower lows, once again pulling the RSI toward the oversold region. MACD confirmed weakening conditions by generating another death cross. However, the decline was not steep enough to break below the previous support zone, indicating underlying strength. The DEXE token found a base around $12.60, the same area that had triggered the earlier breakout, and started to stabilize.
Recovery and Gradual Uptrend in DEXE Price
After consolidating at the support level, the DEXE price initiated a gradual upward trend, climbing consistently above $12.70 and establishing a higher low formation. This recovery was confirmed by three golden crosses on the MACD and a rise in RSI, which crossed above 50, indicating bullish momentum returning.
The recent highs near $12.90 suggest that the DEXE token may be positioning for another DEXE breakout, especially if it breaks and closes above the short-term resistance at $12.95. The RSI is currently hovering around neutral territory, and the MACD lines are tightening, hinting at a potential breakout scenario.
DEXE Token Looks Ready for Next Leg if Resistance Breaks
The DEXE price has displayed textbook technical behavior, with a clean breakout from a descending channel, followed by consolidation, a pullback, and now a recovery. The support zone at $12.60 has held strong, and the price has respected key technical signals such as MACD crossovers and RSI levels.
Traders will look for a confirmed DEXE breakout above $12.95 to $13.00, which could set the stage for a move toward the higher resistance zone near $13.30. However, failure to breach this resistance could lead to renewed consolidation. Either way, the DEXE token is showing resilience and remains technically promising.


