

Dogecoin traded within a wide range, producing multiple minor trends that lacked strong follow-through. The price surged after marking a daily low to form an expanding triangle pattern, peaking near $0.1828. RSI entered overbought territory, signalling potential exhaustion. The expanding triangle eventually broke to the downside, sending the price back toward $0.1740, where a support zone developed. Later, a converging triangle formed and broke upward, followed by another minor breakout from a downward-moving channel. Despite volatility, Dogecoin’s price behavior remained confined within a larger, unstable trading range throughout the session. Let’s take a look at the Dogecoin price analysis to see how it is traded within the extensive range.
Dogecoin Price Analysis for April 29, 2025
After marking the day’s low, Dogecoin moved to the upside and formed an expanding triangle pattern, which marked the day’s high at $0.1828 at 06:40 UTC. RSI moved above 70, indicating overbought market conditions and suggesting a reversal or at least a pullback in the ongoing uptrend. The expanding triangle broke out to the downside at 13:30 UTC, supported by a Death Cross of MACD. The DOGE price dropped to its previous level, creating a support zone at $0.1740. In the meantime, RSI dropped below the level of 30.

Chart 1: Analysed by vallijat007, published on TradingView, April 29, 2025
That indicates oversold market conditions and suggests a reversal or pullback. A converging triangle pattern appeared in Dogecoin, which broke out to the upside at 18:45 UTC, supported by a Golden Cross of MACD. The DOGE price spiked to the upside and formed a downward-moving channel, which again broke out at 21:50 UTC, supported by a Golden Cross of MACD. Dogecoin trades in an extensive range, where minor trends develop within the range but are not sustained for long. This is clearly seen in Dogecoin’s price action.
Failed Breakout Risks Rangebound Trading — What’s Next?
A minor range appeared in the early hours of the day, which broke out to the downside at 01:50 UTC, supported by a Death Cross of MACD. If the Dogecoin breakout succeeds, then Dogecoin may drop to its support level of $0.1740. If the Dogecoin breakout fails, then Dogecoin might try to break its high of $0.1828. For Dogecoin to surpass these two critical levels of support and resistance at $0.1740 and $0.1828, respectively, it is essential to establish a strong trend. If Dogecoin fails to break these two critical levels, then Dogecoin might trade in a range.
Critical Levels Define Dogecoin’s Next Move
The Dogecoin price moves between its essential support level at $0.1740 and resistance point at $0.1828. Trading directional positions requires sound confirmation because repeated minor breakouts in Dogecoin failed to convince traders to proceed with their trades. Dogecoin price action displays uncertain behaviour according to the RSI and MACD indicators, which reflect the general market indecision. Dogecoin will remain within this wide trading band until it validates a breakout point. Traders should monitor both key levels while placing any trade, and should be cautious if any low-volume breakout happens.
Dogecoin Price Analysis for May 1, 2025
Dogecoin opened the session by marking a high near $0.17665, establishing a resistance zone around $0.17600. A breakdown occurred at 12:35 UTC from a downward-moving trendline, supported by a Death Cross of MACD, sending the price to the session low at $0.16675. RSI dropped below 30, signaling oversold conditions and prompting a rebound. Price action formed an expanding triangle, which broke to the upside at 17:35 UTC, backed by a Golden Cross. A subsequent downward channel also broke higher, creating another expanding triangle. Let’s look closer at Dogecoin price analysis to see how strong the patterns were to push the price higher or lower.
Double Golden Cross vs Overbought RSI at $0.176
Dogecoin price marked the high for the day at $0.17665 and created a resistance zone at $0.17600. At 12:35 UTC, the price broke out to the downside from a downward-moving trend channel line, supported by a Death Cross of MACD. Price spiked to the downside and marked the low for the day at $0.16675. In the meantime, RSI dropped below 30, indicating oversold market conditions, suggesting a reversal or a pullback. After marking the low, the price moved to the upside and formed an expanding triangle pattern, which broke out to the upside at 17:35 UTC, supported by a Golden Cross.

Chart 2: Analysed by vallijat007, published on TradingView, May 1, 2025
The Dogecoin breakout from the expanding triangle formed a downward-moving channel, which again broke out to the upside at 19:45 UTC, supported by a Golden Cross of MACD. Doge price spiked to the upside and formed another expanding triangle pattern. In the meantime, at 20:10 UTC, RSI moved above 70, indicating overbought market conditions and suggesting a reversal or at least a pullback in the ongoing upward movement of Dogecoin. Dogecoin is in an extensive trading range, where small breakouts can hit their target price before reversing to the other side.
DOGE Charts Show Consecutive Bullish Patterns – How High Can It Go?
The expanding triangle pattern formed yesterday broke out to the upside at 00:45 UTC, supported by a Golden Cross of MACD. Doge price spiked to the upside and formed a converging triangle pattern. The converging triangle broke out to the upside at 04:50 UTC, supported by a Golden Cross of MACD. If the upside Dogecoin breakout succeeds, the price may reach the resistance level of $0.17600. On the other hand, if the resistance level of $0.17600 breaks with momentum, then Dogecoin could rise to $0.18050. If the breakout fails, then Dogecoin might mark another low below the level of $0.16650.
DOGE Testing Resistance With Caution Advised
Dogecoin price remains inside a broad trading range, showing repeated breakout and reversal patterns. A recent upside breakout at 00:45 UTC led to a converging triangle, which also broke to the upside at 04:50 UTC. If momentum holds, DOGE may retest the $0.17600 resistance level. A confirmed breakout above that level could trigger a move toward $0.18050. However, if the breakout fails, the price may revisit the support near $0.16650. Momentum indicators are mixed, suggesting traders should remain cautious and seek confirmation before entering positions. Range trading remains the dominant theme until a decisive breakout emerges.
Dogecoin (DOGE) Price Analysis of May 5, 2025
Dogecoin began the session with a high of $0.17744 before slipping lower and establishing a support zone at $0.17500. Early signs of weakness emerged as RSI dropped below 30 at 04:55 UTC, signaling oversold conditions and hinting at a possible reversal. However, momentum stayed weak, and the support level gave way at 08:30 UTC, triggering a deeper sell-off supported by a Death Cross of the MACD. A downward-moving channel formed, marking the low for the day at $0.16834. Despite multiple intraday bounces, MACD repeatedly issued bearish signals, suggesting sellers retained control and that price action remained under pressure.

Chart 3: DOGE/USDT M5, Analysed by vallijat007, published on TradingView, May 5, 2025
After marking a high for the day at $0.17744, Dogecoin slid to the downside and formed a support area at $0.17500. In the meantime, at 04:55 UTC, RSI dropped below 30, indicating oversold market conditions and suggesting a potential reversal or at least a pullback. The support area broke to the downside at 08:30 UTC, supported by a Death Cross of the MACD, and the DOGE price spiked lower, forming a downward-moving channel. The channel marked the low for the day at $0.16834. This channel had multiple swing points, all accurately signaled by MACD.
Will $0.1750 Resistance Hold or Fold?
The second Death Cross in MACD occurred at 11:55 UTC and forced the DOGE price to drop to $0.17200. Shortly after recovering, the Dogecoin price declined again through the 15:20 UTC Death Cross event, sending it to $0.17150. The price exhibited another temporary rally during 21:55 UTC before MACD generated a bearish crossover along with a price decline until 22:30 UTC. The RSI continued to show oversold conditions when it fell below 30 a second time, thus hinting at a possible price reversal or market retrenchment. The price penetrated the top of the decreasing channel before it finally moved higher.
Dogecoin could advance toward $0.17500 if its price breakout succeeds since this stands as its important short-term resistance level. Successful price movements above the resistance level could draw new investors while increasing the short-term market price. Dogecoin may drop toward $0.16600 after a failed breakout attempt, while prices hold up at this level as the next primary Dogecoin support region. The current Dogecoin price fluctuations indicate weak momentum because MACD generates repeated bearish signals, and RSI signals that the market dips into oversold areas.
This divergence suggests the asset is nearing an inflexion point where either a short-term relief rally will begin or sellers will retake control to push Dogecoin prices lower. Traders should watch the $0.17500 resistance closely. A confirmed breakout above this level with supporting volume could shift momentum in favor of the bulls. Until then, Dogecoin remains vulnerable to further downside, especially if Bitcoin and the broader market stay weak. Patience is key in this range-bound environment, with a focus on reliable confirmations before entering new positions.
Can Breakout Hold or Will Bears Prevail?
Dogecoin price is approaching a crucial juncture because its price has escaped from a bearish moving channel formation. The repeated bearish MACD crossings combined with ongoing oversold RSI indicators indicate potential weakening in any upcoming upward movement. The DOGE price needs to surpass $0.17500 before reaching its main resistance point, while $0.16600 serves as the next Dogecoin support point if the breakout proves unsuccessful. Dogecoin follows the path of Bitcoin because the overall market stay uncertain. Trading positions after a breakout should only occur when verification is clear because misleading breakouts exist as a major market threat.
Dogecoin (DOGE) Price Analysis of May 9, 2025
Dogecoin price opened the session with a defined range that set the day’s initial low. The range broke to the upside early, supported by a golden crossover of the MACD, and price spiked higher into an upward-moving channel. Shortly after, the RSI entered overbought territory, signaling a potential reversal or short-term pullback. As expected, the channel broke down, led by a death crossover on the MACD, but follow-through was weak, and a range emerged instead. This cycle repeated throughout the day, range breakouts to the upside, upward channels, and brief pullbacks, all underpinned by alternating MACD crossovers and RSI shifts. Despite multiple pullbacks, the DOGE price consistently found strength, forming a series of bullish structures.

Chart 4: DOGE/USDT M5 Chart, Analysed by vallijat007, published on TradingView, May 9, 2025
Dogecoin price formed a range, which marked the low for the day at $0.17173. The range broke out to the upside at 00:55 UTC, supported by a golden crossover of MACD. Price spiked to the upside and formed an upward-moving channel. In the meantime, at 01:25 UTC, RSI moved above the level of 70, indicating an overbought market condition, suggesting a reversal or at least a pullback.
The upward-moving channel broke out to the downside at 04:50 UTC, supported by a death crossover of MACD. The DOGE price spiked to the downside but failed to follow through; instead, a range appeared. The range broke out to the upside at 06:55 UTC, supported by a golden crossover of MACD. Price spiked to the upside and formed an upward-moving channel.
Can Bulls Sustain Momentum Above $0.1950?
The second channel went higher, reversing downwards at 11:10 UTC on the tailing of the death crossover of the MACD, but the reversed Dogecoin breakout to the downside failed, and a new range appeared in the Dogecoin price. This range broke out to the upside at 14:25 UTC, supported by a golden crossover of MACD. Price spiked to the upside and formed an upward-moving channel. The upward-moving channel broke out to the downside at 16:25 UTC, supported by a death crossover of MACD, but the price failed to form a spike; instead, another range appeared.
Meanwhile, at 15:45 UTC, RSI crossed above the level of 70, suggesting that the market was overbought and there could be a reversal or even pullback. The third range once again displayed an upward Dogecoin breakout at 20:25 UTC, supported by a golden crossover of MACD. The Dogecoin price spiked to the upside, forming an upward-moving channel. This upward-moving channel again broke out to the downside at 21:35 UTC, supported by a death crossover of MACD. Price spiked to the downside and formed a small range. The small range again broke out to the upside at 22:45 UTC, supported by a golden crossover of MACD.
Price spiked to the upside and marked the high for the day at $0.19840. The upward-moving channel from the Dogecoin breakout again broke out to the downside at 00:05 UTC, supported by a death crossover of MACD. Price spiked to the downside and formed a range. There is a high chance that the range again breaks out to the upside and price forms a spike and a general trend. If instead the range breaks out to the downside, there are higher chances that the Dogecoin price may develop a consolidation phase.
Can Dogecoin Sustain the Trend, or Will It Consolidate?
Dogecoin’s price behavior throughout the session reflected strong bullish momentum, interrupted by frequent but shallow corrections. This repeated breakout and channel formation pattern indicates a healthy trending environment, with buyers stepping in consistently on dips. However, as the session closed, price entered yet another range following a breakdown from the most recent upward channel. If this range breaks to the upside, Dogecoin could resume its rally and continue forming new highs. Conversely, a breakdown from the range could signal the start of a broader consolidation phase. The next breakout, whether up or down, is likely to define the near-term trend.
Dogecoin (DOGE) Price Analysis of May 13, 2025
Dogecoin displayed a strong trending session marked by a clear sequence of breakouts that largely hit their targets. The Dogecoin price began with an upward-moving trendline and reached its intraday high, but overbought RSI conditions hinted at a pullback. That signal proved accurate, as the market transitioned into a series of breakdowns, from ranges to channels, each confirmed by MACD death crossovers. As selling pressure intensified, the Dogecoin price continued forming and breaking structures to the downside. Despite a brief appearance of support and upward channels, oversold RSI levels pointed to a struggling rebound. The session closed with new lows and a key Dogecoin support zone in focus.
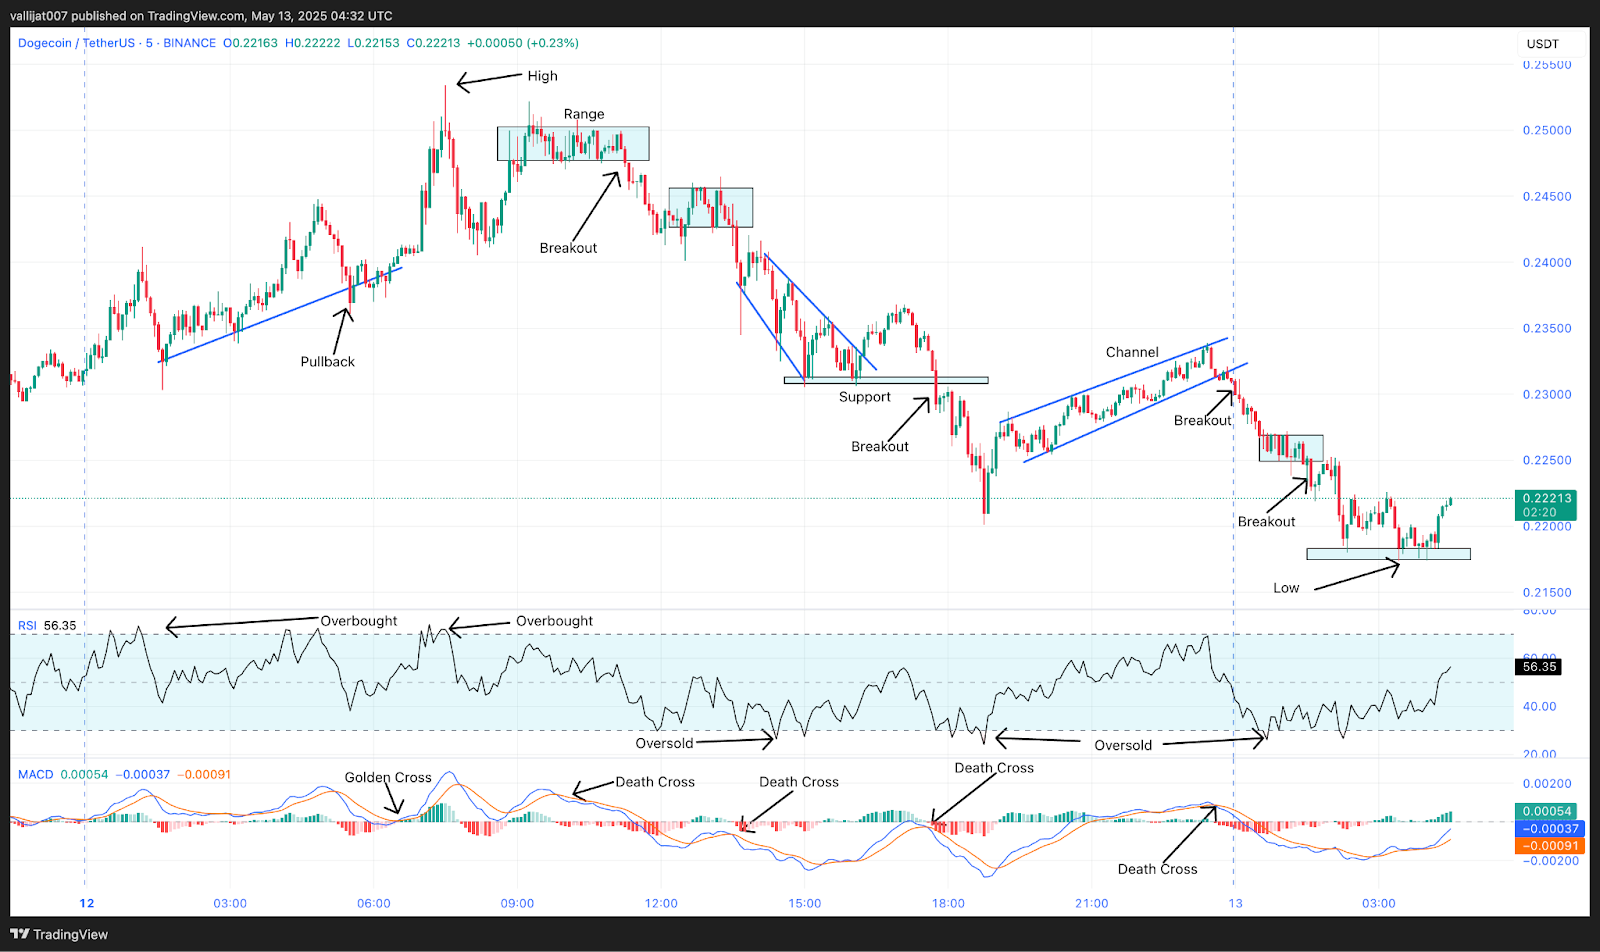
Chart 5: DOGE/USDT M5 Chart, Analysed by vallijat007, published on TradingView, May 13, 2025
Dogecoin price showed an upward-moving trendline. The trendline had a pullback at 05:30 UTC, which again rose to the upside, marking the high for the day at $0.25340. In the meantime, RSI was above the level of 70, indicating an overbought market condition, suggesting a reversal or at least a pullback. A range appeared near the day’s high. The range broke out to the downside at 11:15 UTC, supported by a death crossover of MACD. The DOGE price spiked to the downside and formed another range.
Dogecoin Price Hits $0.21735 Low, Eyes $0.218 Support Hold
This range also broke out to the downside at 13:35 UTC, supported by a death crossover of the MACD. Price moved further to the downside and formed a downward-moving channel. Price created a support area at the level of $0.23100. The support broke to the downside at 17:45 UTC, supported by a death crossover of the MACD. The DOGE price spiked to the downside but failed to sustain the downward momentum, and an upward-moving channel appeared.
In the meantime, at 18:40 UTC, RSI dropped below the level of 30, indicating an oversold market condition, suggesting a reversal or at least a pullback. The upward-moving channel broke out to the downside on 13 May 2025, supported by a death crossover of MACD. Price moved to the downside and formed a small range. In the meantime, at 00:40 UTC, RSI again dropped below the level of 30, indicating an oversold market condition, suggesting a reversal or at least a pullback.
The small range broke out to the downside at 01:35 UTC, supported by a death crossover of the MACD. Price spiked to the downside, marking the low for the day at $0.21735 and creating a support area at the level of $0.21800. If Dogecoin maintains its support area of $0.21800, then it may rise to the level of $0.23500. If the Dogecoin support area breaks to the downside, then Dogecoin might drop to the level of $0.20000. Dogecoin shows a strong trend day, with most of the breakouts reaching their targets.
Dogecoin Price Under Pressure as Bears Maintain Control Below $0.22
The Dogecoin price action has been dominated by consistent downside moves, with technical patterns playing out cleanly across the session. Bearish momentum was persistent, with each breakdown confirming sellers’ control. Although RSI signaled oversold conditions multiple times, any recovery attempt lacked strength and failed to reverse the trend. A hold here could trigger a rebound, while a breakdown may open the path to deeper losses for long investors. Traders should monitor RSI, MACD, and volume closely for confirmation. With trend-following setups proving reliable today, the next move could extend the prevailing direction.
Dogecoin (DOGE) Price Analysis of May 17, 2025
Dogecoin’s session began with indecision and false signals, as early breakout attempts repeatedly failed to generate meaningful moves. A downside break from a converging triangle was quickly reversed, leading to a brief upward-moving channel that also lacked follow-through. This back-and-forth pattern continued through multiple channels and triangle formations, each accompanied by MACD crossovers but minimal momentum. After reaching the day’s high, the trend gradually shifted bearish, culminating in a sharp drop within a downward channel that marked the session’s low. Despite a late upside Dogecoin breakout attempt, momentum indicators like RSI remained neutral, reflecting the broader market’s lack of conviction.
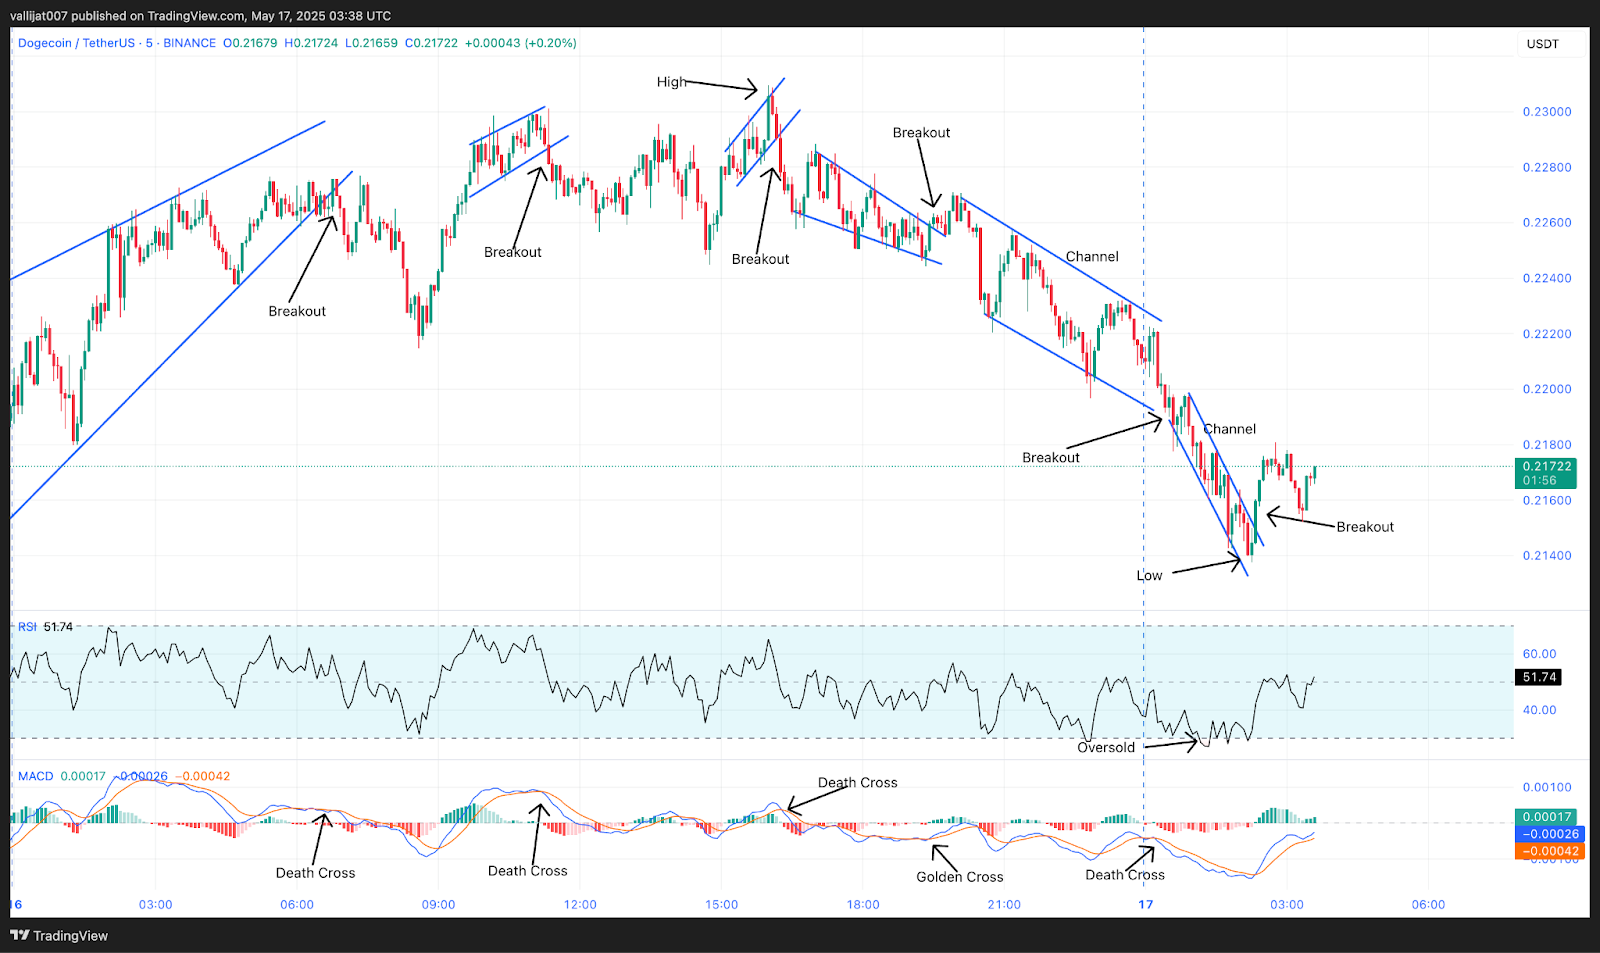
Chart 6: DOGE/USDT M5 Chart, Analysed by vallijat007, published on TradingView, May 17, 2025
A converging triangle pattern appeared in Dogecoin price, which broke out to the downside at 07:00 UTC, supported by a death crossover of the MACD. Price spiked to the downside but failed to have a follow-through. Instead, the price rose to the upside and formed an upward-moving channel. The upward-moving channel again broke out to the downside at 11:20 UTC, supported by a death crossover of MACD, but the DOGE price failed to have a follow-through. Instead, the price again rose to the upside, marking the high for the day at $0.23095.
Weekend Volatility Drop: Consolidation Likely After Bearish Push
An upward-moving channel again appeared in the Dogecoin price, which broke out to the downside at 16:15 UTC, supported by a death crossover of MACD. Price spiked to the downside and formed a converging triangle pattern. The converging triangle pattern broke out to the upside at 19:30 UTC, supported by a golden crossover of MACD. Price failed to have a spike and again dropped to the downside and formed a downward-moving channel.
The downward-moving channel again broke out to the downside at 00:35 UTC, supported by a death crossover of MACD on 17th May 2025. The Dogecoin price dropped to the downside in a channel. The channel marked the low for the day at $0.21376. The downward-moving channel broke out to the upside at 02:20 UTC, supported by a golden crossover of MACD. If the breakout succeeds, then Dogecoin may rise to the level of $0.23000, and if the breakout fails, then the price may drop to the level of $0.21000.
RSI meandered between its base levels of 70 and 30 for most of the time. Dogecoin tried to consolidate in the first half of the day, but as the day progressed, bearish momentum built up, pushing the DOGE price lower. As momentum drops over the weekend, there is a chance that Dogecoin may consolidate. Traders and investors should be cautious before placing a trade in a consolidation phase of the market.
Dogecoin Hovers in Uncertain Territory
Dogecoin price closed the session with weakening momentum and a structure dominated by failed breakouts and shallow reversals. While the early half suggested possible consolidation, bearish pressure grew throughout the day, driving the Dogecoin price toward key support. Even with an upside Dogecoin breakout from the latest downward channel, follow-through remains uncertain. RSI hovered near its base levels, hinting at indecision rather than trend strength. As the weekend sets in and overall market activity slows, Dogecoin may remain in a tight consolidation range. Traders should avoid chasing breakouts and instead wait for a confirmed move backed by volume and momentum before committing to a direction.
Dogecoin (DOGE) Price Analysis of May 24, 2025
Dogecoin price traded within a tightly reactive technical structure during the session, displaying multiple failed breakouts and limited follow-through in either direction. After setting the session low at $0.22355, the price formed a converging triangle pattern, which broke down but quickly reversed. A sequence of ranges, triangles, and channels followed, each accompanied by MACD crossovers and sharp but brief price moves. While price action climbed to mark the session high at $0.23041, overbought RSI conditions signaled an imminent pullback. A subsequent downside Dogecoin breakout from the upward channel confirmed weakening momentum, with RSI later indicating oversold conditions as a potential reversal point.
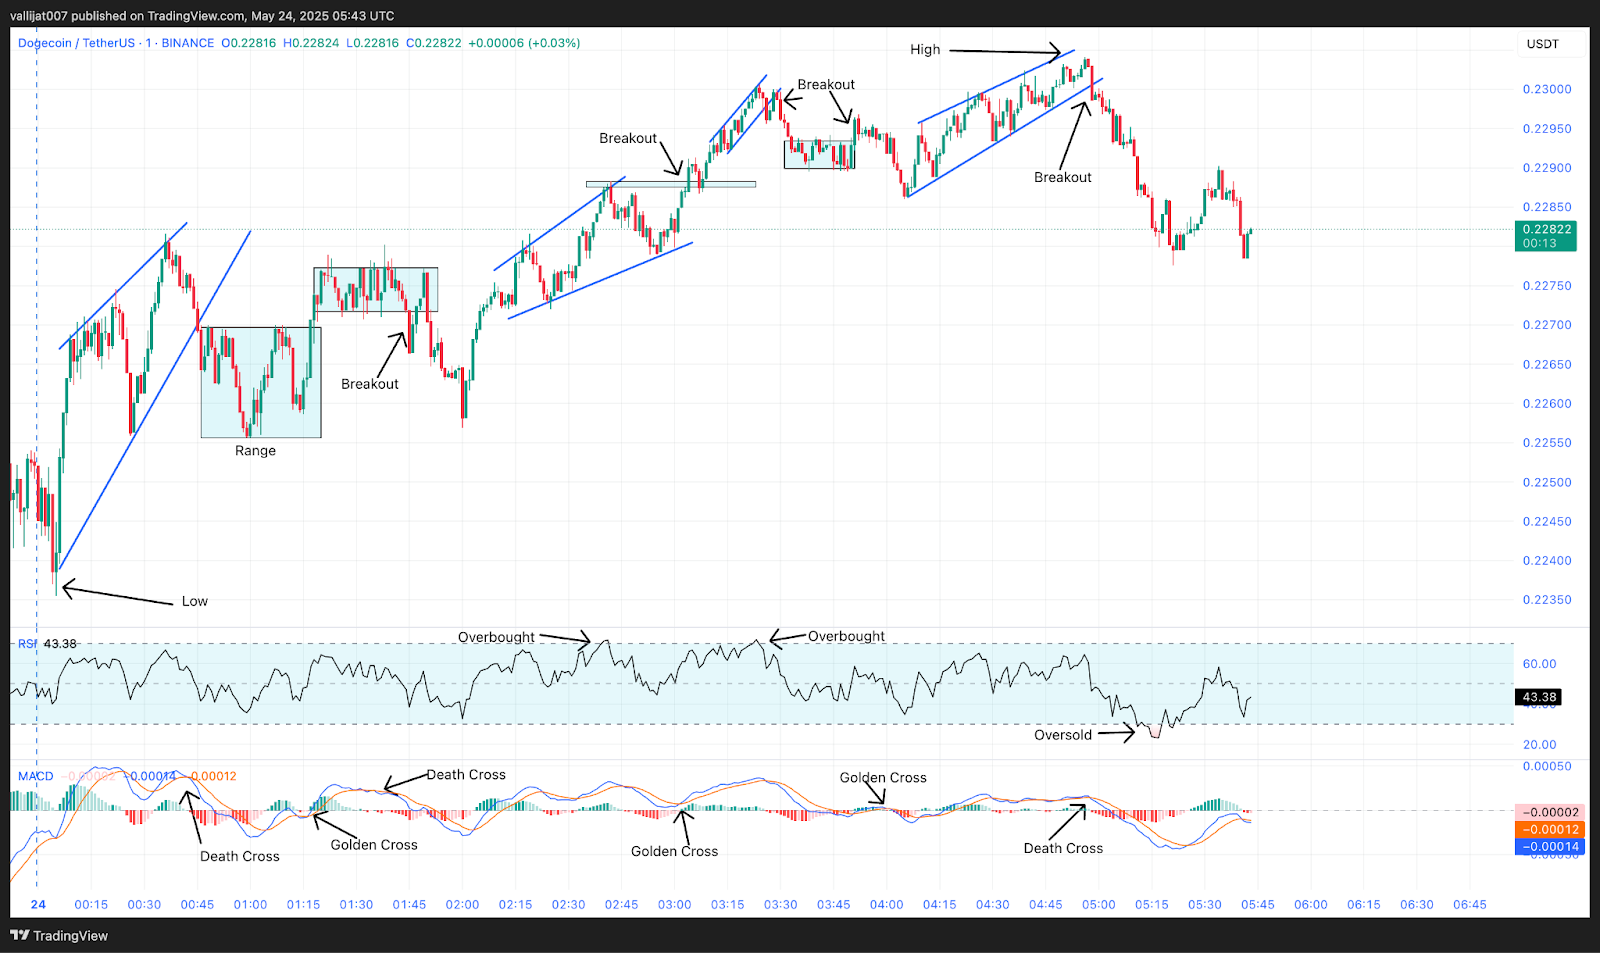
Chart 7: DOGE/USDT M1 Chart, Analysed by vallijat007, published on TradingView, May 24, 2025
After marking the low for the day at $0.22355, Dogecoin formed a converging triangle pattern. The converging triangle pattern broke out to the downside at 00:46 UTC, supported by a death crossover of MACD. Price spiked to the downside and formed a range. The range broke out to the upside at 01:18 UTC, supported by a golden crossover of MACD. Price spiked back to the upside and formed another range. The second range broke out to the downside at 01:45 UTC, supported by a death crossover of MACD, but the downside breakout failed, and an expanding triangle pattern appeared in the price.
Failed Triangle Breakout at $0.22875 Resistance
The expanding triangle pattern failed to break out to either side and formed a resistance area at $0.22875. The resistance broke out to the upside at 03:04 UTC, supported by a golden crossover of MACD. The Dogecoin price spiked to the upside and formed an upward-moving channel. In the meantime, at 03:23 UTC, RSI moved above the level of 70, indicating overbought market conditions, suggesting a reversal or at least a pullback.
The upward-moving channel broke out to the downside at 03:30 UTC, supported by a death crossover of MACD. Price spiked to the downside and formed a small range. The range broke out to the upside at 03:51 UTC, supported by a golden crossover of MACD, but the upside Dogecoin breakout failed, and an upward moving channel appeared in the DOGE price.
The upward-moving channel marked the high for the day at $0.23041. The upward-moving channel broke out to the downside at 04:58 UTC, supported by a death crossover of MACD. Price spiked to the downside. In the meantime, at 05:16 UTC, RSI moved below the level of 30, indicating oversold market conditions, suggesting a reversal or at least a pullback. If the breakout succeeds, then Dogecoin may drop to the level of $0.22300. If the breakout fails, then the price may rise to the level of $0.23200.
Dogecoin on Edge as Market Awaits Direction
The Dogecoin price ended the session in a tight tug-of-war between buyers and sellers, with technical patterns unfolding back-to-back but rarely sustaining momentum. Most breakouts, both upward and downward, were short-lived, reinforcing the choppy and indecisive nature of the market. With RSI now in oversold territory and the DOGE price near key support, the next move hinges on whether sellers can extend the breakdown or if buyers step in for another recovery. A successful downside continuation could drive the price toward $0.22300, while a failed breakdown may lead to a retest of $0.23200 resistance. Until confirmed, expect more consolidation within this narrow band.
Dogecoin (DOGE) Price Analysis of June 1, 2025
Dogecoin’s session opened with bearish momentum, as the price emerged from a downward channel before falling into a range-bound pattern. Despite an early breakout attempt to the upside, sellers quickly regained control, breaking a support zone and driving the price lower. Oversold RSI signals emerged early, hinting at a potential reversal. However, the follow-through was inconsistent, as Dogecoin price action shifted between short-lived ranges and expanding triangle structures. Golden and death MACD crossovers triggered frequent but weak Dogecoin breakouts, reflecting a market lacking conviction. With both bulls and bears unable to hold ground, Dogecoin remained volatile, reacting to technical levels without clear direction.
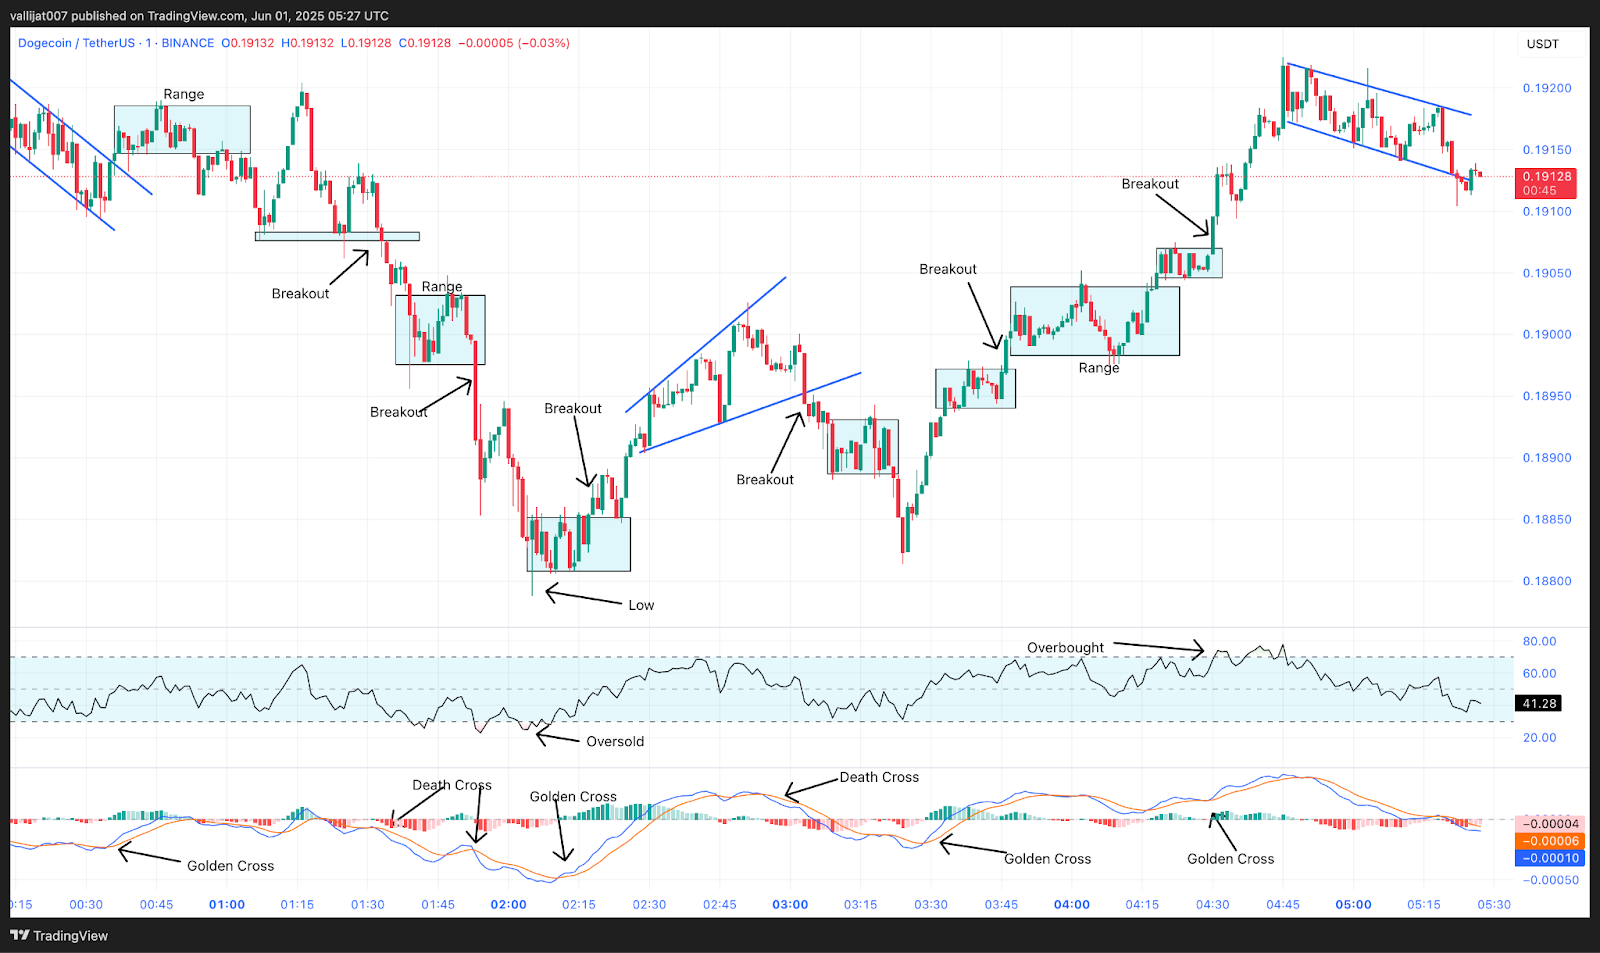
Chart 8: DOGE/USDT M1 Chart, Analysed by vallijat007, published on TradingView, June 1, 2025
A downward-moving channel appeared in Dogecoin price, which broke out to the upside at 00:36 UTC, supported by a golden crossover of MACD. Price moved up and formed a range. The range broke out to the downside at 00:53 UTC, supported by a death crossover of MACD, and formed a support area at the level of $0.19080. The Dogecoin price broke this support area to the downside at 01:34 UTC, supported by a death crossover of MACD, and formed a range.
Expanding Triangle Breakdown Fails to Sustain
In the meantime, at 01:40 UTC, RSI dropped below the level of 30, indicating oversold market conditions and suggesting a reversal or at least a pullback. The range broke out to the downside at 01:53 UTC, supported by a death crossover of MACD, marking the low for the day at $0.18788. At 02:05 UTC, RSI again dropped below 30, reinforcing oversold conditions and potential for a rebound.
The price established a range after marking the low, which, supported by a golden crossover of MACD, broke out to the upside at 02:18 UTC and created an expanding triangle pattern. Supported by a death crossover of MACD, the growing triangle pattern broke out to the downside at 03:03 UTC to create a range. Supported by a MACD death crossover, that range broke out to the downside at 03:23 UTC, but the downside Dogecoin breakout failed, and the DOGE price rose again, establishing yet another range.
Driven by a golden crossover of MACD, this range broke to the upside at 03:46 UTC and led to another range, which also broke to the upside at 04:18 UTC, supported by a golden crossover of MACD, thereby establishing a small range. Backed by yet another golden crossover of MACD, the narrow range rose to the upside at 04:30 UTC and created a channel going down. Meanwhile, RSI rose over the level of 70 at 04:30 UTC, pointing to overbought market circumstances and maybe a reversal or at least a pullback.
DOGE Faces Indecision as Both Bulls and Bears Falter
The Dogecoin price structure reflects classic consolidation behavior, frequent reversals, failed breakouts, and overreactions to support and resistance. Despite oversold RSI signals and multiple golden crossovers, bullish momentum remained short-lived. Similarly, bearish pushes failed to generate strong follow-through. The presence of consecutive ranges and shifting channels signals a market in search of direction. Until clear volume and momentum return, the DOGE price is likely to remain trapped within narrow zones. Traders should stay cautious, as current conditions favor short-term swings over trend trades. A confirmed breakout above resistance or below support is needed to reestablish a definitive path forward.
Dogecoin (DOGE) Price Analysis of June 15, 2025
Dogecoin price action on June 14 reflected high volatility with frequent reversals and failed trends. The day’s high was recorded at $0.17871 within an early upward-moving channel that quickly lost momentum. Dogecoin passed across several channels, ranges, and triangle patterns all during the session, with MACD crossovers often indicating direction changes. Marking major changes in DOGE pricing activity, RSI hit overbought levels at 02:05 UTC and dropped under 30 by 05:25 UTC. Most breakouts, however, lacked sustained follow-through; as the session went on, the price dropped and finally bottomed out at $0. 17472 under ongoing technical pressure.
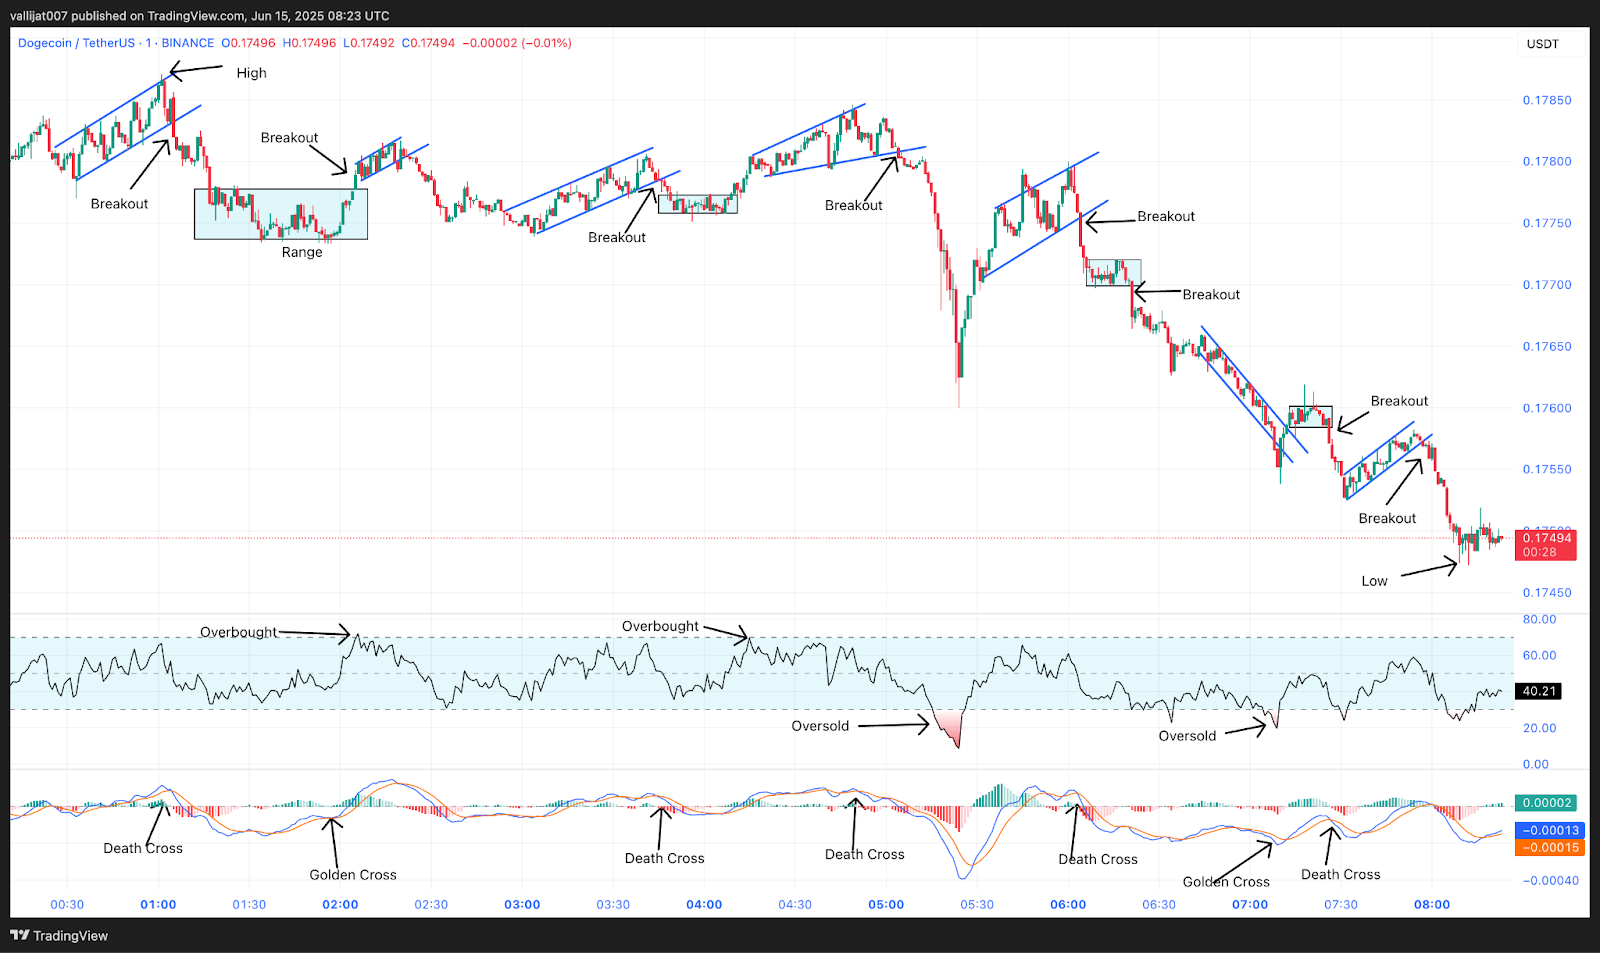
Chart 9: DOGE/USDT M1 Chart, Analysed by vallijat007, published on TradingView, June 15, 2025
Dogecoin price formed an upward-moving channel, which marked the high for the day at $0.17871. The channel broke out to the downside at 01:05 UTC, supported by a death crossover of MACD, and formed a range. The range broke out to the upside at 02:05 UTC, supported by a golden crossover of MACD, and formed an upward-moving channel. At 02:05 UTC, RSI moved above the level of 70, indicating overbought market conditions, suggesting a reversal or at least a pullback.
Consecutive Channel Breakdowns Between 02:25-03:46 UTC
The upward-moving channel broke out to the downside at 02:25 UTC, supported by a death crossover of MACD, and formed another upward-moving channel. The second upward-moving channel again broke out to the downside at 03:46 UTC, supported by a death crossover of MACD, and formed a range. The range broke out to the upside at 04:10 UTC, supported by a golden crossover of MACD, and formed an expanding triangle pattern. Supported by a MACD death cross, the growing triangle pattern fractured to the downside at 05:04 UTC and produced an upward-moving channel.
At 05:25 UTC, RSI fell under the threshold of 30, which points to oversold market circumstances and implies either a turnaround or at least a backward move. Supported by MACD, the upward-moving channel broke out to the downside at 06:04 UTC and created a range. Supported by a death crossover, the range broke out to the downside at 06:21 UTC and created a channel moving down. Supported by a golden cross of MACD, the channel descending broke out to the upside at 07:13 UTC to create a range.
The range broke out to the downside at 07:26 UTC, supported by a death crossover of MACD, and formed an upward-moving channel. The upward-moving channel broke out to the downside at 07:59 UTC, supported by a death crossover, marking the low for the day at $0.17472. If the breakout succeeds, then the Dogecoin price may drop to the level of $0.17000. If the breakout fails, then the DOGE price may rise to the level of $0.18000. Traders and investors should be cautious before placing upward breakout trades, as the Dogecoin trend is showing bearish momentum.
$0.17871 High to $0.17472 Low: Bearish Momentum Undermines Breakout Attempts
The Dogecoin trend trading pattern showed a clear struggle to sustain bullish momentum. Despite multiple golden MACD crossovers, upward-moving channels consistently broke down, with RSI signals frequently aligning with reversals. The failure of several breakout attempts, especially the repeated breakdowns of upward-moving channels, signals weakening buying interest. Due to the fact that the prices of DOGE price reached its lowest Price point of $0.17472, the current structure indicates the need to exercise caution. The upward breakout trades lack greater confirmation, and without it, they are also risky, with the decline to the levels of around $0.17000 being one of the possible short-term scenarios.
Dogecoin (DOGE) Price Analysis of June 30, 2025
Dogecoin price action was defined by volatility and failed momentum. The day began with a downward-moving channel that marked the low at $0.16259. A golden crossover of MACD and an oversold RSI sparked a recovery, but the upside was limited. Dogecoin hit its high at $0.17006 after a string of rising breakouts, several of which had poor follow-through. Reflecting ambiguity in market direction, RSI repeatedly hit overbought and oversold levels. Dogecoin prices ranged and oscillated between channels throughout the session, hence making trend confirmation difficult and creating problems for traders depending on consistent directional movement. At present, DOGE price trades at $0.16500.

Chart 10: DOGE/USDT M5 Chart, Analysed by vallijat007, published on TradingView, June 30, 2025
Dogecoin price formed a downward-moving channel. The channel broke out to the upside at 00:20 UTC, supported by a golden crossover of MACD. Price spiked to the upside and formed another downward-moving channel. This second channel broke out to the downside at 02:00 UTC, supported by a death crossover of the MACD. The Dogecoin trend moved lower and formed a range. At 02:15 UTC, RSI dropped below 30, indicating oversold market conditions and suggesting a potential reversal or at least a pullback. The range marked the low for the day at $0.16259.
Overbought RSI at 06:15 UTC Precedes Channel Fluctuations
Supported by a golden MACD crossover, the range opened to the upside at 05:45 UTC and created a rising triangle pattern. RSI exceeded 70 at 06:15 UTC, pointing to overbought conditions and warning of a potential pullback. Supported by a golden MACD crossover, the triangle pattern broke out upward at 09:30 UTC to create a range. The range broke out to the downside at 10:30 UTC, supported by a death crossover of MACD, leading to the formation of an upward-moving channel.
The upward-moving channel broke out to the downside at 14:30 UTC, supported by a death crossover of MACD, and formed a downward-moving channel. This channel broke out to the upside at 16:30 UTC, supported by a golden crossover of MACD, and led to another downward-moving channel. The second downward-moving channel broke out to the upside at 17:55 UTC, supported by a golden crossover of MACD, followed by a third downward-moving channel. This one broke out to the upside at 21:15 UTC, supported by a golden crossover of MACD, marking the high for the day at $0.17006.
Consecutive Range Breakdowns at 04:40 and 06:35 UTC
After marking the high, Dogecoin price entered a range, which broke out to the downside at 02:20 UTC on 30th June 2025, supported by a death crossover of MACD, forming another downward moving channel. That channel broke out to the upside at 03:35 UTC, supported by a golden crossover of MACD, and formed a range. This range broke out to the downside at 04:40 UTC, and another range followed. The next range broke out to the downside again at 06:35 UTC, supported by a golden crossover of MACD, with another range forming afterward.
$0.17006 High Marks Temporary Top Amid Choppy Breakouts
Dogecoin price reached its high at $0.17006 following a sequence of upward breakouts, but momentum failed to sustain. The DOGE price often dropped into tight ranges and downhill channels despite several bullish MACD crossovers. Late-session failures at 04:40 and 06:35 UTC proved a bearish lean, therefore advising cautious long position trading. If the Dogecoin trend falls short of $0.1680, the following major support could be reexamined close to $0.1620. A break above $0.1700 could help to reclaim bullish momentum.
Dogecoin (DOGE) Price Analysis of July 4, 2025
Dogecoin price traded within volatile structures shaped by MACD crossovers and RSI extremes. The price started with a breakout from a converging triangle pattern at 04:55 UTC and spiked to the day’s high of $0.17542, establishing a resistance area at $0.17510. This rally triggered overbought RSI conditions, foreshadowing a decline. The session then moved through multiple range and channel formations, each influenced by MACD signals. Despite several bullish attempts, bearish pressure dominated the later hours. Dogecoin price ultimately dropped to a session low of $0.16480, reflecting weakening momentum and increased risk of further downside in the near term.

Chart 11: DOGE/USDT M5 Chart, Analysed by vallijat007, published on TradingView, July 4, 2025
Dogecoin price formed a converging triangle pattern. The converging triangle pattern broke out to the upside at 04:55 UTC, supported by a golden crossover of MACD; price spiked to the upside and formed an upward-moving channel. At 05:35 UTC, RSI was above the level of 70, indicating an overbought market condition, suggesting a reversal or at least a pullback. The upward-moving channel marked the high for the day at $0.17542 and formed a resistance area at the level of $0.17510. The upward-moving channel broke out to the downside at 10:15 UTC, supported by a death crossover of MACD; price spiked to the downside and formed a support area at the level of $0.17315.
Overnight Volatility Culminates in Daily Low at $0.16480
The support area broke out to the downside at 12:30 UTC, supported by a death crossover of MACD, the price spiked to the downside, and a range followed. At 12:35 UTC, RSI dropped below the level of 30, indicating an overall market condition suggesting reversal or at least a pullback. The range broke out to the upside at 13:30 UTC, supported by a golden crossover of MACD; price spiked to the upside but failed to break the resistance area of $0.17510. Price again dropped to the downside and formed a range.
The range broke out to the upside at 16:45 UTC, supported by a golden crossover of MACD; price spiked to the upside and formed an upward-moving channel. The upward-moving channel broke out to the downside at 21:35 UTC, supported by a death crossover of MACD, price spiked to the downside, but the momentum was weak, and the Dogecoin price formed a range. The range broke out to the downside at 02:15 UTC on 4th July 2025, supported by a death crossover of MACD; price spiked to the downside and formed an upward-moving channel.
The upward-moving channel broke out to the downside at 04:20 UTC, supported by a death crossover of MACD; price spiked to the downside and formed a moving channel. At 04:50 UTC, RSI was below the level of 30, indicating an overall market condition suggesting a reversal or at least a pullback. The downward-moving channel again broke out to the downside at 07:10 UTC, supported by a death crossover of MACD; price spiked to the downside, marking the low for the day at $0.16480.
Dogecoin Falls from $0.17542 High to Close Near $0.16480 Low
The Dogecoin price action on July 3 reflected heavy intraday volatility with sharp swings between resistance at $0.17510 and support around $0.16480. Despite early bullish momentum, repeated overbought RSI readings and death crossovers of MACD triggered persistent downward pressure. Multiple failed breakouts and declining momentum signaled a bearish shift, particularly in the latter part of the session. At 07:10 UTC, the last break to the downside confirmed the dominance of sellers, closing the low of the day at $0.16480. With bearish momentum dominating, traders should seek more weakness unless the price recovers support above $0.17000 with persistent volume and a positive MACD crossover.


