
Are you keeping an eye on Ethereum Classic and wondering if this rally has more fuel or if a pullback is next? This ETC price analysis dives into today’s chart action, from sharp breakouts to resistance rejections, while breaking down MACD signals, RSI shifts, and where support is holding strong. Whether you’re planning an entry or just tracking the trend, let’s walk through what’s unfolding and where ETC could be heading next.
Ethereum Classic Price Analysis
The Ethereum Classic price action today, from the start of trading to 11:40 UTC, shows a recovery-driven structure marked by a clear uptrend channel forming early. The price lifted off the session low and broke past the $19.14 support by 00:50 UTC. As the bullish structure strengthened, ETC climbed steadily and tested the initial resistance level at $19.44. An ETC breakout occurred around 03:33 UTC, briefly entering a sideways consolidation phase. MACD showed a golden cross near 01:50 UTC, supporting this uptrend. RSI briefly entered overbought territory before fading, reflecting short-term bullish exhaustion.
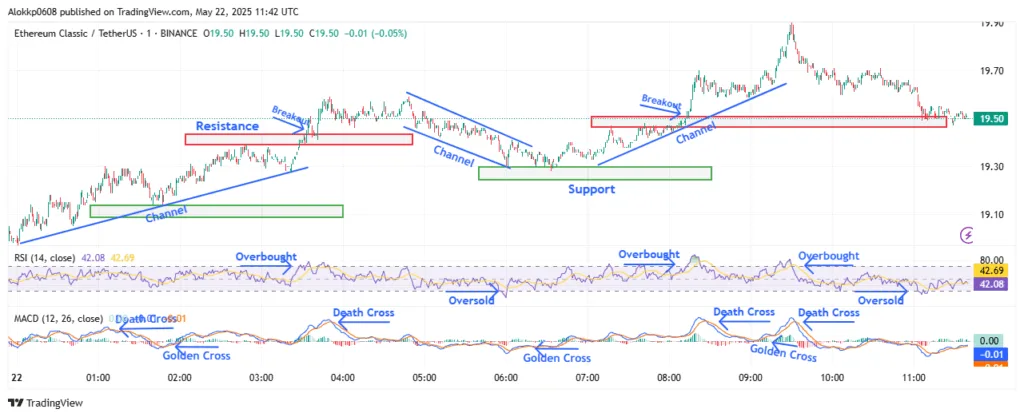
ETC/USDT M-1 Chart, Analyzed by Alokkp0608, published on May 22nd, 2025.
From 03:30 UTC to 06:00 UTC, the Ethereum Classic price entered a downtrend channel that signaled a cooling phase. After the ETC breakout on $19.44, the price couldn’t sustain higher highs and started forming Lower Highs. MACD flipped to a death cross by 03:53 UTC, confirming the downside momentum. Price slid down to a fresh support level around $19.30 by 06:00 UTC, marking a temporary bottom. RSI moved into oversold conditions around 05:45 UTC, rebounding slightly as buyers tried to reclaim control. The $19.30 zone now acts as a short-term demand zone supporting intraday entries.
Breakout Surge, Buyers Retake Control
Between 06:00 UTC and 08:15 UTC, ETC price reversed upward from the $19.30 Support, climbing within a renewed Uptrend channel. The price established a higher low and made a clean ETC breakout above the $19.50 resistance at 08:13 UTC. This upside momentum coincided with a golden cross on the MACD around 06:04 UTC, followed by another near 08:00 UTC, reinforcing bullish conviction. RSI re-entered overbought conditions during this surge, signaling strong demand. The price structure formed a new Higher High, confirming trend continuation. Buyers were clearly in control, with volume supporting the rally.
However, the momentum began to fade post 09:30 UTC. The ETC price topped near $19.90, forming a key intraday high. From there, a new DC formed as sellers pushed prices lower, breaking below short-term trendlines. RSI showed overbought rejection followed by steady decline, while MACD posted a fresh death cross by 08:27 UTC. This move confirmed fading momentum. The price retested the $19.50 RL as support by 11:05 UTC, but struggled to rebound meaningfully, signaling reduced bullish pressure.
Pullback Holds Near Key Support After $19.90 Peak
The Ethereum Classic price action between 09:30 UTC and 11:40 UTC confirmed the retracement phase after a vertical move. ETC printed a LH near $19.75 before falling to retest the $19.50 level multiple times. This zone, previously resistance level, now acts as interim support. However, MACD maintained a bearish tilt post-08:30 UTC, and RSI briefly dipped near oversold territory around 10:45 UTC, showing the pullback was sustained. No strong reversal signal appeared by the end of the session. Price stayed in a narrow SC path, unable to break back above $19.60, with volume tapering off.
ETC Momentum Fades Below $19.60 as Bulls Struggle to Regain Control
Ethereum Classic price is now consolidating below $19.60 after a failed attempt to sustain gains above $19.90. Short-term momentum has turned neutral to mildly bearish, with support levels forming at $19.50 and a more critical zone near $19.30. The historical support near $19.14 remains intact for now. Resistance is now firm at $19.60, with $19.90 acting as the upper ceiling. RSI has cooled into the mid-40s after rejecting overbought levels, and the MACD has weakened with multiple death crosses. If buyers can’t reclaim $19.60 soon, a pullback toward $19.30 looks increasingly likely. An ETC breakout above $19.60 could revive upside momentum toward $19.75 and $19.90.