

Are you keeping an eye on Ethereum Classic (ETC) and wondering if this rally has more fuel or if a pullback is next? This Ethereum Classic price analysis dives into today’s chart action, from sharp breakouts to resistance rejections, while breaking down MACD signals, RSI shifts, and where support is holding strong. Whether you’re planning an entry or just tracking the trend, let’s walk through what’s unfolding and where ETC could be heading next.
Ethereum Classic Price Analysis
The Ethereum Classic price action today, from the start of trading to 11:40 UTC, shows a recovery-driven structure marked by a clear uptrend channel forming early. The price lifted off the session low and broke past the $19.14 support by 00:50 UTC. As the bullish structure strengthened, ETC climbed steadily and tested the initial resistance level at $19.44. An ETC breakout occurred around 03:33 UTC, briefly entering a sideways consolidation phase. MACD showed a golden cross near 01:50 UTC, supporting this uptrend. RSI briefly entered overbought territory before fading, reflecting short-term bullish exhaustion.
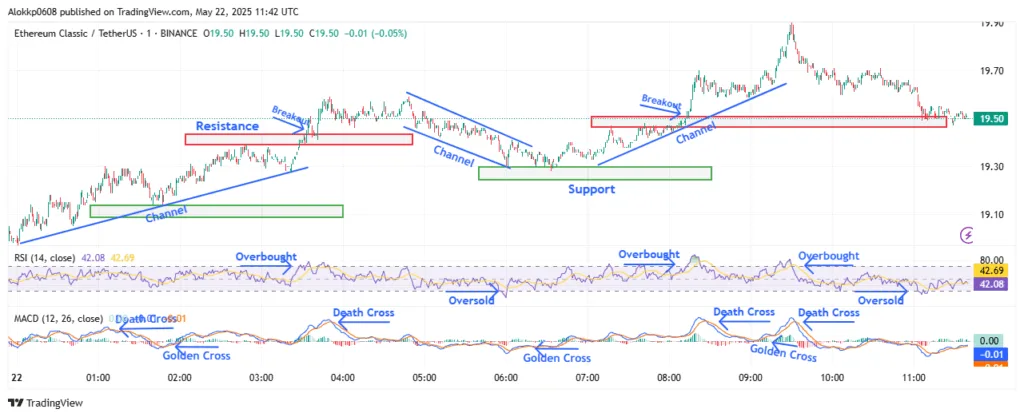
ETC/USDT M-1 Chart, Analyzed by Alokkp0608, published on May 22nd, 2025.
From 03:30 UTC to 06:00 UTC, the Ethereum Classic price entered a downtrend channel that signaled a cooling phase. After the ETC breakout on $19.44, the price couldn’t sustain higher highs and started forming Lower Highs. MACD flipped to a death cross by 03:53 UTC, confirming the downside momentum. Price slid down to a fresh support level around $19.30 by 06:00 UTC, marking a temporary bottom. RSI moved into oversold conditions around 05:45 UTC, rebounding slightly as buyers tried to reclaim control. The $19.30 zone now acts as a short-term demand zone supporting intraday entries.
Ethereum Classic Price Breakout Surge, Buyers Retake Control
Between 06:00 UTC and 08:15 UTC, ETC price reversed upward from the $19.30 Support, climbing within a renewed Uptrend channel. The price established a higher low and made a clean ETC breakout above the $19.50 resistance at 08:13 UTC. This upside momentum coincided with a golden cross on the MACD around 06:04 UTC, followed by another near 08:00 UTC, reinforcing bullish conviction. RSI re-entered overbought conditions during this surge, signaling strong demand. The price structure formed a new Higher High, confirming trend continuation. Buyers were clearly in control, with volume supporting the rally.
However, the momentum began to fade post 09:30 UTC. The ETC price topped near $19.90, forming a key intraday high. From there, a new DC formed as sellers pushed prices lower, breaking below short-term trendlines. RSI showed overbought rejection followed by steady decline, while MACD posted a fresh death cross by 08:27 UTC. This move confirmed fading momentum. The price retested the $19.50 RL as support by 11:05 UTC, but struggled to rebound meaningfully, signaling reduced bullish pressure.
Pullback Holds Near Key Support After $19.90 Peak
The Ethereum Classic price action between 09:30 UTC and 11:40 UTC confirmed the retracement phase after a vertical move. ETC printed a LH near $19.75 before falling to retest the $19.50 level multiple times. This zone, previously resistance level, now acts as interim support. However, MACD maintained a bearish tilt post-08:30 UTC, and RSI briefly dipped near oversold territory around 10:45 UTC, showing the pullback was sustained. No strong reversal signal appeared by the end of the session. Price stayed in a narrow SC path, unable to break back above $19.60, with volume tapering off.
ETC Momentum Fades Below $19.60 as Bulls Struggle to Regain Control
Ethereum Classic price is now consolidating below $19.60 after a failed attempt to sustain gains above $19.90. Short-term momentum has turned neutral to mildly bearish, with support levels forming at $19.50 and a more critical zone near $19.30. The historical support near $19.14 remains intact for now. Resistance is now firm at $19.60, with $19.90 acting as the upper ceiling. RSI has cooled into the mid-40s after rejecting overbought levels, and the MACD has weakened with multiple death crosses. If buyers can’t reclaim $19.60 soon, a pullback toward $19.30 looks increasingly likely. An ETC breakout above $19.60 could revive upside momentum toward $19.75 and $19.90.
Ethereum Classic Price Analysis of May 26th, 2025
The Ethereum Classic price action today, from the start of trading to 08:50 UTC, shows a steady bullish bias with key momentum-driven shifts. Price initially climbed into an upward channel by 00:30 UTC, marking its first higher low (HL) near $18.30. This push formed a minor resistance around $18.48, which was breached briefly at 01:38 UTC before rejection led to consolidation just under that level. A golden cross on the MACD around 00:30 UTC aligned with this early move. RSI remained neutral during the first ascent, suggesting price strength had room to grow but lacked overbought pressure.
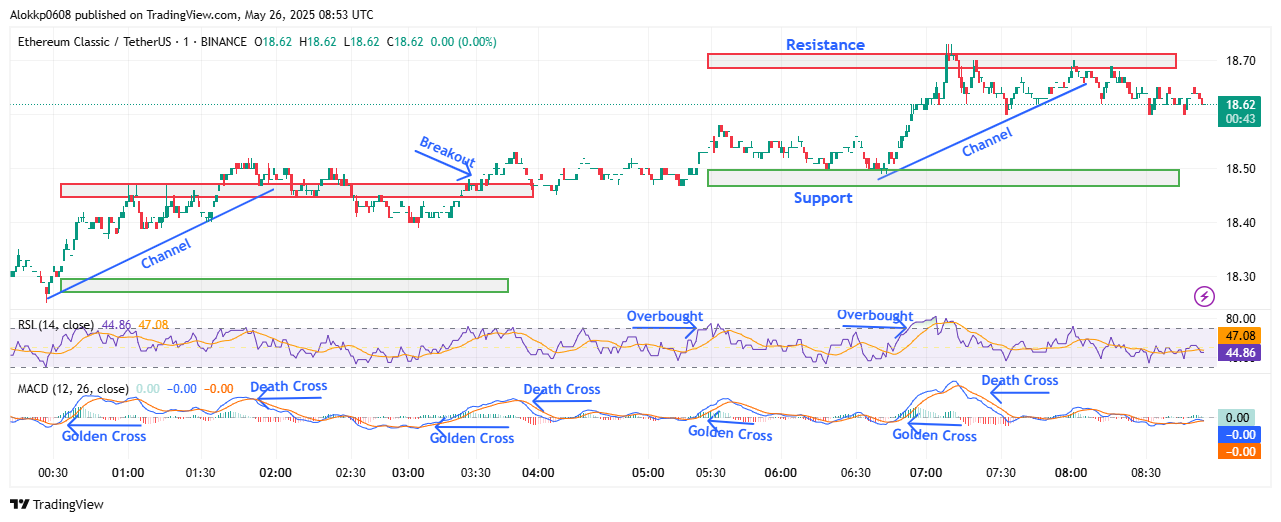
ETC/USDT M-1 Chart, Analyzed by Alokkp0608, published on May 26th, 2025
After the early rejection, ETC price ranged tightly under $18.48 until a clean breakout occurred around 03:27 UTC. This marked a shift to a new bullish structure, establishing a support zone near $18.50 and a new resistance around $18.70. From 03:30 to 05:30 UTC, the price formed consistently higher lows with a peak near $18.58 at 05:33 UTC. RSI crossed into the overbought zone briefly at 05:30 UTC, while MACD had already signaled a golden cross at 05:14 UTC, both reinforcing short-term bullish momentum. Price eventually pulled back to retest the $18.50 support, forming a new HL.
Momentum Builds into ETC Resistance Zone
Between 06:30 UTC and 07:08 UTC, ETC price entered another upward channel, rebounding from $18.50 and pushing toward the $18.70 resistance. Price formed a higher high (HH) on this leg up, but the RSI again entered overbought territory near 07:00 UTC, warning of exhaustion. Shortly after, MACD printed a death cross at 07:14 UTC, confirming weakening momentum. Rejection from the $18.70 ETC resistance level followed, validating it as a strong ceiling for the session. A clear lower high (LH) emerged after the rejection, hinting at the start of sideways drift.
From 07:15 UTC onward, ETC price moved into a sideways consolidation pattern below $18.70, with short-term support firming between $18.58 and $18.60. Despite brief bounces, the price struggled to regain the earlier bullish pace. RSI cooled down into the neutral range, staying between 44 and 47, while MACD stayed flat with no clear directional bias. This consolidation under a well-tested resistance suggests indecision, with neither bulls nor bears taking control. Still, the structure retains its higher support levels, keeping the medium trend biased to the upside unless those levels break.
Pullback Below $18.70 Signals Potential Cooling Phase
In the most recent leg leading to 08:50 UTC, ETC failed to reclaim the $18.70 resistance, solidifying its role as the day’s dominant ceiling. Price declined modestly, staying above the $18.58–$18.60 support cluster but forming no new highs. This behavior marks a clear loss of bullish steam. MACD remains flat with signal-line overlaps, while RSI shows a steady decline out of the overbought zone. If $18.58 support cracks, the next likely retest zone is around $18.50. Otherwise, the range between $18.60–$18.70 could extend into the next session if momentum remains muted.
ETC Faces Resistance Pressure Near $18.70 Amid Fading Momentum
Ethereum Classic price holds onto recent gains but now faces clear rejection near $18.70. The short-term momentum is weakening, with the MACD showing a recent death cross and signal-line flattening. RSI has cooled from its earlier overbought spike, hovering near 45, signaling a neutral-to-weak bias. Key support levels to watch remain at $18.58 and $18.50. ETC Resistance level holds at $18.70 and then higher at $18.76 if bulls return. The overall trend remains mildly bullish unless $18.50 breaks, but without renewed volume or MACD strength, sideways action or a small pullback is more likely in the next few hours. This analysis covers price action through 08:50 UTC.
Ethereum Classic (ETC) Price Analysis of May 30th, 2025
The Ethereum Classic price action today shows a sharp breakdown early, followed by a brief recovery and a slow shift into a weakening sideways pattern. The price initially ranged between $18.00 and $18.22, but sellers quickly took control. By 00:25 UTC, ETC broke down from the $18.00 support with a sharp drop, initiating a death cross on the MACD. The price plunged to $17.26 by 00:59 UTC, creating a new low before bouncing back at 01:02 UTC. RSI dipped deep into the oversold zone and began to recover as momentum shifted slightly upward with a MACD golden cross.
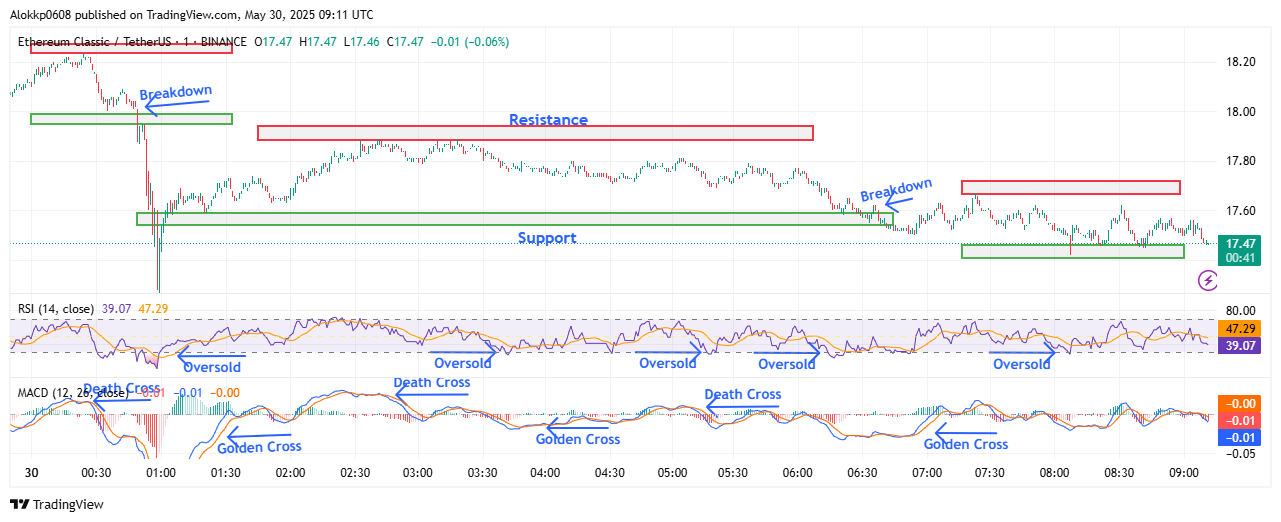
ETC/USDT M-1 Chart, Analyzed by Alokkp0608, published on May 30th, 2025
During the rebound between 01:02 UTC and 02:42 UTC, ETC rose steadily toward the new $17.60–$17.88 range. The rally printed a higher low near $17.35 at 01:20 UTC and peaked at $17.88 by 02:42 UTC, touching resistance. This formed a lower high relative to the earlier peak around $18.00, signaling caution. The RSI reached near mid-range, avoiding overbought territory, while the MACD turned soft with a death cross just after the rejection. Price structure started shifting again from bullish recovery to sideways-to-down.
Ethereum Classic Price Fails to Sustain Resistance, Bearish Tilt Grows
Between 02:43 UTC and 06:21 UTC, the ETC price failed to reclaim $17.88 and formed another lower high near $17.74 by 03:48 UTC, after a modest bounce and another golden cross. However, persistent selling pressure caused RSI to repeatedly dip near the oversold zone, and MACD showed bearish divergence. The drop steepened after 05:00 UTC, especially following a death cross at 05:07 UTC. ETC slid toward the $17.60 support and eventually broke below it by 06:37 UTC, forming a lower low and entering a new support zone near $17.45. This marked a decisive shift into a short-term bearish structure.
New Range Forms but Lacks Bullish Strength
From 06:37 UTC onward, ETC price settled into a new lower range between $17.45 and $17.65. Attempts to bounce back after the golden cross at 06:50 UTC failed to generate real momentum. The price made a minor higher low near $17.48 but could not break above the $17.65 resistance zone. RSI moved closer to neutral but lacked bullish follow-through. Multiple MACD waves showed convergence, but none turned sharply bullish, reflecting weak upward drive. Traders remained cautious as repeated tests of resistance lacked volume and conviction, suggesting a bearish bias lingered despite temporary relief rallies.
Bearish Momentum Stalls Near Support
In the final hour of the chart, ETC price moved in a compressed horizontal band, fluctuating between $17.45 and $17.55. Price printed a small lower high around 08:45 UTC, failing once again to retest the $17.65 ceiling. RSI stayed mostly under the 50 mark, while the MACD lines hovered around the zero axis with low amplitude, signaling indecision. Despite avoiding another sharp drop, the price lacked signs of a breakout or bullish pivot. Momentum remained flat, and each minor uptick was quickly capped. Traders showed minimal interest in lifting the price out of the support zone.
Momentum Fades Near Lows, Caution as Range Narrows
The Ethereum Classic price recovery has faded near the lower support band, with momentum losing steam below $17.65. Near-term structure leans bearish to neutral as the price hovers just above key support at $17.45. If this level fails, $17.26 may return as a downside target. Resistance remains heavy at $17.65 and stronger at $17.88. MACD’s recent golden cross has not inspired strength, and RSI continues to hover under 50. Unless bulls reclaim $17.65 soon with rising volume, ETC may drift sideways or roll over further in the next sessions.
Ethereum Classic (ETC) Price Analysis of June 5th, 2025
The Ethereum Classic price action over the last 24 hours exhibits a steady downward grind initially, followed by a relief rally, and then prolonged consolidation. Price opened just under $17.90, struggling near the upper resistance before facing rejection. Between 09:00 UTC and 11:10 UTC, ETC bounced within the $17.60–$17.90 range, showing no clear trend. However, a death cross on the MACD at 11:15 UTC coincided with a decisive breakdown below the $17.60 support. This marked the start of a bearish leg, as ETC posted a series of Lower Highs (LH) and Lower Lows (LL) while RSI began drifting downward toward midline neutrality.
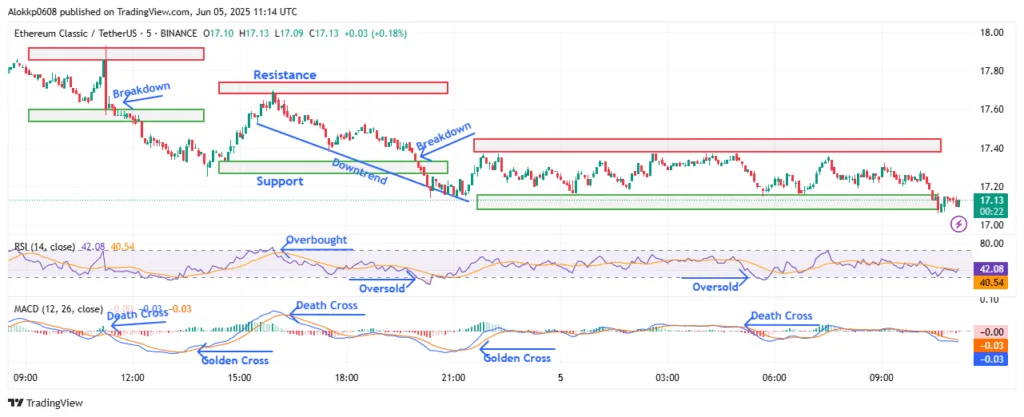
ETC/USDT M-5 Chart, Analyzed by Alokkp0608, published on June 5th, 2025
Between 11:15 UTC and 14:05 UTC, ETC price steadily declined from the breakdown point, reaching a low near $17.25. This decline was methodical, with brief pauses but no meaningful recovery attempts. The MACD stayed bearish after the earlier death cross, and RSI slipped near the oversold zone around 13:50 UTC. This zone also marked a potential support as buyers briefly stepped in. A golden cross on the MACD at 13:25 UTC preceded a bounce, giving the first sign of short-term relief. ETC established a new support at $17.33 while the recovery continued into the next interval.
Temporary Recovery Gives Way to Range-Bound Movement
Between 14:10 UTC and 15:55 UTC, ETC pushed higher, forming a Higher High around $17.68, testing the newly marked resistance. The upward structure carved out a Higher Low at $17.43, showing signs of a temporary bullish setup. RSI briefly entered the overbought zone, aligning with the local top. However, rejection followed quickly. From 16:00 UTC to 20:10 UTC, ETC began rolling over again. Price formed a Lower High at $17.60 and retraced below the $17.33 zone. A breakdown occurred at 20:10 UTC, confirming loss of bullish momentum. MACD also showed a bearish crossover back at 16:15 UTC, which foreshadowed this weakness.
Between 20:15 UTC and 03:00 UTC (June 5th), the ETC price found support at $17.15. Price consolidated within a narrow horizontal channel between $17.15 and $17.38. No clear trend was present as buyers and sellers took turns testing boundaries. MACD during this phase flattened, reflecting reduced momentum, while RSI oscillated around the 40–50 level, never reaching extremes. Price action was choppy but stable, with neither side breaking the range. This zone became a battleground that absorbed pressure from both bulls and bears.
Rejection at $17.38, Followed by Slow Drift Lower
Between 03:00 UTC and 06:00 UTC on June 5th, Ethereum Classic made a shallow attempt to push higher but was capped again near the $17.38 resistance. Multiple failed tries around this level confirmed its strength. Meanwhile, MACD registered a new death cross at 04:55 UTC, signaling fresh bearish pressure. RSI briefly dipped into oversold territory near 05:15 UTC but bounced modestly, suggesting weak buying interest. Prices eventually began drifting lower, consistently printing Lower Highs and flat-lining near the lower edge of the consolidation range. Support held for now, but upward momentum appeared to fade.
The most recent movement, from 06:00 UTC to 11:05 UTC, saw ETC breaking slightly below the $17.15 support zone, touching $17.12 before stabilizing. This micro breakdown came without strong follow-through, indicating buyers were still present but lacked strength. MACD remained flat with no crossover in sight, while RSI stayed muted around 42. Despite the breach, price mostly hovered in a tight $17.12–$17.20 band. Sellers appear cautious, but buyers are too weak to spark any meaningful reversal.
ETC Momentum Weakens as Sellers Dominate $17.38–$17.15 Zone
Ethereum Classic price remains under pressure, with fading bullish momentum and repeated rejection near the $17.38 resistance. In the short term, price is likely to remain range-bound between $17.12 and $17.38, unless either support or resistance decisively breaks. Momentum is neutral to slightly bearish, with MACD flat and RSI hovering below midline. The key support to watch lies at $17.12, followed by $17.00 as a psychological level. On the upside, resistance remains strong at $17.38 and $17.60. If bulls fail to reclaim $17.38, downside risk may grow.
Ethereum Classic (ETC) Price Analysis of June 10th, 2025
The Ethereum Classic price action today shows early bullish momentum followed by a sharp trend shift. Price began rallying from the $17.60 level, breaking above $17.95 and pushing toward $18.15. A higher high was formed around 00:31 UTC near the resistance line before the momentum started fading. MACD showed a golden cross at 00:11 UTC supporting the rally, but a quick death cross by 00:34 UTC hinted at the exhaustion. RSI briefly entered the overbought zone, then began cooling off. The early session established the day’s first support near $17.95 and resistance around $18.15, marking a broad upper resistance zone.
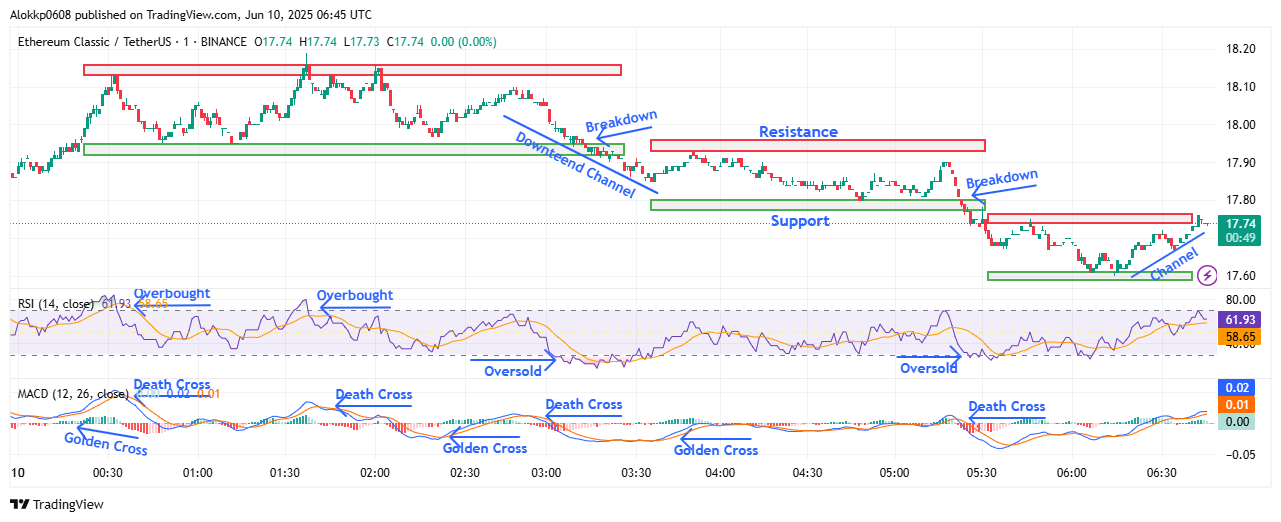
ETC/USDT M-1 Chart, Analyzed by Alokkp0608, published on June 10th, 2025
Between 01:00 UTC and 02:51 UTC, the ETC price behavior turned more erratic. A series of lower highs formed as the price fluctuated within a narrowing range. RSI moved sideways under 70, showing weakening buying pressure, while MACD confirmed the loss of momentum with a death cross at 01:41 UTC. Price structure formed a descending triangle, and although a short-lived bounce occurred following a MACD golden cross at 02:22 UTC, sellers quickly took control. This stretch set a short-term resistance near $18.05, while higher lows started collapsing, reflecting a bearish bias brewing under the surface.
Breakdown Triggers Bearish Momentum
Between 02:51 UTC and 05:20 UTC, Ethereum Classic entered a confirmed downtrend. Price broke below the earlier $17.95 support at 03:13 UTC, aligning with a MACD death cross. A new descending channel emerged with successive lower highs and lower lows. RSI briefly dipped into the oversold zone, showing capitulation during the breakdown phase. A minor golden cross at 03:36 UTC led to a shallow retracement, but sellers returned fast. The range between $17.80 and $17.93 formed the new resistance and support. However, the bearish structure held firm, and another MACD death cross at 05:20 UTC marked the end of the weak recovery.
From 05:20 UTC to 06:14 UTC, the downtrend steepened further. ETC Price made a lower high at $17.90 before sharply declining and breaking the $17.80 support zone at 05:24 UTC. This sharp selloff established a new lower low near $17.60 by 06:14 UTC. RSI again tested the oversold region during this move, reflecting strong selling pressure. The breakdown formed a new support cluster between $17.58 and $17.62. MACD continued its bearish course, reinforcing the downward flow. No bullish divergence was spotted during this leg, keeping sentiment firmly negative until the final 30-minute window.
Short-Term Rebound from Oversold Region
After 06:18 UTC, ETC Price began forming a short upward channel. Price lifted off the newly formed $17.60 support zone, printing a series of higher lows, suggesting an attempt at reversal. A MACD golden cross around 06:18 UTC confirmed the shift in momentum. RSI rose steadily from oversold levels and crossed above 60 by the end of the chart, reflecting returning buying interest. While $17.75 emerged as immediate resistance, the structure indicated a potential test of this level or even $17.80 if momentum holds. The rebound remains cautious but structurally supported by both MACD and RSI recovery.
ETC Recovery Attempt Faces Tight Resistance Ahead
Ethereum Classic price is showing signs of short-term recovery, but the trend remains fragile. Momentum is tentatively bullish, with support between $17.58–$17.62 and resistance at $17.75 and $17.80. A push above $17.80 could re-test the $17.93 level. However, failure to break $17.75 may drag the price back into the $17.60 zone. MACD’s recent golden cross supports a near-term upside bias, and RSI’s climb from oversold strengthens the case. Still, any rejection near $17.75–$17.80 could invalidate the rally. As of 06:43 UTC, bulls are attempting to reclaim ground, but sustained strength is needed to overcome the layered resistance zones above.
Ethereum Classic (ETC) Price Analysis of June 14th, 2025
The Ethereum Classic price action today shows a narrow but volatile range. It began within a clear downtrend, falling from around $16.88 to break below the support at $16.74 by 01:05 UTC. A brief RSI dip near the oversold zone coincided with a MACD golden cross at 01:25 UTC, which triggered a slight recovery. However, ETC couldn’t breach $16.80, forming multiple lower highs (LH) through 02:00–04:00 UTC. The structure stayed compressed, with price pinging between the initial $16.74–$16.80 range, suggesting growing indecision.
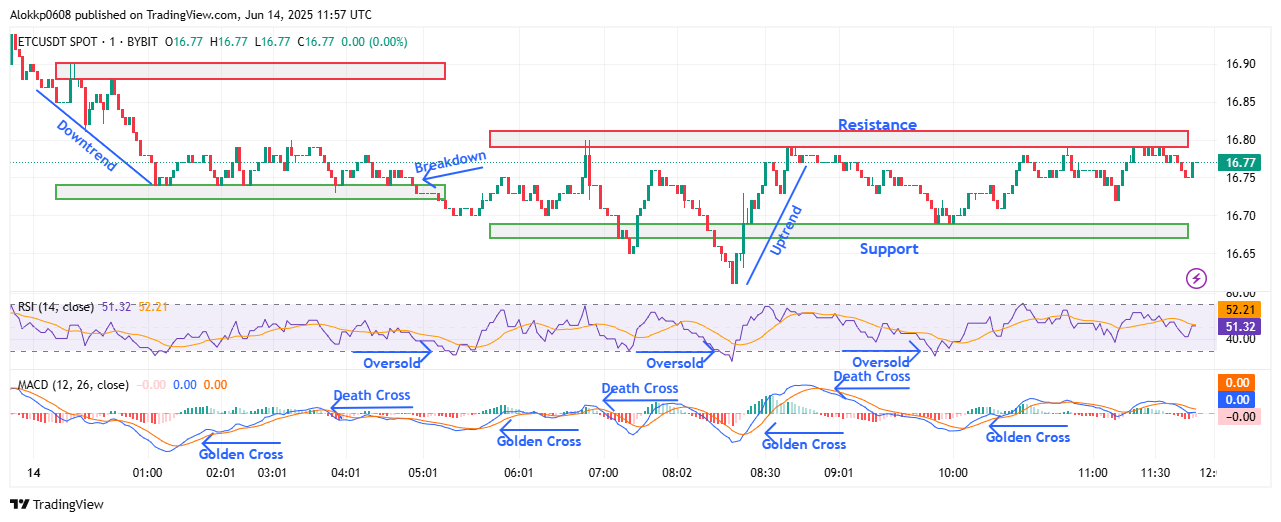
ETC/USDT M-1 Chart, Analyzed by Alokkp0608, published on June 14th, 2025
A sharp breakdown occurred at 04:54 UTC, when ETC price slipped below $16.74, forming a fresh low at $16.69. This shifted the short-term structure into a new channel between $16.69 support and $16.79 resistance. Though MACD issued a golden cross at 05:32 UTC, it failed to spark significant upward movement. RSI barely lifted from neutral, indicating buyers remained cautious. ETC made a lower low at $16.61 by 08:18 UTC, but a sharp bounce followed right after, pushing the price above $16.70 and establishing a short-lived uptrend. This price behavior marked a potential higher low (HL), setting the stage for intraday recovery.
Repeated Rejections Despite Recovery Attempts
Between 08:20 UTC and 10:00 UTC, ETC showed signs of price recovery. The rise from $16.61 to test the $16.79 resistance marked a higher high (HH), giving bulls some momentum. This move also aligned with a golden cross on the MACD and a fast rebound from the RSI’s oversold line, supporting the upward attempt. However, resistance at $16.79 proved firm. Price was rejected first at 08:36 UTC and again after a minor pullback and another push near 09:20 UTC. A death cross shortly after suggested waning buying strength.
Despite a small uptick and another golden cross by 10:05 UTC, ETC price remained unable to break above $16.79. Price began moving sideways, testing both ends of the $16.69–$16.79 range multiple times. RSI hovered in neutral, refusing to climb above 55, while MACD signal lines started to flatten, a classic sign of market equilibrium. This suggested that neither bulls nor bears were in clear control heading into the final hour.
Rejection at Key Resistance Near $16.79
From 10:00 UTC onward, ETC price showed three separate rallies that each failed at $16.79, at 10:48 UTC, 11:15 UTC, and finally 11:27 UTC. These rejections formed a clear triple-top structure, reinforcing $16.79 as a stubborn resistance. Despite strong attempts to push above, RSI remained capped below 60, showing weak follow-through. MACD printed a mild bullish curve, but no decisive breakout momentum. Meanwhile, price continued forming equal highs (horizontal resistance) and higher lows, suggesting a tightening coil, potentially leading to breakout volatility in the next session.
ETC Struggles Below Resistance With Fading Bullish Momentum
Ethereum Classic price closed the session at $16.77, just below the $16.79 resistance level. The short-term momentum appears to be fading despite a recent higher low. RSI is trending sideways near 51, and the MACD has flattened out, reflecting neutral-to-weak bullish bias. Price remains trapped between support at $16.69 and resistance at $16.79, with $16.61 serving as the next key support below. Unless bulls can reclaim and hold above $16.79 soon, the triple rejection may trigger a downside retest. For now, the momentum leans neutral with caution toward further dips unless MACD shifts bullish again and RSI reclaims over-60 territory.
Ethereum Classic (ETC) Price Analysis of June 20th, 2025
The Ethereum Classic price action today shows an early consolidation phase between $16.66 and $16.76, before sellers took control. Between 00:00 UTC and 02:28 UTC, ETC hovered in a narrow range without testing the initial support at $16.58 or resistance at $16.80. RSI briefly dipped near the oversold zone while MACD printed a death cross around 00:20 UTC, but no significant directional bias emerged until 02:28 UTC. That’s when a downtrend began, with clear lower highs and lower lows building up pressure toward the $16.58 support level, which eventually gave way just after 04:00 UTC.
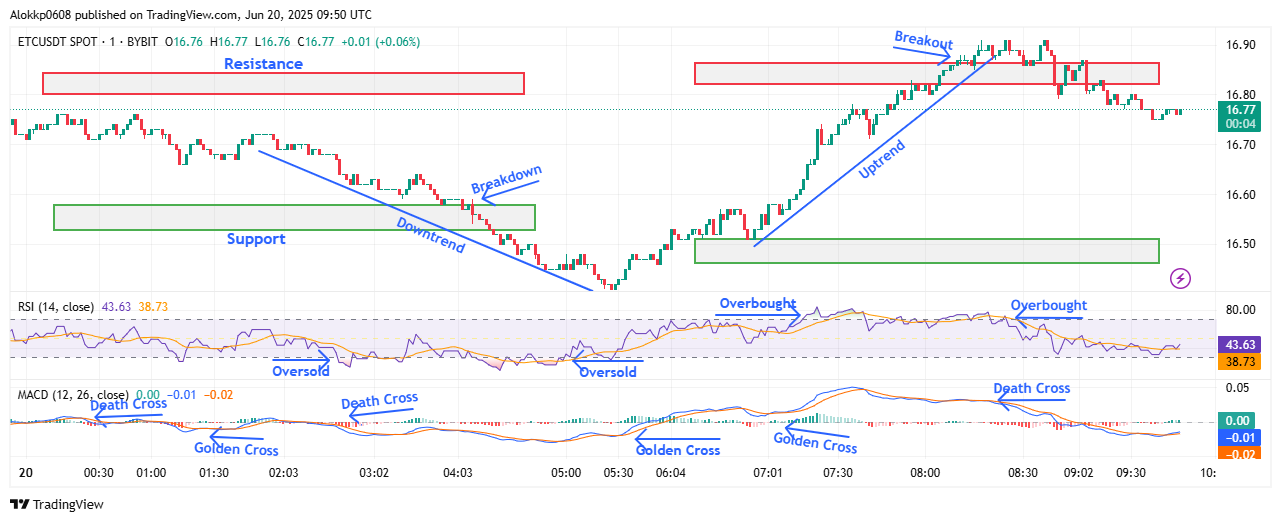
ETC/USDT M-1 Chart, Analyzed by Alokkp0608, published on June 20th, 2025
From 02:30 UTC to 05:28 UTC, the ETC price followed a clean downward channel, breaking through support at $16.58 and reaching a low of $16.41, marking a textbook LL (Lower Low). This move was driven by a bearish RSI dive into oversold territory twice, and a series of MACD death crosses, including one right before the breakdown at 02:28 UTC. Price attempted a weak bounce twice, but lower highs near $16.52 and $16.48 confirmed a lack of buyer strength. Support formed between $16.41 and $16.50, which would later serve as the base for a major shift in structure.
Strong Recovery Fueled by Momentum Shift
Between 05:29 UTC and 06:54 UTC, a strong uptrend formed as the price reversed sharply from the $16.41 support. The bounce coincided with a golden cross on the MACD, while RSI quickly rebounded out of oversold and trended higher. ETC formed a higher low at $16.50 and continued to rise, showing HLs at $16.57 and then again at $16.62. MACD confirmed sustained momentum with a second golden cross at 06:54 UTC, reinforcing the strength of this recovery. The short dip around 06:39–06:52 UTC created a solid base around $16.50, locking in that support zone and setting up for a breakout attempt.
From 06:54 UTC to 08:10 UTC, the ETC price rallied toward a new resistance line at $16.85, which replaced the earlier $16.80 mark. The price action printed a clear HH (Higher High) at $16.90 following a clean breakout at 08:10 UTC. RSI briefly entered overbought territory twice during this period, validating bullish momentum. MACD lines remained wide apart and well above the signal baseline, highlighting strong buyer conviction. This was a key breakout segment, shifting ETC into a short-term bullish bias after confirming the structure change from the earlier downtrend.
Rejection at $16.90 Leads to Short-Term Cool-Off
After reaching a high near $16.90, the ETC price struggled to hold above the new resistance zone of $16.85–$16.90. Between 08:11 UTC and 09:40 UTC, ETC began to fade gradually, posting a lower high at $16.86 and drifting down to $16.75. This marked the first sign of weakness since the uptrend began. MACD signaled a loss of momentum with a death cross at 08:24 UTC, and RSI fell back sharply from the overbought zone. While price didn’t collapse, the lower highs and stalling action above $16.75 hinted at a temporary top near $16.90. Buyers lacked urgency here, causing consolidation just above previous resistance.
ETC Momentum Slows Near Highs, But Structure Remains Intact
Ethereum Classic holds near $16.77 at the time of writing, stabilizing above the former resistance zone. The short-term momentum has shifted from bullish to neutral as the MACD flattens near the zero line following the death cross. RSI is back in mid-range territory around 43, showing a lack of immediate buying strength. However, the uptrend structure isn’t broken yet, price still holds above the $16.66–$16.75 support cluster. The HH-HL series is intact as long as the price stays above $16.66, though failure to push above $16.85 on the next rally would risk forming a short-term LH and deeper pullback.
ETC Struggles Below $16.85 as Bulls Lose Steam
Ethereum Classic’s short-term outlook has shifted from bullish to neutral, with momentum fading after the breakout failed to hold above $16.85. If the price remains under $16.85, bears could try to retest the $16.66–$16.75 support cluster. Key support zones lie at $16.66 and $16.50, while resistance stands at $16.85 and $16.90. Momentum has weakened: MACD triggered a recent death cross and is now flatlining, while RSI has dropped back from overbought and hovers near 43. A decisive move above $16.90 could revive bullish energy, but for now, ETC appears to be in pause mode after a strong recovery earlier today.


