

Ethereum has demonstrated solid performance during the past 24 hours, recovering from the prior price lows around the $1750 level and showing bullish momentum after a slight dip. After some downward trading, Ethereum broke past the primary resistance at $1830, which shows bullish sentiment. This Ethereum breakout also indicates a growing case for the market, with momentum starting to switch back towards the bulls. Let’s break down Ethereum’s recent price action while looking at the charts and indicators to identify what could follow next.
Ethereum Price Analysis of 29th April, 2025
ETH Price began April 28 with a continuation of the bullish momentum seen in the early hours, entering an upward channel that pushed prices toward the critical resistance zone at $1830. Between 00:00 and 09:00 UTC, this bullish drive brought the ETH price to a high near $1828. However, buyer exhaustion set in as the RSI approached overbought conditions within this window. The MACD during this period showed a gradual narrowing of the bullish momentum range, suggesting weakening buying pressure before the resistance area could be breached.

Chart 1, Analyzed by Alokkp0608, published on April 29th, 2025.
ETH turned lower from 09:00 to around 15:00 UTC, slipping into a downward channel under rising sell pressure. The ETH price fell through several interim supports, eventually touching $1750 by around 16:15 UTC. During this period, RSI dipped into oversold territory, and a bearish MACD crossover confirmed the strength of the downtrend. Still, $1750 proved resilient, as it has in the past, with hints of recovery starting to show before this interval ended.
Between 15:00 and 21:00 UTC, ETH price bounced off the $1750 support, forming higher lows and entering a new upward channel. Prices gradually climbed above $1785, with notable resistance around the $1800 psychological level. RSI readings moved toward neutral territory from oversold levels, indicating a recovery phase. MACD showed a golden cross developing within this stretch, but the momentum remained moderate. By 21:00 UTC, the Ethereum token hit a short-term high near $1800 before consolidating within a narrow range between $1788 and $1808, showing hesitation near previous local highs.
ETH Price Outlook: What Lies Ahead for Ethereum Token?
After moving sideways overnight, ETH broke out again early on April 29. Around 10:00 UTC, it surged past the $1830 resistance and reached a new short-term high around $1835. RSI briefly tipped into overbought territory, and MACD momentum widened, confirming renewed buyer strength. ETH is hovering just above the former resistance, which has become a new support. If bulls can defend this level, the path toward $1855 or even $1875 opens up. However, if the price slips below $1830, it could trigger a pullback to $1812 or $1795.
Ethereum at a Crossroads: Can the Momentum Hold?
Ethereum breakout above $1830 shows buyers are returning, but the battle between buy and sell sides isn’t over. ETH is still holding above this key level, and if this continues, we might see an advance into the $1855–$1875 zone. Techno fundamentals are strong for both RSI and MACD, but we have hints from both indicators that a short breath would not be untimely. The real question is whether ETH holds $1830 or we descend again to $1812 or possibly $1795. This is a critical moment, and traders should watch these zones closely as Ethereum shapes its next move.
Ethereum Price Analysis of May 1st, 2025
The Ethereum price action on a 5-minute chart over the past 24 hours opened with range-bound behavior. The Ethereum price action on a 5-minute chart over the past 24 hours opened with range-bound behavior. Between 00:00 and 12:00 UTC on April 30, ETH price moved sideways between $1790 and $1815, failing multiple times to break either boundary. This period of tight consolidation hinted at building pressure. RSI oscillated mildly in the 45–60 zone, while MACD hovered near the baseline, showing weak momentum on both sides. Buyers defended the lower range of $1790, but sellers capped upside moves near $1815. The lack of ETH breakout direction during this phase reflected market uncertainty despite multiple attempts to reclaim bullish control.

Chart 2, Analyzed by Alokkp0608, published on May 1st, 2025.
Between 12:00 and 15:00 UTC, the ETH price broke down sharply through the sideways channel and began a steep decline. Price fell below the $1790 level to as low as $1735 just before 15:00 UTC. The sharp decline was confirmed with an RSI drop into the oversold level, supporting that aggressive selling took over. The MACD formed a death cross at approximately 12:30 UTC, supporting the bearish momentum. The decline below the $1750 support level was soon bought up, and the ETH price strongly bounced back by 14:20 UTC. A golden cross accompanied the bounce of the ETH price on the MACD, and the RSI recovered from the oversold zone, supporting a potential reversal in progress.
Strong Rebound Reclaims Key Levels
Following the recovery, between 15:00 and 21:00 UTC, the ETH price entered a clean uptrend channel. Price steadily climbed from $1750 to just below $1800, regaining key lost levels. This upward push was powered by consistent bullish candles and a firm RSI climb toward the 70 level, approaching overbought conditions around 20:30 UTC. MACD showed strong upward crossover momentum throughout this stretch, with histogram bars widening in favor of bulls. Minor dips along the way were bought quickly, confirming buyer interest. This move helped restore short-term sentiment, but the previous resistance at $1820 remained untested by the end of this window.
Between 21:00 UTC and 03:00 UTC on May 1, the ETH price moved toward the $1820 resistance. After briefly consolidating near $1800, bulls pushed higher around 02:00 UTC, finally touching $1820 by 02:40 UTC. RSI spiked into overbought territory again, and MACD continued the bullish pattern with another golden cross. However, this push lacked the volume needed to support an ETH breakout above the resistance zone. Selling pressure returned quickly at $1820, rejecting the advance. Despite the rejection, ETH price stayed above $1800, preserving the structure of the uptrend and keeping bulls engaged for a potential second attempt.
ETH Holds Steady Near Resistance as Momentum Stalls
From 03:00 UTC to the chart’s latest price action, ETH traded in a tight sideways range just below $1820. This reflects a market in pause mode after a strong rebound, with traders waiting for new directional cues. RSI drifted back toward the neutral 50–55 area, while MACD flattened out with multiple small crossovers, indicating reduced momentum on both sides. Price hovered between $1805 and $1815, maintaining higher lows but unable to generate another upward thrust. The $1820 level continues to act as a firm resistance, and without fresh momentum or volume, ETH may drift back toward $1790.
Momentum Wanes as Resistance Caps ETH Recovery
Ethereum’s price has stabilized near the $1820 resistance, but momentum is weakening. Failing to break this level after a sharp recovery suggests buyers are losing steam. RSI has backed off from overbought territory and now hovers near neutral, signaling indecision. MACD also shows flat movement with no clear bullish follow-through. Immediate support lies near $1800, with more substantial support around $1790 and $1750. A sustained move above $1820 is needed to reignite bullish momentum. Until then, ETH may continue consolidating or revisit lower support levels, as short-term sentiment turns cautious without a fresh catalyst.
Ethereum(ETH) Price Analysis of May 05, 2025
The Ethereum price action over the last 24 hours shows an initial downward trend followed by a transition into consolidation. Between 09:00 UTC and 12:00 UTC, the ETH price steadily declined from $1,840 to below $1,825 inside a descending channel. MACD showed a death cross early in this move, with histogram momentum fading. RSI dipped near oversold by 10:00 UTC, signaling a lack of bullish strength. Despite a brief upward attempt near $1,830, ETH failed to reclaim momentum, and bears remained in control with persistent lower highs forming through this phase.
Chart 3- ETH/USDT M5 Chart, Analyzed by Alokkp0608, published on May 5th, 2025.

From 12:00 UTC to 21:00 UTC, the Ethereum price entered a sideways range between $1,820 and $1,835, forming a narrow trading box. During this range-bound movement, RSI oscillated between neutral and slightly overbought zones but never broke clearly above 70. MACD flipped between golden and death crosses several times, confirming indecision. Notably, price briefly spiked to test the key resistance level at $1,850 around 20:15 UTC but faced rejection, suggesting strong sell-side pressure. This rejection reestablished the upper boundary of the range, and the market lost volatility right before the next significant move.
Selling Momentum Reasserts Below Resistance
By 21:00 UTC, the ETH price reversed sharply, triggering a fresh downtrend channel that extended through the night until around 04:00 UTC. The break below $1,820 led to a steep fall all the way to the $1,785–$1,790 support area. MACD printed a death cross again just past 22:00 UTC, and the RSI plunged into the oversold region near 01:00 UTC, confirming sellers were in firm control. The zone between $1,780 and $1,785 served as strong support, holding despite heavy selling pressure. However, the Ethereum price remained weak for hours, consolidating near the bottom range with minimal bullish attempts.
After reaching the support floor, a gradual ETH recovery began at 04:00 UTC, forming a visible uptrend channel. ETH price climbed from $1,790 to above $1,820 by 06:30 UTC, with higher lows and rising volume. RSI rebounded sharply, crossing above 60, and eventually hit the overbought level near 07:00 UTC. MACD also flipped bullish with a golden cross and positive histogram momentum growing steadily. This indicated a clear momentum reversal, though price still struggled just below the previously rejected zone at $1,835. Traders showed signs of regaining confidence, especially as the broader market improved.
ETH Maintains Steady Climb Toward Resistance
The latest price action shows ETH continuing to climb above the rising trend line, pushing above $1,825 by 09:00 UTC. The price pattern has made higher lows and higher highs in the past few hours, and bulls are looking to reclaim the $1,835-$1,840 zone. RSI is in a strong place, just below overbought territory, as the MACD continues its positive expansion with tall histogram bars increasing in size. The sustained push suggests ETH may challenge the $1,850 resistance again if momentum holds.
Bulls Eye ETH Recovery as Prices Push Toward Resistance
Ethereum price looks like it’s making a solid comeback after yesterday’s drop, with buying momentum picking up in the final stretch of the 24-hour window. If it can keep climbing and push through the $1,835 level, there’s a real chance it could head back toward the $1,850 resistance zone. The indicators are backing the move, RSI is heating up but not flashing any warning signs yet, and MACD is showing growing bullish momentum. If bulls can’t clear $1,835, though, ETH might just settle into another sideways chop or even slide back toward $1,800 for a retest.
Ethereum (ETH) Price Analysis of May 9th, 2025
The Ethereum price action over the last 24 hours shows a strong bullish trend that began with a breakout above the $2,000 level around 15:20 UTC. This early ETH breakout triggered accelerated buying momentum, pushing ETH through $2,100 and toward $2,230 by 21:20 UTC. Price movement during this phase stayed within a rising channel, supported by bullish structure and increasing volume. RSI entered overbought territory during the Ethereum rally, confirming buying pressure. The MACD also displayed a golden cross shortly after the breakout, reinforcing bullish bias and trend strength. No major resistance was encountered until the $2,250 region.

Chart 4- ETH/USDT M5 Chart, Analyzed by Alokkp0608, published on May 9th, 2025.
Between 21:00 UTC and 06:00 UTC, ETH price moved sideways in a narrow consolidation phase, with price fluctuating just below the $2,250 resistance. Buyers made multiple attempts to break through, but momentum cooled. RSI readings remained near overbought levels, hinting at fatigue. Meanwhile, the MACD showed two death crosses during this interval, signaling weakening upward momentum and short-term indecision. Despite the sluggish pace, the price held above the newly formed support around $2,200, indicating buyers still had control but lacked the conviction to push higher during this stretch.
Bulls Break Resistance and Target Higher Highs
An ETH breakout above the $2,250 resistance occurred around 06:25 UTC, turning it into a new support level. This breakout initiated the next leg of the bullish move, which extended quickly to $2,450 by 08:30 UTC. Momentum surged as RSI moved into deep overbought territory again. MACD confirmed the move with a strong bullish crossover just before the breakout. Volume increased significantly during this leg, and ETH price briefly touched $2,490, a local high, before beginning a retracement. This sharp breakout period highlighted renewed confidence among bulls and aggressive buying interest above former resistance.
From 08:30 UTC to 09:30 UTC, ETH price saw a rapid decline from the $2,490 peak down to $2,290. This drop followed the overbought exhaustion and was accompanied by a new MACD death cross, signaling reversal pressure. RSI also dropped sharply from extreme overbought levels to mid-range, confirming the cooling momentum. Price tested the newly formed $2,250 support zone, now acting as a stabilizing base. Despite the pullback, the correction was fast and not panic-driven, suggesting profit-taking rather than trend reversal. Buyers showed signs of absorbing the dip near key support.
Mild Rebound Attempts After Sharp Pullback
In the final visible interval leading up to the chart’s end around 10:30 UTC, ETH price showed minor rebound attempts off the $2,290 low but failed to reclaim $2,400. The last price hovered near $2,335, consolidating in a lower-high pattern. RSI stabilized around the neutral zone, while the MACD remained bearish, with signal lines diverging negatively. This indicated continued hesitation among bulls, with momentum fading. No strong volume uptick was seen during the rebound, and resistance now appears firm around the $2,400–$2,450 range. Unless a new catalyst appears, consolidation may persist near current levels.
Prices Pull Back After Overbought Ethereum Rally, Can Bulls Hold the Support?
Ethereum surged past multiple resistance levels, peaking near $2,490 before falling back to $2,290. Momentum has cooled, and price now consolidates near $2,335. RSI dropped from overbought and is currently neutral, while MACD shows bearish divergence after a recent death cross. Key support remains at $2,250, and any breakdown could expose $2,200. On the upside, $2,400 and $2,450 are immediate resistance zones. If bullish sentiment revives, an ETH breakout above $2,400 could push ETH back toward $2,480. For now, short-term momentum is fading, and price direction hinges on the $2,250 support zone holding firm.
Ethereum (ETH) Price Analysis of May 13th, 2025
The Ethereum price action over the last 24 hours shows an initial sideways trend that transitioned into a short-lived uptrend. ETH prices first hovered in a tight consolidation range between $2523 and $2586 until a breakout near 06:15 UTC pushed ETH sharply upward, peaking at $2624 by 07:30 UTC. This surge triggered an RSI overbought signal, suggesting buying exhaustion. Shortly after, a rapid drop to $2530 reversed the gains, placing ETH back into its earlier trading zone. MACD printed a death cross near the top, reinforcing the reversal. This early price movement shaped the volatile start of the session.
Chart 5- ETH/USDT M5 Chart, Analyzed by Alokkp0608, published on May 13th, 2025.
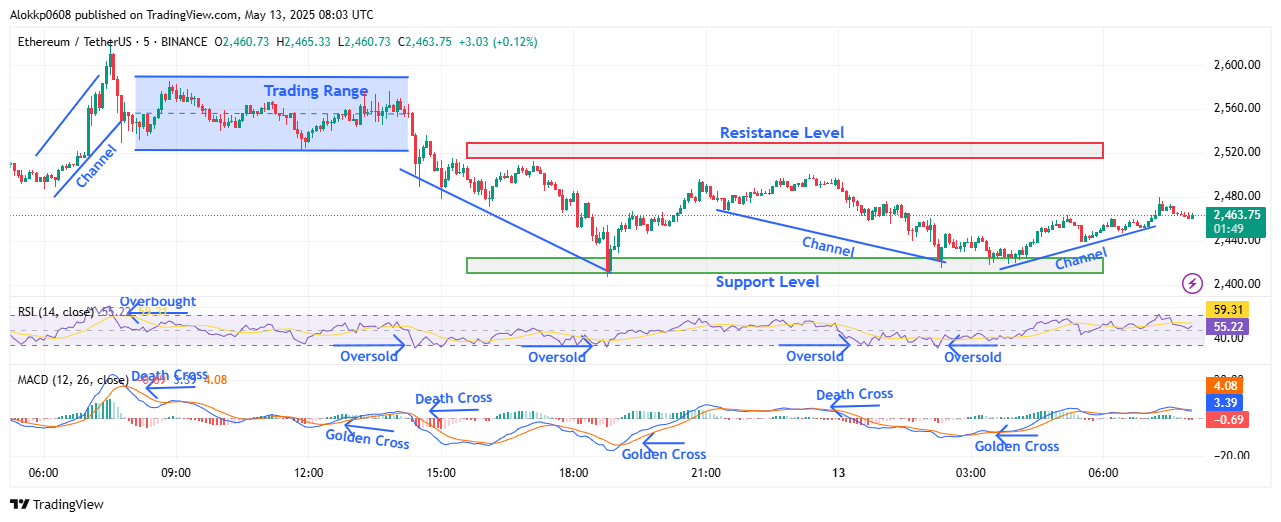
Following the sharp dip, ETH price entered a stable range until around 14:20 UTC, when it fell into a descending channel that culminated in a breakdown to the $2425 support zone by 18:45 UTC. The RSI dipped into oversold territory during this decline, and MACD confirmed the downside with another death cross. However, the selling pressure weakened after touching the support zone, indicating buyer reentry. While the broader price structure was still under short-term bearish control at this point, the reactions at both the RSI and price levels hinted at a potential base forming around the $2425 mark.
Buyers Regain Control After Dip
From the recent low, ETH price rebounded steadily toward the $2495 zone, showing resilience despite facing resistance beneath the $2520 level. This phase of recovery occurred within a mild descending-to-sideways channel, suggesting consolidation after a panic drop. The RSI stayed neutral with gradual upward movement, while the MACD showed a golden cross around 21:00 UTC, reinforcing bullish momentum. Sellers remained cautious, while buyers used the dip to reaccumulate around key technical levels.
Around 02:20 UTC, ETH price retested the $2425 support but immediately bounced with strength, forming a rising channel by 06:00 UTC. This bullish structure was confirmed by a second golden cross on the MACD and a rebound in RSI from oversold to near-neutral. The structure suggested that short-term traders were regaining confidence, but the lack of a breakout past $2495 left room for skepticism. Still, the repeated defense of ETH support at $2425 indicated a growing bullish base, possibly positioning ETH for another test of higher resistance zones.
Consolidation Near Resistance After Recovery
In the final phase leading up to 08:00 UTC, ETH traded around $2463 after its rising channel slowed near the $2480–$2495 area. The RSI hovered just below 60, signaling moderate buying strength but not yet overbought conditions. MACD showed flattening momentum, suggesting that bulls were temporarily pausing after the recovery. The proximity to the $2520 ETH resistance level makes this zone critical for the next direction. The current pattern indicates potential for another push higher if buying pressure continues, but also highlights the need for strong volume to break above the ceiling.
ETH Builds Strength Above Key Support, Resistance at $2520 in Focus
The Ethereum price structure is gradually shifting from a reactive dip to a constructive rebound. If momentum holds, ETH could retest the $2520 resistance and possibly aim for $2580. Current momentum is cautiously bullish, supported by rising RSI and two MACD golden crosses. However, failure to reclaim $2495 soon could cause a pullback toward the $2440–$2425 ETH support zone. The RSI is strengthening but still below overbought, and the MACD’s positive crossover reinforces recovery. Eyes remain on the $2520–$2530 region as the near-term barrier ETH needs to break convincingly to sustain its upside.
Ethereum (ETH) Price Analysis of May 17th, 2025
The Ethereum price action over the last 24 hours shows a clear bearish bias early on, followed by consolidation. ETH opened with a mild upswing near $2,610 but quickly reversed into a sharp decline, forming a clear downtrend channel from 12:00 UTC to 14:45 UTC. During this phase, the price fell steeply to around $2,574, pressured by weak buying support and broader market caution. RSI hovered in the neutral range but started slipping toward the lower zone, reflecting weakening momentum. A MACD death cross near 13:00 UTC reinforced the downward momentum and signaled early selling strength heading into the mid-session.
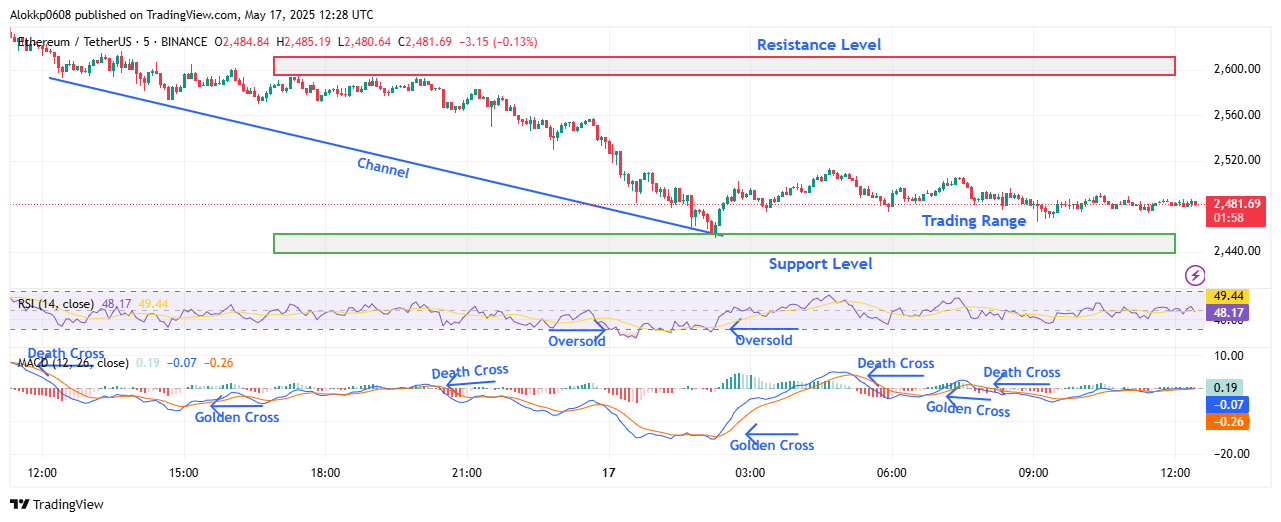
From 15:00 UTC to 20:30 UTC, ETH price entered a sideways phase, hovering below the key resistance level of $2,600. This stagnation occurred despite temporary RSI stabilization and multiple small bullish MACD attempts. The MACD lines crossed several times without strong follow-through, signaling indecision. Price tested the upper resistance range multiple times but failed to break out. This range-bound action formed a temporary ceiling, with buyers showing hesitation near the upper boundary. RSI never broke into overbought territory, and sellers maintained enough pressure to contain any upward moves during this stretch.
Sharp Drop Followed by Stabilization
A renewed downtrend began around 20:30 UTC and extended until approximately 02:10 UTC on May 17. ETH price fell sharply, losing over $100 in this window and bottoming near the $2,455 ETH support level. This steep leg down coincided with another MACD death cross and RSI touching oversold territory twice, signs of panic selling and weak buyer response. This drop was faster and more aggressive than earlier moves, indicating stop-loss triggers and momentum selling. The downtrend paused only after ETH reached its support floor, where buyers finally stepped in to limit deeper losses.
From 02:15 UTC to 09:00 UTC, ETH price traded sideways again, this time above the $2,455 ETH support and within a narrow $2,470–$2,510 range. RSI climbed out of the oversold zone but failed to cross into bullish strength. During this period, the MACD printed alternating golden and death crosses with reduced histogram activity, suggesting a low-volatility equilibrium zone. This indicated the market was trying to stabilize after the earlier drop, but lacked the conviction to rally meaningfully. Minor bounces were met with resistance around $2,510, keeping ETH confined to a tight consolidation range.
Price Stalls Near Lower Midrange as Momentum Fades
In the final visible stretch toward the chart’s close, ETH price remained range-bound near $2,480. The price hovered just above the key ETH support zone, showing hesitation to make another directional move. RSI hovered near 49, showing neutral sentiment, while MACD lines stayed flat with little divergence. With no clear breakout above $2,510 or drop below $2,455, ETH remained range-bound. Momentum was weak, and the market seemed stuck in a wait-and-see mode, leaning slightly bearish.
ETH Struggles Below $2,510 as Momentum Remains Weak
Ethereum price is trading in a narrow range near $2,480, with limited enthusiasm from either side of the market. After the sharp drop from $2,610 to $2,455, buyers have been on the sidelines, and any bounce attempts have not had much conviction. The RSI is holding around 49, showing indecision rather than strength. MACD signals are mixed, with small, flat crossovers and barely any momentum on the histogram. Without a push above $2,510, ETH may remain stuck in this tight zone. If sellers regain control, a retest of $2,455, or even $2,430, is possible. For now, traders appear to be waiting for a breakout before making strong moves.
Ethereum (ETH) Price Analysis of May 20th, 2025
The Ethereum price action over the last 24 hours shows a strong bullish recovery early in the session, following an extended downtrend from previous days. Price movement started with sideways consolidation between $2,385 and $2,420 from 09:00 UTC to 12:35 UTC on May 19. Around 12:40 UTC, ETH broke above $2,420 and transitioned into a steep uptrend, forming a rising channel with higher highs and lows. A clear ETH breakout above the $2,475 level by 16:40 UTC confirmed bullish strength, turning that zone into a key support. RSI during this breakout climbed into the overbought territory, reflecting aggressive buying interest and short-term momentum strength.
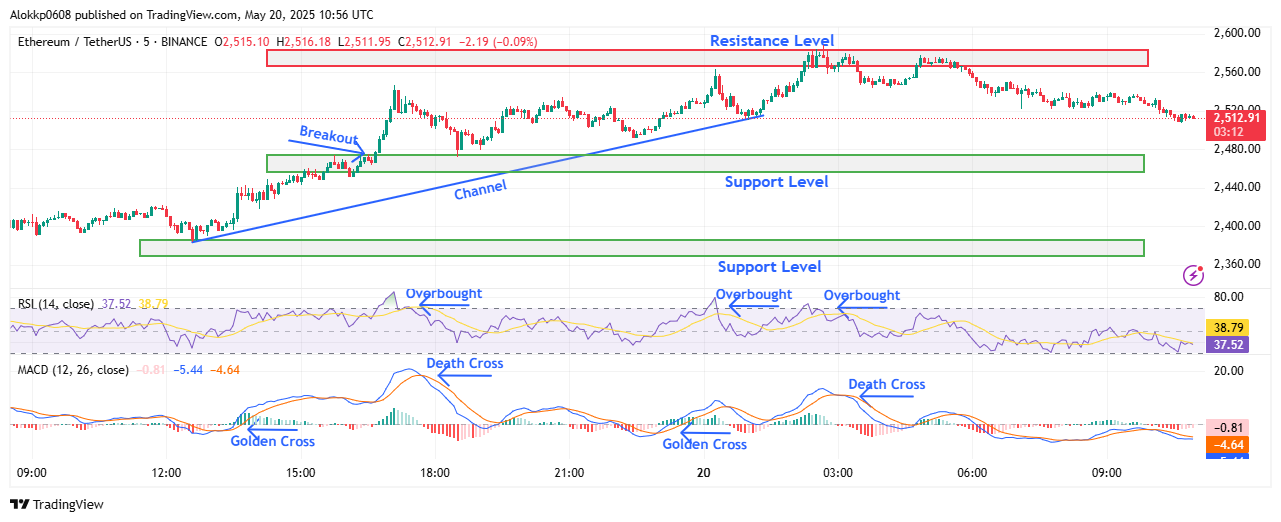
The uptrend remained volatile but intact between 17:10 UTC and 01:05 UTC, with ETH price oscillating between $2,480 and $2,555. This range reflected bullish consolidation within the newly formed channel. MACD showed a golden cross around 19:00 UTC, reinforcing the ongoing positive momentum. However, repeated rejection from the $2,555–$2,580 zone indicated increasing seller pressure near resistance. During this period, RSI entered overbought territory multiple times, signaling temporary exhaustion. Still, buyers continued to hold support above $2,480, validating the ETH breakout zone as a new bullish base.
Momentum Peaks Near Resistance Then Weakens
Between 01:05 UTC and 05:35 UTC, ETH price pushed toward the $2,580 resistance level, reaching a local top around 02:30 UTC. Price action remained choppy in this zone, suggesting indecision near the upper boundary. Multiple rejections from this area reflected resistance holding firm, with buyers unable to sustain momentum. A death cross on the MACD around 04:30 UTC signaled a momentum shift, aligning with RSI falling from overbought levels. The consolidation phase near $2,560 began losing steam, and bearish signals started forming both on price and indicators.
Following 05:35 UTC, the Ethereum price shifted into a short-term downtrend, retreating from the resistance zone. Price steadily dropped back toward $2,500 as bearish pressure mounted. This decline pulled ETH below its channel support line, breaking the prior uptrend structure. MACD remained below the signal line, confirming weakening bullish momentum. RSI hovered near 38, suggesting mildly bearish conditions but no clear oversold signals yet. Overall, the breakdown from the rising channel marked a short-term structural change in ETH’s behavior.
Pullback Stabilizes Near Key Mid-Level
In the latest stretch up to 10:50 UTC, the ETH price consolidates just above $2,500 after the retreat. The current range between $2,500 and $2,520 reflects a cooling-off phase rather than a sharp selloff. Despite the earlier breakdown, the price hasn’t breached deeper support, which is nearly $2,475, which remains a key level to watch. MACD shows a flattened trajectory with narrowing histogram bars, indicating momentum is currently neutral. RSI holds between 37–39, implying consolidation rather than continued bearish acceleration. As ETH stabilizes, the $2,500–$2,475 zone becomes crucial in determining whether bulls can regroup or sellers will push for lower levels.
ETH Bullish Setup Faces Test Around $2,500 Zone
Ethereum price recent uptrend cooled after hitting strong resistance near $2,580, with the price now stabilizing just above $2,500. While bullish momentum has faded, no clear breakdown below key support has occurred. If ETH holds above $2,475, a rebound attempt could follow, potentially targeting $2,540–$2,555. However, a close below $2,475 may trigger a deeper retracement toward $2,420. MACD currently shows neutral momentum with no strong crossover bias, while RSI hovers near 38, hinting at mild bearishness but not yet oversold. Overall, ETH is at a turning point, holding $2,500 could reignite bulls, while failure risks a larger correction. This analysis covers price movement through May 20, 10:50 UTC.
Ethereum (ETH) Price Analysis of May 24th, 2025
The Ethereum price action today shows an early recovery effort after a previous day steep decline. The price first moved sideways between a support level of $2,515 and a resistance level at $2,535 from 00:00 to 02:10 UTC. An ETH breakout followed at 02:31 UTC, leading to a new price channel forming. The RSI briefly hit the overbought zone during this push, and a MACD golden cross at 02:04 UTC reinforced bullish sentiment. A key Higher High (HH) was printed near $2,560, setting a new short-term directional bias favoring buyers.

ETH/USDT M-1 Chart, Analyzed by Alokkp0608, published on May 24th, 2025.
From 03:00 UTC to 05:00 UTC, ETH price moved between the new support at $2,545 and resistance at $2,562. Several Higher Lows (HLs) emerged around $2,548, showing buyer defense. However, momentum faded temporarily as RSI moved out of the overbought area, and MACD flashed a death cross at 04:58 UTC. Despite the lack of strong volume spikes, the support zone held through this phase. The structure suggested consolidation within an elevated range without sharp breakdowns or higher highs, implying a neutral but stable bias.
Buyers Defend Mid-Range After Early ETH Breakout
From 05:00 to 07:00 UTC, ETH price maintained its sideways path, repeatedly testing $2,545 support. A quick dip to near $2,540 around 06:15 UTC marked a brief Lower Low (LL), but the bounce was swift. The RSI dropped into oversold territory momentarily before sharply rebounding, a classic sign of demand absorption. Simultaneously, MACD triggered a new golden cross at 06:50 UTC, adding confirmation of bullish intent. Buyers regained ground with Higher Lows near $2,550 and another Higher High at $2,560, signaling strength after a short-lived dip.
Between 07:00 and 09:58 UTC, ETH price continued to range tightly between $2,548 and $2,560. Although several tests near the $2,560 ceiling showed signs of price hesitation, the support base stayed firm. The RSI showed minor overbought readings during each approach to resistance, followed by quick corrections, consistent with a coiling structure. MACD lines narrowed but avoided any fresh bearish crossover. The consistent formation of HLs across this zone indicated the market was coiling for another attempt higher rather than showing distribution behavior.
Fresh Momentum Emerges After Resistance Push at $2,562
In the final stretch from 10:00 to 10:30 UTC, ETH price began breaking upward again, showing renewed momentum. A clean ETH breakout above $2,562 around 10:17 UTC marked a new Higher High and signaled a fresh push from buyers. The RSI stayed below extreme overbought, allowing more room for continued upside. MACD remained bullish, with the signal line following the upward trajectory. The resistance at $2,562 now flips to potential support, while the price eyes higher targets above $2,570. The shift marks an important phase transition from consolidation to upward continuation.
ETH Breaks Out but Faces Test Above $2,570
Ethereum price shows bullish momentum heading into midday, with a breakout above $2,562 pointing to an upward continuation. The short-term trend has shifted positively, with consistent Higher Lows since 06:30 UTC and a decisive Higher High post-10:17 UTC. Momentum is currently bullish. Key support levels to monitor are $2,545, $2,550, and the newly tested $2,562. Resistance levels to watch next are $2,570 and potentially $2,580. MACD shows a healthy golden cross-backed trend, and RSI remains just under overbought, giving bulls room for extension without immediate exhaustion. Holding $2,562 as support could open doors toward $2,580 in the coming hours.
Ethereum (ETH) Price Analysis of June 2nd, 2025
The Ethereum price action today shows a volatile shift between bearish pressure and short-term recovery. ETH opened near $2,540 but quickly fell into a controlled downtrend after failing to hold the $2,525 support zone. Between 00:00 UTC and 00:34 UTC, the price slipped from $2,535 to test the $2,525 support before rebounding. A short rally followed from 00:38 UTC as ETH climbed back toward resistance near $2,541. However, momentum stalled just below this zone by 01:09 UTC, creating a clear Lower High (LH) and failing to produce a breakout, which signaled incoming weakness.
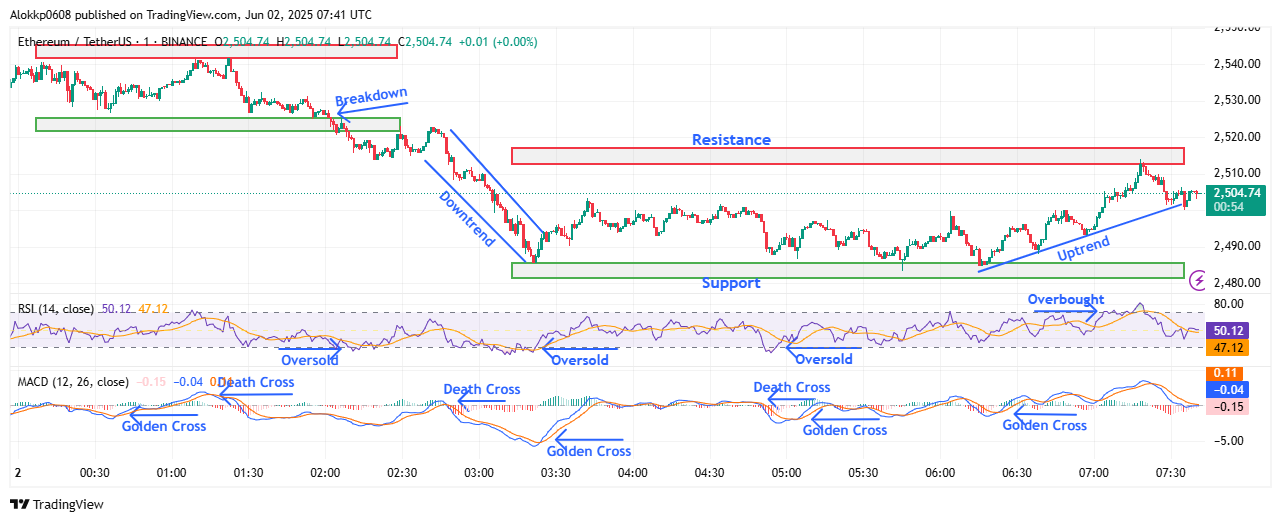
ETH/USDT M-1 Chart, Analyzed by Alokkp0608, published on June 2nd, 2025.
From 01:23 UTC to 03:21 UTC, ETH dropped sharply in a strong downtrend after a breakdown below $2,525 support. The price formed Lower Lows (LLs) along the descent and intensified its drop after a MACD death cross around 02:47 UTC. A new support level formed near $2,485, with RSI briefly dipping into oversold territory during the fall. The lower boundary held, prompting a minor bounce and creating a base. A golden cross on MACD at 03:24 UTC hinted at potential recovery, but the bounce was short-lived as ETH faced heavy resistance below $2,502, where price repeatedly stalled and failed to gain bullish traction.
Stagnation Inside a Narrow Band, Minor Reversals Attempted
Between 03:22 UTC and 06:15 UTC, ETH price consolidated in a tight band between the new support at $2,485 and interim resistance at $2,502. Price carved out a flat structure with Lower Highs (LHs) and slightly Higher Lows (HLs), indicating indecision. RSI stayed mostly midrange, with no overbought or oversold signals during this stretch. MACD printed mixed signals, one death cross around 04:47 UTC and a golden cross at 05:04 UTC, confirming a sideways drift. Buyers repeatedly tested the $2,500–$2,502 zone but failed to force a breakout, which reinforced this level as short-term resistance while $2,485 remained firm support.
A more decisive shift occurred starting at 06:20 UTC, when the ETH price began rising steadily off the $2,485 support level. A strong golden cross on MACD backed this climb, and RSI entered overbought territory as price moved in a well-defined uptrend. ETH posted Higher Highs and Higher Lows, climbing through $2,495 and pressing into the $2,510–$2,512 resistance band by 07:18 UTC. Momentum visibly accelerated during this phase, with volume and candle structure supporting the trend. However, the uptrend began losing steam just under $2,512, indicating the presence of significant sell pressure near this former breakdown zone.
Final Attempt to Break Resistance Fades Below $2,512
In the final stretch of the chart, ETH price attempted one more push past resistance at $2,512 but faced rejection. Price dipped slightly to $2,504 as some profit-taking kicked in. The RSI pulled back from the overbought zone, and the MACD showed signs of flattening, suggesting bullish momentum may be fading. Despite the higher support forming above $2,490, the inability to breach and hold above $2,512 capped the rally. Price structure still holds a short-term bullish bias, but further upside now depends on a clean break above the $2,512 resistance zone with volume support.
Ethereum Recovery Slows Under $2,512 Resistance
Ethereum price is attempting to recover, but its bullish momentum has cooled beneath the $2,512 resistance level. Short-term structure remains mildly bullish, with support now marked at $2,485 and higher support near $2,495. Key resistance levels are $2,502 and $2,512. A breakout above this zone could push the price toward $2,525 again. However, if bulls fail to maintain current levels, ETH may drift back into the $2,485–$2,495 range. MACD shows waning upside energy despite the earlier golden cross, and RSI has exited the overbought zone, implying momentum is neutralizing.
Ethereum (ETH) Price Analysis of June 6th, 2025
The Ethereum price action today shows an early test of the $2,400 support, followed by a clean breakout above layered resistance zones. ETH initially hovered below the $2,425 resistance, pushing toward it by 00:23 UTC, but failed to break out. After holding above the $2,400 support, the price slipped into a minor pullback, reaching as low as $2,402 near 02:00 UTC. The RSI briefly dipped into oversold, and the MACD triggered a golden cross around 02:30 UTC, setting the stage for bullish continuation. The support zone between $2,400 and $2,405 held firm, forming an HL, confirming early buyers’ intent.
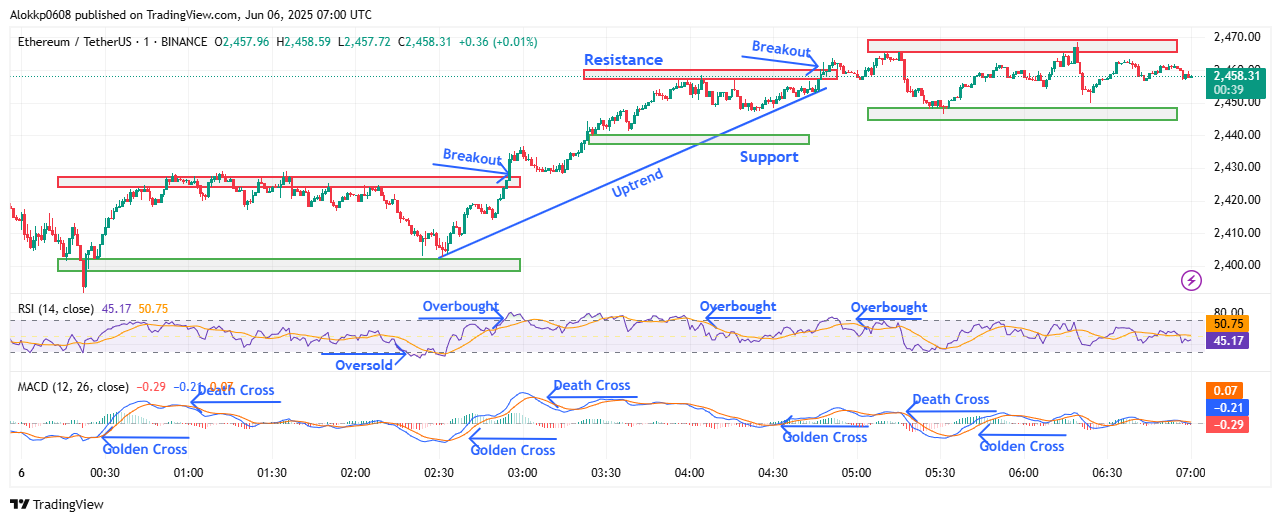
ETH/USDT M-1 Chart, Analyzed by Alokkp0608, published on June 6th, 2025.
Momentum picked up between 02:30 UTC and 04:00 UTC as ETH broke out above $2,425, flipping it into a new support zone. The move created a series of HHs and HLs, establishing a rising structure with strong confirmation from MACD’s golden cross and RSI entering overbought. A new resistance zone appeared near $2,460, where the price struggled briefly before continuing higher. The sharp move from $2,425 to $2,460 saw sustained bullish momentum, backed by RSI staying in the upper band and MACD lines diverging positively. This segment marked a clearly defined uptrend channel with solid demand after each pullback.
Uptrend Faces Resistance Around $2,465
From 04:00 UTC to 05:30 UTC, ETH price action remained constructive but began to face exhaustion near the $2,465 resistance. After the ETH breakout above $2,460, ETH reached a peak of $2,465 by 05:15 UTC but failed to maintain higher ground. This created a potential LH setup in the very short term. MACD printed a death cross just after the peak, and RSI exited the overbought zone, signaling momentum fatigue. ETH quickly retraced back toward the newly established $2,448 support, confirming a pullback phase. Still, the overall structure held above the trendline, showing buyers were not fully out.
Between 05:30 UTC and 07:00 UTC, ETH price entered a tight consolidation between $2,448 and $2,465. This zone has now turned into a short-term range with clear boundaries. Multiple rejections at $2,465 have now made it a visible resistance level, while buyers consistently stepped in near $2,448. RSI hovered around the mid-50s without any aggressive push, and MACD showed reduced momentum after a brief golden cross. The repeated HLs during this range indicate neutral momentum with a slight bullish bias. This is a pause rather than a reversal, as price continues holding above prior breakout levels, hinting at potential for renewed upside.
ETH Holds Firm After Pullback from $2,465
The most recent price action shows ETH price stabilizing after a dip from $2,465. Despite the pullback, the price found support at $2,448 and avoided a deeper correction. The structure remains healthy, with price consolidating in a narrow range, potentially forming a base for the next leg. While no fresh ETH breakout attempts occurred past 06:30 UTC, buyers defended support with conviction. RSI recovered from mid-40s and now sits around 50, while MACD remains muted but above the zero line. No lower lows were established, suggesting ETH is not in breakdown mode. However, a confirmed HH above $2,465 is needed for trend continuation.
ETH Bulls Pause Near Resistance, Direction Awaits Breakout
Ethereum price short-term outlook remains cautiously bullish, though immediate upside momentum has paused. The price currently trades near $2,458, nestled between support at $2,448 and resistance at $2,465. An ETH breakout above $2,465 could trigger the next push toward $2,475–$2,480. Failing that, a drop below $2,448 may invite a deeper test of $2,440 or even the broader $2,425–$2,430 support zone. Momentum is mixed, RSI is neutral near 50, showing indecision, while MACD’s recent death cross suggests fading momentum. As of now, bulls are still in control structurally, but the next move depends on reclaiming or rejecting the $2,465 ceiling.
Ethereum (ETH) Price Analysis of June 17th, 2025
The Ethereum price action today shows a volatile but technically structured movement. ETH began the day with bullish momentum, forming a steep uptrend from the $2528 support. A golden cross on the MACD at 00:09 UTC added confirmation to the breakout move. The price surged and cleanly broke above the $2578 resistance at 00:51 UTC, peaking near $2592 by 01:02 UTC. This rally marked a Higher High (HH) before momentum softened. RSI briefly entered overbought territory during this surge, reflecting the buying pressure. Post-breakout, ETH started consolidating above the old resistance, signaling a short-term pause in bullish strength.

ETH/USDT M-1 Chart, Analyzed by Alokkp0608, published on June 17th, 2025.
From 01:30 UTC to 02:35 UTC, ETH price reversed into a shallow downtrend, forming a series of Lower Highs (LH) and Lower Lows (LL). The price dipped to $2558 as RSI dropped toward the oversold zone. This period aligned with a death cross on the MACD at 01:02 UTC, adding pressure. However, by 02:35 UTC, MACD flipped bullish again with a golden cross, and ETH began recovering. The bounce established a new short-term support at $2580 and resistance at $2615. Notably, the recovery formed a Higher Low (HL), suggesting that buyers were regaining control after the intraday dip.
Stalled Breakout and Gradual Weakening
Between 02:35 UTC and 03:30 UTC, ETH price attempted to reclaim higher ground. Price action pushed toward the $2615 resistance but failed to break above, topping near $2607 by 03:13 UTC. A clear rejection at that resistance level formed another Lower High, and the price turned down again by 03:18 UTC. This marked the beginning of a longer downtrend channel. MACD confirmed this weakness with a death cross, while RSI began sloping downward but stayed mostly neutral, hovering near 45. The structure suggested that momentum was fading, with sellers slowly taking over.
From 03:30 UTC to 05:49 UTC, ETH price continued in a moderate downtrend with a well-defined structure of LHs and LLs. The price gradually fell toward the $2575 support and eventually breached it by 05:49 UTC. This breakdown followed consistent resistance from the $2600 zone. A new SL-RL pair at $2575 and $2600 emerged, reinforcing the sideways-to-bearish shift. Despite intermittent attempts to stabilize, the overall trend remained pressured. RSI dipped toward 37 during this leg, brushing against the oversold region, while MACD remained below the signal line, lacking any bullish divergence.
Consolidation Just Above Support at $2575
After the breakdown at 05:49 UTC, ETH entered a tight sideways channel. Prices hovered just above the $2575 support level, bouncing within a narrow $2575–$2585 range. A golden cross appeared on the MACD at 06:07 UTC, but this was not followed by any breakout or strong rally. RSI remained muted between 36 and 41, reflecting weak momentum and indecisiveness. Despite the MACD signal turning bullish, the lack of follow-through indicated either exhaustion or waiting for a trigger. Structurally, this phase formed a base of consolidation, but with no fresh HHs or HLs, the trend lacked commitment from bulls or bears.
ETH Struggles to Regain Traction After Breakdown
Ethereum’s price appears to be losing bullish momentum as it struggles to hold above the $2575 support. The trend has shifted to neutral-to-weak following repeated resistance rejections and a failure to break past $2615. MACD’s golden cross at 06:07 UTC hasn’t sparked a strong recovery, and RSI remains suppressed near the lower-mid range, showing hesitation. For now, support lies at $2575 and $2558, while resistance stands firm at $2600 and $2615. Unless ETH prints a decisive Higher Low followed by a breakout, sideways pressure may continue.
Ethereum (ETH) Price Analysis of June 25th, 2025
The Ethereum price action today shows a largely indecisive start within the $2,445–$2,465 range. Initial movements lacked clear momentum, but sellers began to exert pressure by 00:20 UTC, driving ETH to $2,437 by 00:38 UTC. This marked the day’s first Lower Low (LL), setting up a potential downtrend. RSI briefly dipped below 50, while a MACD golden cross at 00:44 UTC attempted to turn momentum. ETH responded with a push back toward resistance, climbing steadily before stalling near the upper range. The candle structure hinted at rejection pressure just before the 01:05 UTC peak.

ETH/USDT M-1 Chart, Analyzed by Alokkp0608, published on June 25th, 2025.
From 01:05 to 03:03 UTC, ETH price formed a Lower High (LH) at $2,468, followed by a decline that steepened into a clear downtrend. A MACD death cross near 02:15 UTC aligned with the price peak and marked the beginning of sustained downside. ETH printed another LL by 03:30 UTC and failed to reclaim previous intra-day highs, reinforcing bearish structure. RSI fell into the oversold region twice during this decline, once around 03:30 UTC and again just before 05:00 UTC. The $2,445 level flipped into a ceiling, while $2,425 emerged as the next significant support during this sequence.
Sharp Breakdown Then Bounce from Support Zone
Between 03:00 and 05:30 UTC, ETH price broke below the earlier support at $2,445 with a strong downward leg that extended to $2,425, forming another LL. This drop coincided with a series of MACD death crosses and only brief moments of consolidation. Prices tested the $2,425 zone multiple times but didn’t breach it decisively, signaling the presence of demand. By 05:23 UTC, RSI hit deep oversold levels once more. That marked the pivot. A MACD golden cross around 06:08 UTC hinted at a reversal, and ETH began building a potential Higher Low (HL) near $2,428.
From 05:30 to 07:00 UTC, ETH price climbed gradually with higher lows and higher highs, carving out a fresh uptrend on the 1-minute chart. Momentum shifted as candles began closing higher with increasing frequency, while MACD lines widened in bullish territory. The $2,425–$2,430 support zone held firm, enabling price recovery. ETH moved toward the newly formed resistance at $2,445, testing it multiple times. RSI touched overbought briefly near 06:30 UTC but backed off quickly, suggesting cautious optimism without overheating. Market structure turned constructive, but resistance remained a sticking point.
Struggle to Break $2,445 Caps Recovery Efforts
In the final leg into 07:24 UTC, ETH price traded just below the resistance ceiling of $2,445. Despite maintaining its upward structure with HLs and mild bullish MACD signals, the price lacked the punch to break through convincingly. Multiple attempts stalled around $2,444–$2,445, indicating strong sell pressure at this level. RSI hovered near 50, reflecting a balance of power with no clear directional edge. ETH’s short-term trend remains upward but lacks the volume surge typically needed for a breakout. A sustained close above $2,445 could flip the outlook, but as of the last candle, that hasn’t materialized.
ETH Recovery in Progress but Faces Hurdle Near $2,445
The Ethereum price short-term momentum has shifted bullish after rebounding from strong support near $2,425. However, upside is being capped by firm resistance at $2,445. The MACD has printed a bullish crossover at 06:08 UTC and remains in a golden cross formation, supporting the case for continued upward drift. RSI is neutral, sitting near 50, leaving room for movement in either direction. For further gains, ETH must break and hold above $2,445, which could open up a path toward $2,465. Immediate support lies between $2,425 and $2,430. Unless ETH clears its current ceiling, price action may stay range-bound or risk a fade.


