

In 2nd place in the market cap among cryptocurrencies, Ethereum (ETH) sits at the forefront of smart contracts, DeFi, and Web3 advancement. Its market behavior toward USDT displays macroeconomics and ecosystem events, such as ETF speculation and network upgrades. In this analysis, ETH key chart patterns, vital support/resistance levels, and momentum factors (including MACD and Fibonacci retracements) are dismantled in order to gauge possible breakout or reversal events. These technical details help the traders to move between phases of the market, but with external forces, such as a regulatory change or institutional appetite, the course of the Ethereum price can quickly turn.
Ethereum Price Analysis of August 15, 2025
On August 15, 2025, Ethereum traded in a range before breaking to the downside at 02:50 IST on a death MACD crossover, marking a sharp drop into a minor range that set the day’s low at $4,453. A subsequent upside breakout at 06:45 IST, supported by a golden crossover, drove the Ethereum price into an expanding triangle. The pattern’s downside breakout at 09:15 IST led to a falling channel, which reversed upward at 11:30 IST. Ethereum then formed a range and attempted an upside breakout at 14:00 IST, failing just after marking the day’s high at $4,666, before easing into consolidation.

Chart 1: ETH/USDT M5 Chart, Analysed by vallijat007, published on TradingView, August 15, 2025
- The Ethereum price formed a range, which broke out to the downside at 02:50 IST, supported by a death crossover of MACD. The Ethereum price spiked to the downside and formed a minor range.
- The minor range marked the low for the day at $4,453. It then broke out to the upside and formed another range.
- The range broke out to the upside at 06:45 IST, supported by a golden crossover of MACD. The Ethereum price spiked to the upside and formed an expanding triangle pattern.
- The pattern broke out to the downside at 09:15 IST. Price dropped in a downward-moving channel, which then broke out to the upside at 11:30 IST, supported by a golden crossover of MACD.
- Price spiked to the upside and formed a range. The range attempted to break out to the upside at 14:00 IST, but the breakout failed, and the Ethereum price marked the high for the day at $4,666.
Ethereum Faces Liquidation Wave, Profit-Taking, and Regulation
Recent market turbulence saw Ethereum drive the largest wave of leveraged liquidations after briefly breaking below the $4,600 threshold. Total crypto market liquidations surpassed $1 billion, triggered by fresh U.S. inflation data and Treasury policy pivots. Ethereum’s highly leveraged trading environment, with an average funding rate of +0.0078 percent, intensified the downturn. Bybit topped exchanges with $447 million in closed positions, and the exodus of “weak hands” slashed open interest by 34.8 percent. Watching Ethereum’s ability to hold the $4,600 level is now crucial since a further drop could cascadingly trigger more stop-loss orders and deepen selling.
Alongside this, ETH’s price had soared 86 percent in the previous ninety days, touching $4,765, its highest since late 2021. This rapid climb left nearly all holders in profit and brought natural resistance: old ICO “whales” started realizing gains, with $18.9 million in tokens sold recently. Technical signals pointed to an overheated market, as the weekly RSI hit 70.06 and futures open interest neared an all-time high barrier.
Regulatory moves also shaped sentiment. Hong Kong’s abrupt ban on smart contracts in cold wallets presented new hurdles for crypto custody providers, and while U.S. spot ETH ETF inflows remain robust, the contrast underscores growing jurisdictional risks.
Liquidations, Whale Selling, and Regulation Test Ethereum’s Resilience:
Ethereum’s price action reflects the push-and-pull of bullish inflows and profit-taking headwinds. A recent liquidation wave exceeding $1 billion, triggered by macroeconomic shifts, slashed open interest by over a third and forced leveraged traders out. Profit-taking from early ICO whales added selling pressure, while regulatory hurdles, such as Hong Kong’s smart contract ban, heightened jurisdictional risks. All this notwithstanding, ETH has positive U.S. spot ETF inflows and its deflationary supply framework on its side. The main support is on the 20-day EMA ($4,382); maintaining it would reinstate a rally towards $5,000. A breakdown carries the danger of escalating to the loss of $4,144. Therefore, this is a critical point in the bullish formation of Ethereum.
Ethereum Price Analysis of July 16, 2025
Ethereum price action on the day reflected a volatile but bullish trend, beginning with a low at $3029.63 within a downward-moving channel. A breakout at 02:40 IST triggered a sequence of converging triangle formations, with RSI breaching the 70 level twice, indicating overbought conditions. Despite a brief pullback, price resumed upward momentum, with successive range breakouts leading to the daily high of $3175 at 11:50 IST. Currently, Ethereum is consolidating in a range. A breakout to the upside could target $3300, while a breakdown may see a retreat toward $3100, depending on momentum confirmation.
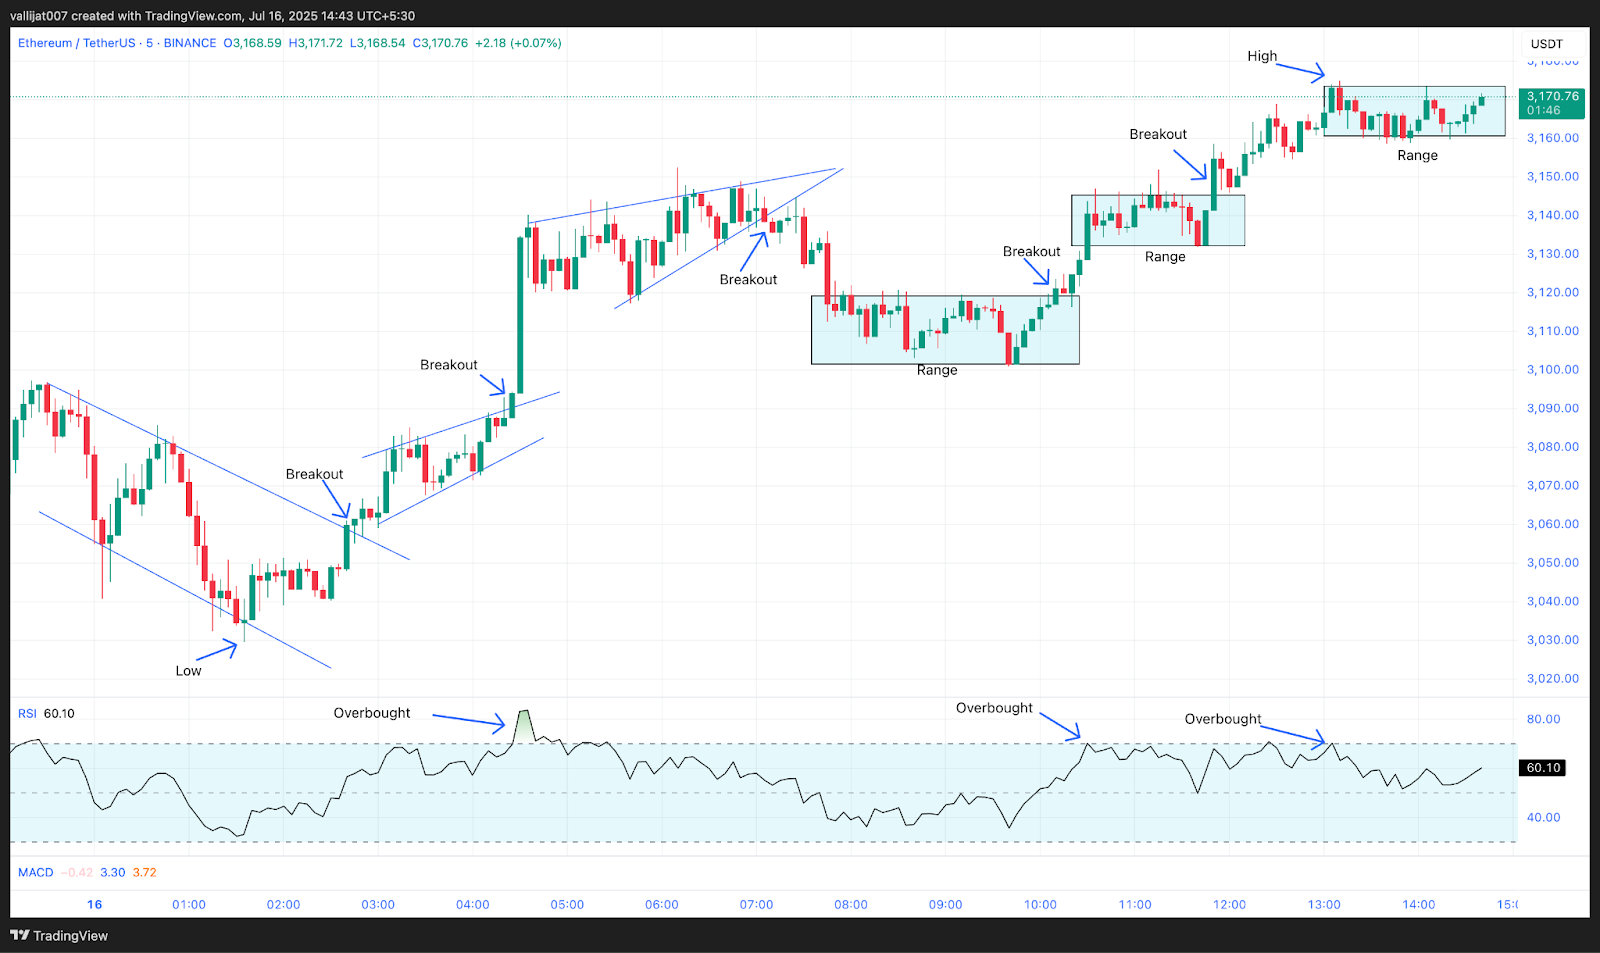
Chart 1: ETH/USDT M5 Chart, Analysed by vallijat007, published on TradingView, July 16, 2025
Channel Reversal at 21:10 UTC Establishes Daily Low at $3029.63
- The Ethereum price formed a downward-moving channel, which marked the low for the day at $3029.63. The downward-moving channel broke out to the upside at 02:40 IST, the Ethereum price spiked to the upside, and a minor converging triangle pattern formed.
- The converging triangle pattern broke out to the upside at 04:25 IST; the price spiked to the upside and formed another converging triangle pattern at 04:30 IST. RSI moved above the level of 70, indicating overbought market conditions, suggesting a reversal or at least a pullback.
- The converging triangle pattern broke out to the downside at 07:10 IST, the price spiked to the downside, and a range was formed. The range broke out to the upside at 10:10 IST, the price spiked to the upside, and another range developed at 10:30 IST. RSI again moved above the level of 70, indicating overbought market conditions.
- The second range again broke out to the upside at 11:50 IST; the price spiked to the upside, marking the high for the day at $3175, and formed a range.
- If the range breaks out to the upside, then the Ethereum price may rise to the level of $3300. If it breaks out to the downside, then the price may drop to the level of $3100.
Ethereum Gains Institutional Momentum with BlackRock Backing and Scalability Breakthroughs
Ethereum (ETH) is establishing itself as a Wall Street favorite, and the recent investment of BlackRock in multiple cryptocurrencies, totaling $150 million, is an indication that other coins are gaining increasing institutional interest alongside Bitcoin. This big smile not only increases the credibility of ETH but also shows the direction of further adoption of blockchain in the traditional financial system. The other factor raising the attractiveness of Ethereum is technological improvements. The implementation of zero-knowledge proofs (ZKPs) optimizes computational intensity and dispersal, which becomes appealing to corporate treasuries and large-scale businesses.
The underlying interest seemed to be strong, though its price declined slightly by a mere 1.73 percent to 2,980, with trading volume increasing by an encouraging 28.81 percent to 34.49 billion. The minor correction can show short-term profit-taking and not some indisposition in the fundamentals. Ethereum has long-term potential with institutional inflows, state-of-the-art scaling solutions, and financial integration in the real world. It is possible that as more enterprises and institutions come to understand its usefulness, ETH will continue to have upward momentum, which will further entrench its control over the smart contract ecosystem.
Ethereum Strengthens Long-Term Outlook with Institutional Backing and Scalability Upgrades
The intraday volatility of the Ethereum price is within favorable macro tailwinds. The close to a hundred and fifty million dollar investment by BlackRock is a testament to the increasing viability of Ethereum as an institutional-worthy investment. In terms of zero-knowledge proofs and MegaETH Layer 2 innovation, the persistent scalability bottlenecks facing Ethereum are finally being resolved, and there is a clear path to integrate real-world finance and achieve mass adoption. Even with a minor -1.73% price dip, surging 28.81% trading volume signals robust investor interest. As ETH continues bridging traditional and decentralized finance, its long-term growth story remains intact, with smart contract leadership.


