

If you want to invest in or buy the Floki token and wonder what the right price to start accumulating Floki is, then you are in the right place. As we go through the analysis, we will determine different patterns and how Floki reacts to them. We will also see support and resistance, which is a good area for any instrument to buy or sell. Without any further delay, let’s dive into Floki price analysis and explore different opportunities arising from it.
Floki (FLOKI) Price Analysis of May 9, 2025
Floki marked its daily low early in the session and formed a converging triangle pattern. A downside breakout occurred, supported by a MACD death cross, but failed to establish a trend. An upward-moving channel formed instead, though RSI moved above 70, signaling overbought conditions. The channel broke down later, again with MACD support. Price dipped and formed a range, which broke upward. A spike-and-channel followed, leading to a breakout that marked the day’s high. Resistance formed near the high, and support developed just below. With both levels intact, the Floki price moved into consolidation, awaiting a breakout signal for further direction.

Chart 1: FLOKI/USDT M5 Chart, Analysed by vallijat007, published on TradingView, May 9, 2025
The Floki price marked the low for the day at $0.00007610. After marking the low, it formed a converging triangle pattern, which broke out to the downside at 04:50 UTC, supported by a death crossover of MACD. Price was unable to form a downward trend; instead, an upward-moving channel appeared. In the meantime, RSI moved above the level of 70, indicating overbought market conditions, suggesting at least a pullback. The upward-moving channel broke out to the downside at 11:00 UTC, supported by a death crossover of MACD. Price spiked to the downside and formed a range.
Floki Nears Decision Point: Consolidation or Next Leg Up?
The range broke out to the upside at 14:30 UTC, supported by a golden crossover of MACD. Price spiked to the upside and formed a spike and channel pattern. The channel again broke out to the upside at 20:50 UTC, supported by a golden crossover of MACD. Price spiked to the upside, marking the high for the day at $0.00009467, and formed a resistance area at $0.00009500. A support area is formed at the level of $0.00009000.
The Floki token shows a clear uptrend where each Floki breakout to the upside hits the target. RSI is continuously hitting the 70 level, which indicates the conviction of the buyers. If the Floki price breaks the support area, then it may slide to the level of $0.00008000. If the price breaks out to the upside, then it may rise to the level of $0.00010000. Until then, the price may consolidate inside the defined range between the resistance and support areas. Traders and investors should be cautious before taking a trade in a consolidation market.
Awaiting Breakout from Floki’s Tight Range
Floki now trades between established support and resistance, with both bulls and bears showing hesitation. Momentum indicators reflect indecision, as MACD signals fade and RSI cools from overbought territory. If the support zone breaks, a slide toward lower levels is likely. Conversely, a break above resistance may bring another strong upside spike. Until one of these levels gives way, traders should expect sideways price action. A clear Floki breakout with volume confirmation is essential before new positions are considered. In consolidating markets like this, patience and confirmation are more valuable than prediction.
Floki (FLOKI) Price Analysis of May 13, 2025
The Floki price action has been dominated by a sequence of breakout setups across triangles, channels, and ranges. The session began with a downside breakout from a converging triangle that marked the day’s high. Bearish momentum was confirmed through multiple death crossovers, driving price lower through several support levels and range breakdowns. However, the session also featured intermittent bullish attempts, with several upward channel breakouts backed by golden crossovers. Despite brief spikes, none of the bullish moves sustained momentum for long. RSI touched oversold levels multiple times, indicating a market struggling to establish a clear directional bias.

Chart 2: FLOKI/USDT M5 Chart, Analysed by vallijat007, published on TradingView, May 13, 2025
The Floki price formed a converging triangle, which marked the high for the day at $0.00012370. The converging triangle broke out to the downside at 09:45 UTC, supported by a death crossover of MACD. Price moved to the downside and formed a support area at the level of $0.00011900. The support broke out to the downside at 14:20 UTC, supported by a death crossover of the MACD. Price spiked to the downside and formed a minor downward-moving channel. The channel broke out to the upside at 16:10 UTC, supported by a golden crossover of MACD. Price spiked to the upside, but the upside momentum failed, and price formed another downward-moving channel.
Floki Price Hits $0.00010350 Low, Eyes $0.00012500 on Floki Breakout
The channel broke out to the upside again at 19:00 UTC, supported by a golden crossover of MACD. Price spiked to the upside and formed another channel. In the meantime, RSI dropped below the level of 30, indicating an oversold market condition, suggesting a reversal or at least a pullback. This next channel broke out again to the upside at 20:25 UTC, supported by a golden crossover of MACD. The Floki price moved to the upside and formed a minor range.
The range broke out to the upside at 21:35 UTC, supported by a golden crossover of MACD, but the price failed to form a trend. Instead, another range appeared. This second range again broke out to the downside at 00:00 UTC, supported by a death crossover of the MACD. Price moved to the downside and formed another range. This third range broke out to the downside at 01:35 UTC, supported by a death crossover of MACD. Price dropped to the downside and formed a downward-moving channel, which marked the low for the day at $0.00010350.
That downward-moving channel broke out to the upside at 04:20 UTC, supported by a golden crossover of MACD. The Floki price spiked to the upside and formed an upward-moving channel. The upward-moving channel broke out to the upside at 07:30 UTC, supported by a golden crossover of MACD. If the breakout succeeds, then the price may rise to the level of $0.00012500, and if the breakout fails, then the Floki price may drop to the level of $0.00010000.
Floki Token Trades in Tight Range Amid False Starts and Fragile Momentum
The Floki price is still in a consolidation mode, with the price moving sideways most of the time. Although there were many golden crossovers and oversold RSI situations that instigated short-term rallies, these did not have continuation. In terms of the downside, the breakdowns have caused additional selling pressure that has led to the session low before the late recovery attempt. Hanging at a crossroads, the Floki token is now trading within an upward-moving channel. A confirmed Floki breakout can take the price up, but failure to hold this move can initiate another drop.
FLOKI Price Analysis of May 29, 2025
FLOKI coin began its session by forming a base range at the day’s low, followed by a breakout to the upside supported by bullish momentum from MACD. This move sparked an upward-moving channel, briefly lifting the price before a quick reversal cut the rally short. A range followed, which again broke upward and created another rising channel, eventually setting the high for the day. However, RSI indicated overbought conditions, and that warning sign played out with a swift breakdown. The market then churned through a series of tight ranges and channels, with multiple FLOKI breakouts failing to establish any sustained trend in either direction.
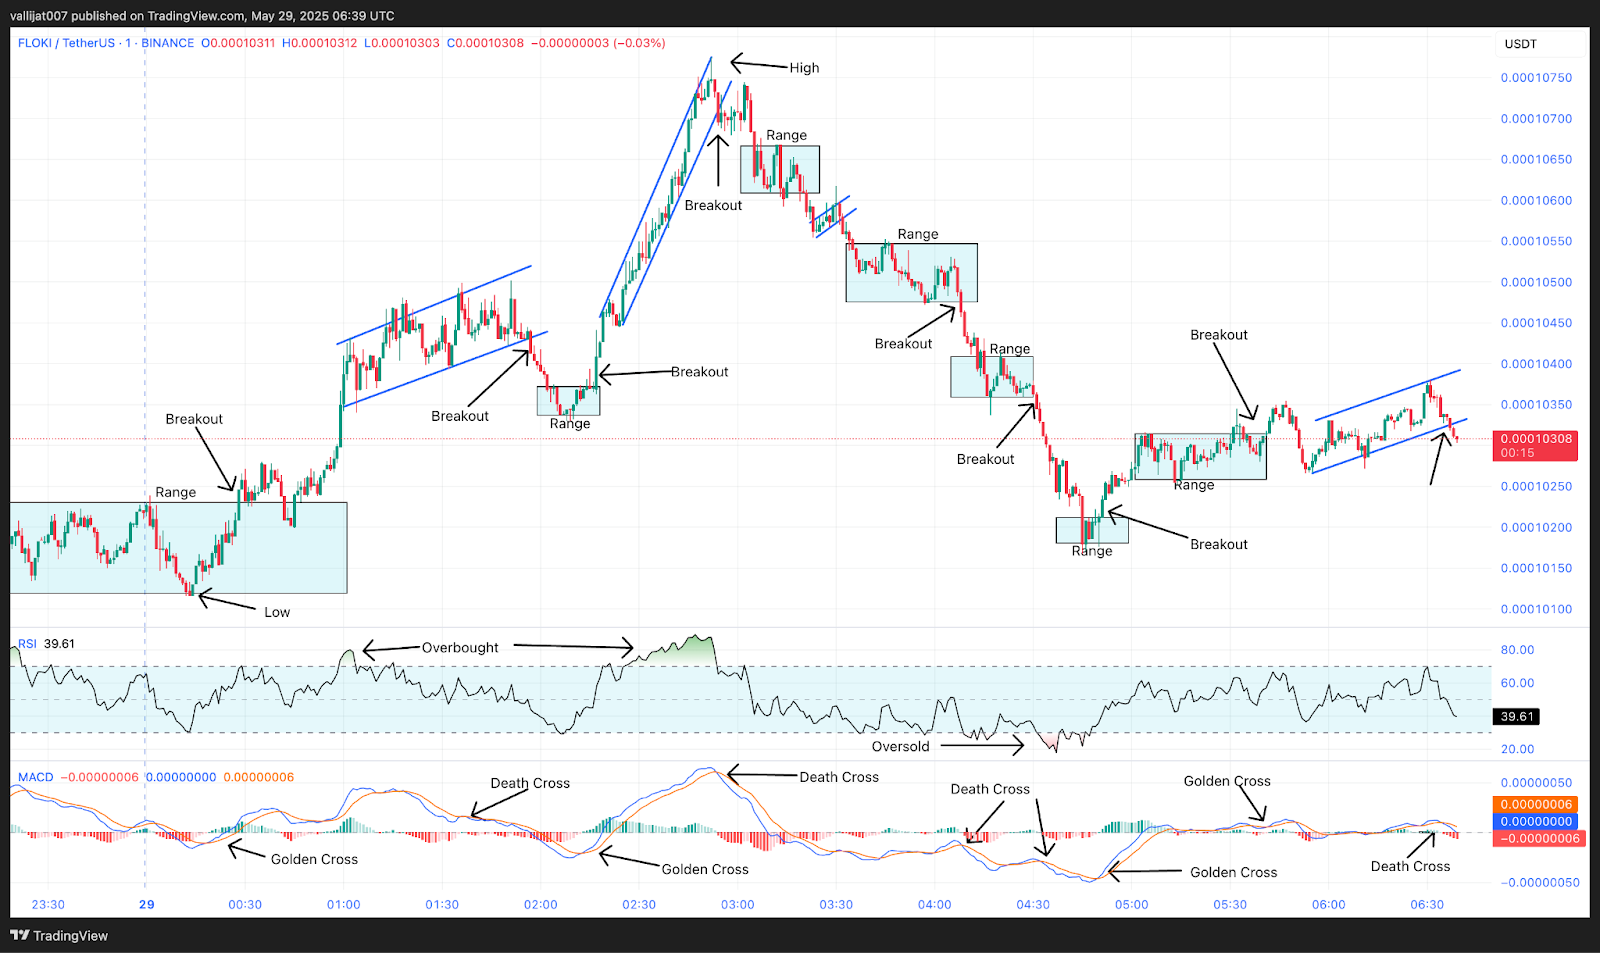
Chart 3: FLOKI/USDT M1 Chart, Analysed by vallijat007, published on TradingView, May 29, 2025
The FLOKI price formed a range that marked the low for the day at $0.00010117. The range broke out to the upside at 00:28 UTC, supported by a golden crossover of MACD, as price spiked to the upside and formed an upward-moving channel. The upward-moving channel broke to the downside at 01:57 UTC, supported by a death crossover of MACD, as the FLOKI price moved lower and formed a range. The range broke out to the upside at 02:17 UTC, supported by a golden crossover of MACD, and formed an upward-moving channel that marked the high for the day at $0.00010775.
Overbought RSI Triggers Channel Breakdown
In the meantime, at 02:50 UTC, RSI moved above the level of 70, indicating overbought market conditions and suggesting a reversal or at least a pullback. The upward-moving channel broke to the downside at 02:55 UTC, supported by a death crossover of MACD, and formed a range. This range broke out to the downside at 03:21 UTC, supported by a death crossover of MACD, and formed another upward-moving channel.
That channel broke out to the downside at 03:32 UTC, again supported by a death crossover of MACD, leading to another range. The range broke out to the downside at 04:08 UTC, supported by a death crossover of MACD, and another range was formed. In the meantime, at 04:15 UTC, RSI dropped below the level of 30, indicating oversold market conditions and suggesting a reversal or at least a pullback. The range broke out to the downside at 04:32 UTC, supported by a death crossover of MACD, and another range was formed.
The range broke out to the upside at 04:51 UTC, supported by a golden crossover of MACD, and a new range formed. The new range broke out to the upside at 05:42 UTC, supported by a golden crossover of MACD, but the upside FLOKI breakout failed to sustain, and the price dropped to the downside, forming an upward-moving channel. The upward-moving channel broke out to the downside at 06:37 UTC, supported by a death crossover of MACD.
Weak Follow-Through Signals a Cautious Trading Environment
The FLOKI price action reflected a highly volatile market, bouncing between technical levels with minimal follow-through. While golden MACD crossovers prompted upward moves, each was quickly countered by death crossovers, leading to erratic and short-lived trends. The RSI oscillated between extreme zones, further highlighting indecision and overreaction. Despite several attempts to rally, the upside lacked momentum, and each downward move was met with hesitation or recovery. Unless a clear structural breakout occurs with strong confirmation, traders should remain cautious. FLOKI coin continues to exhibit a sideways, volatile pattern where breakout trades are prone to failure.
Floki (FLOKI) Price Analysis June 3, 2025
The Floki price action on June 3 showcased volatile movements between support and resistance levels, driven by rapid MACD signals and shifting RSI conditions. The day began with a bullish breakout from a range, leading to the formation of an upward-moving channel. Price reached its high at $0.00009159 before losing momentum. After several failed attempts to sustain upward movement, FLOKI dropped and bottomed out at $0.00008772. Throughout the session, frequent golden and death crossovers of the MACD, alongside extreme RSI levels, created unstable price swings. Floki’s price behavior indicated a strong tug-of-war between bullish spikes and bearish rejections. Currently, the Floki price is trading at $0.00008800.
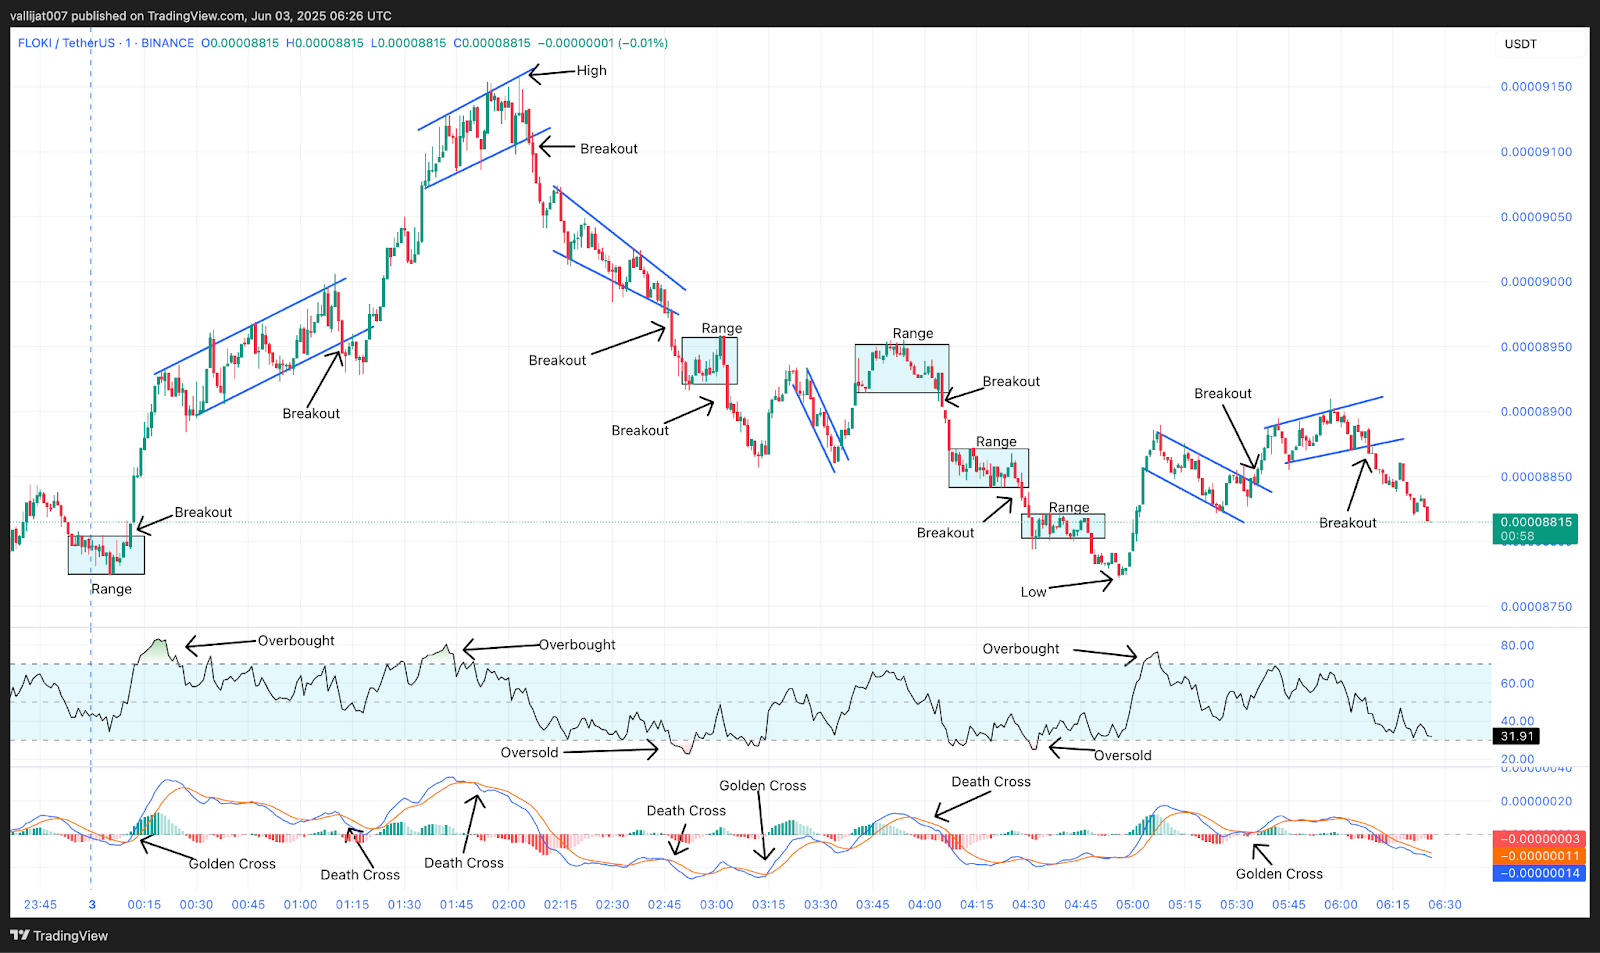
Chart 4: FLOKI/USDT M1 Chart, Analysed by vallijat007, published on TradingView, June 3, 2025
The Floki price formed a range, which broke out to the upside at 00:10 UTC, supported by a golden crossover of MACD. The price spiked to the upside and formed an upward-moving channel. The channel broke out to the downside at 01:12 UTC, supported by a death crossover of MACD, but the downside Floki breakout failed, and the price rose again, forming another upward-moving channel. The second upward-moving channel marked the high for the day at $0.00009159. This channel broke out to the downside at 02:06 UTC, supported by a death crossover of MACD, and formed a converging triangle pattern.
Triple Death Cross Breakdowns Establish Strong Support
At 02:50 UTC, RSI dropped below the level of 30, indicating oversold market conditions, suggesting a reversal or at least a pullback. The converging triangle pattern broke out to the downside at 02:47 UTC, supported by a death crossover of MACD, and a range followed. The range broke out to the downside at 03:03 UTC, supported by a death crossover of MACD, forming a downward-moving channel. The downward-moving channel broke out to the upside at 03:36 UTC, supported by a golden crossover of MACD, and a range followed.
At 04:05 UTC, a death crossing of the MACD reinforced this range’s breakout downwards, and another range developed. With the help of a MACD death crossing, the second range once more broke out to the downside at 04:28 UTC, resulting in a third range. With the help of a MACD death crossing, the third range also broke out to the downside at 04:48 UTC, reaching the day’s low of $0.00008772. Following the bottom, the Floki token saw a significant upswing, causing the RSI to surpass 70, a sign of overbought market conditions.
With the help of a golden MACD crossing and an upward-moving channel, the price of Floki developed a downward-moving channel that broke out to the upside at 05:36 UTC. At 06:08 UTC, this channel broke out to the downside, bolstered by a MACD death crossing. If the breakout succeeds, then the Floki price may drop to the level of $0.00008700. If the Floki breakout fails, then the price may rise to $0.00009200.
Floki Faces Indecision Amid Volatility
FLOKI’s intraday structure was defined by inconsistent momentum, with the Floki token oscillating within short-lived channels and ranges. Despite reaching overbought and oversold RSI conditions multiple times, neither side sustained control. The MACD continuously flashed conflicting crossovers, reinforcing the lack of a dominant trend. The failure of both upward and downward breakouts to develop into trends signals hesitation among market participants. Traders should be cautious, as Floki currently lacks directional strength and may remain in consolidation. A break above resistance with momentum could push the price higher, while a breakdown from support might trigger further declines. Confirmation is essential before taking positions.
Floki (FLOKI) Price Analysis of June 9, 2025
Floki token began the day in a tight range that broke out to the upside at 00:27 UTC, backed by a golden crossover of MACD, driving price to the daily high of $0.00008372. After hitting that peak, price action turned choppy. A series of patterns unfolded including converging triangles, downward and upward channels, and multiple failed ranges. Momentum oscillated between overbought and oversold, as RSI moved above 70 and below 30 multiple times. Despite bullish attempts, none held long enough to define a trend. The daily low of $0.00008170 formed near session end, capping a volatile but directionless session. The Floki price is currently trading at $0.00008220.
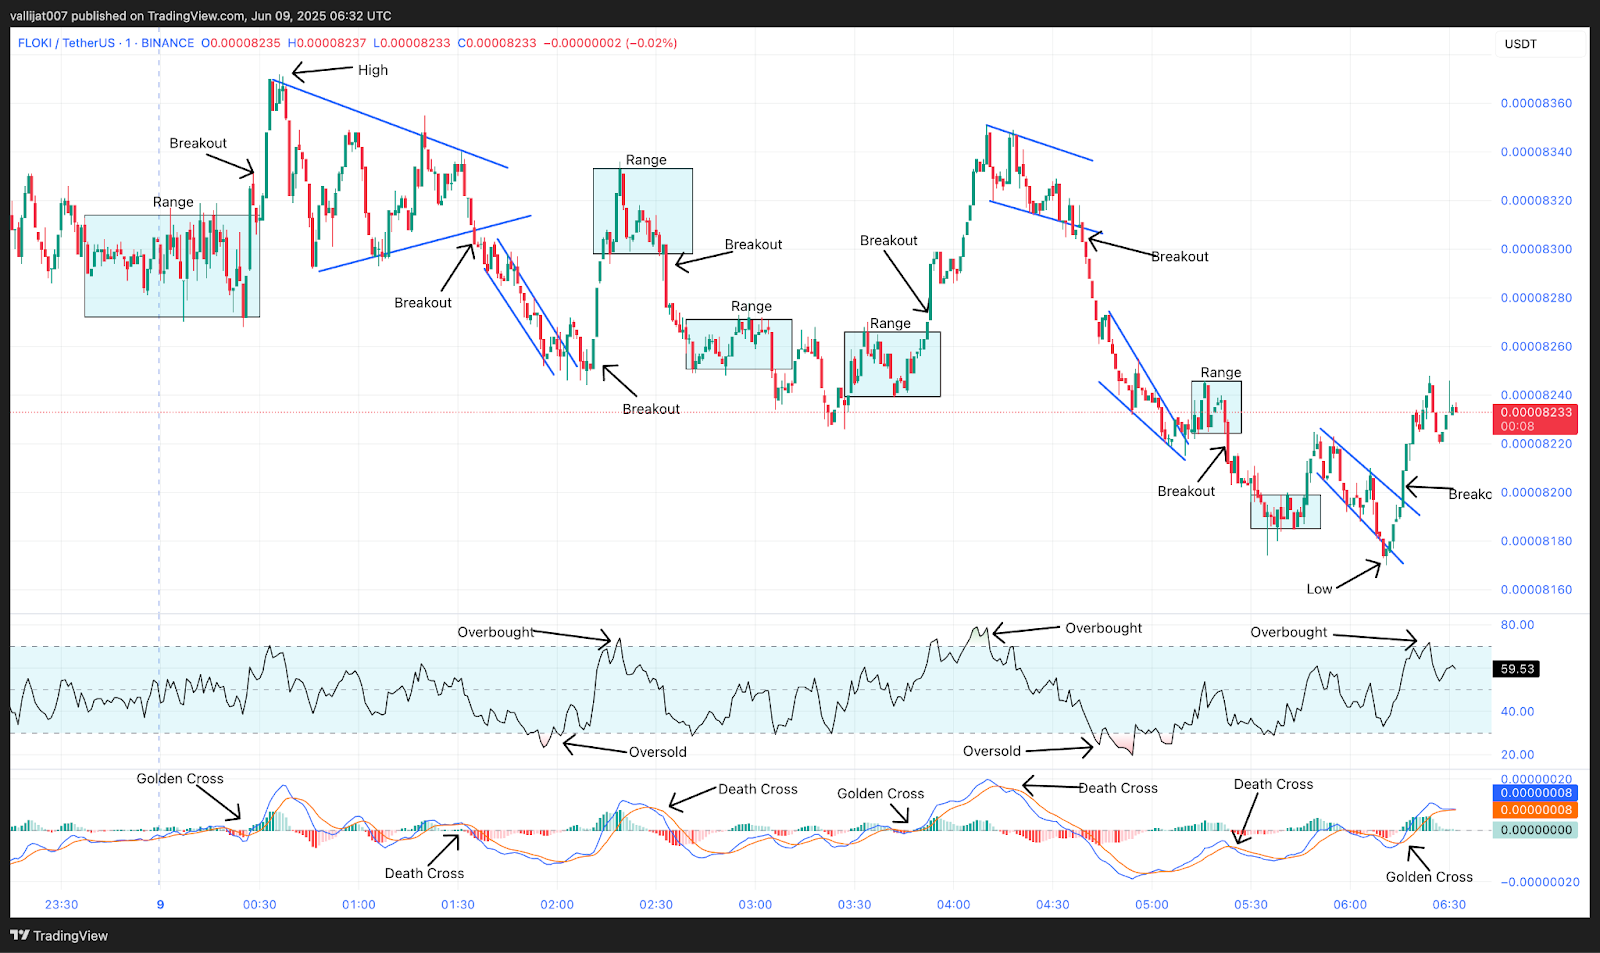
Chart 5: FLOKI/USDT M1 Chart, Analysed by vallijat007, published on TradingView, June 9, 2025
Floki price formed a range, which broke out to the upside at 00:27 UTC, supported by a golden crossover of MACD, pushing the price up and marking the high for the day at $0.00008372. After marking the high, the price formed a converging triangle pattern. This pattern broke out to the downside at 01:35 UTC, supported by a death crossover of MACD, leading to a downward moving channel.
FLOKI’s Consolidation Phase: Repeated Floki Breakouts Fail to Gain Traction
At 01:55 UTC, RSI dropped below 30, indicating oversold market conditions and suggesting a reversal or at least a pullback. The downward-moving channel broke out to the upside at 02:11 UTC, supported by a golden crossover of MACD, and a range formed. The range broke out to the downside at 02:33 UTC, supported by a MACD crossover, but failed to follow through, and another range developed. This second range also failed to produce a successful breakout, and a third range followed.
At 03:53 UTC, a golden MACD crossover helped the third range break to the upside and created an upward-moving channel. RSI exceeded 70 at 04:05 UTC, pointing to overbought market circumstances and implying either a reversal or a pullback. At 04:39 UTC, backed by a death cross of MACD, the upward-moving channel broke out to the downside, creating a convergent triangle pattern. Supported by a golden crossover of MACD, the converging triangle pattern broke out to the top at 05:10 UTC, followed by a range.
This range broke out to the downside at 05:23 UTC, supported by a death crossover of MACD, forming another range. That range broke out to the upside at 05:47 UTC, supported by a golden crossover of MACD, but the upside Floki breakout quickly faded, and the price formed a downward-moving channel. The downward-moving channel marked the low for the day at $0.00008170, then broke out to the upside at 06:15 UTC, supported by a golden crossover of MACD. Traders and investors should be cautious before placing breakout trades, as Floki is currently in a consolidation phase.
FLOKI Stalls Between $0.00008372 High and $0.00008170 Low
FLOKI price action showed classic consolidation behavior with repeated failed breakouts. Despite initial strength pushing the price to a high of $0.00008372, follow-through was weak. MACD and RSI signals alternated between bullish and bearish throughout the day, with overbought and oversold levels repeatedly hit. Price eventually bottomed at $0.00008170, suggesting downside pressure remains but lacks conviction. With no sustained trend and frequent reversals, traders should remain cautious. A confirmed breakout above resistance could push the price toward $0.00008550, while a downside break may test $0.00008000. Until momentum firms, the FLOKI token remains locked in consolidation.
Floki (FLOKI) Price Analysis of June 14, 2025
The Floki price action on June 13 reflected persistent volatility and indecision. The day began with a range that marked the high at $0.00008399. Early downside momentum was confirmed by a MACD death crossover, pushing price into an expanding triangle pattern. RSI briefly dropped below 30, signaling oversold conditions, but follow-through was limited. After multiple failed breakouts, the Floki token spiraled into a downward-moving channel, ultimately marking the session’s low at $0.00007502. Though brief bullish attempts followed, none sustained, with the Floki price continuously reverting to corrective structures. The chart structure highlights repeated trend failures, MACD crossovers, and frequent RSI extremes across the trading session.
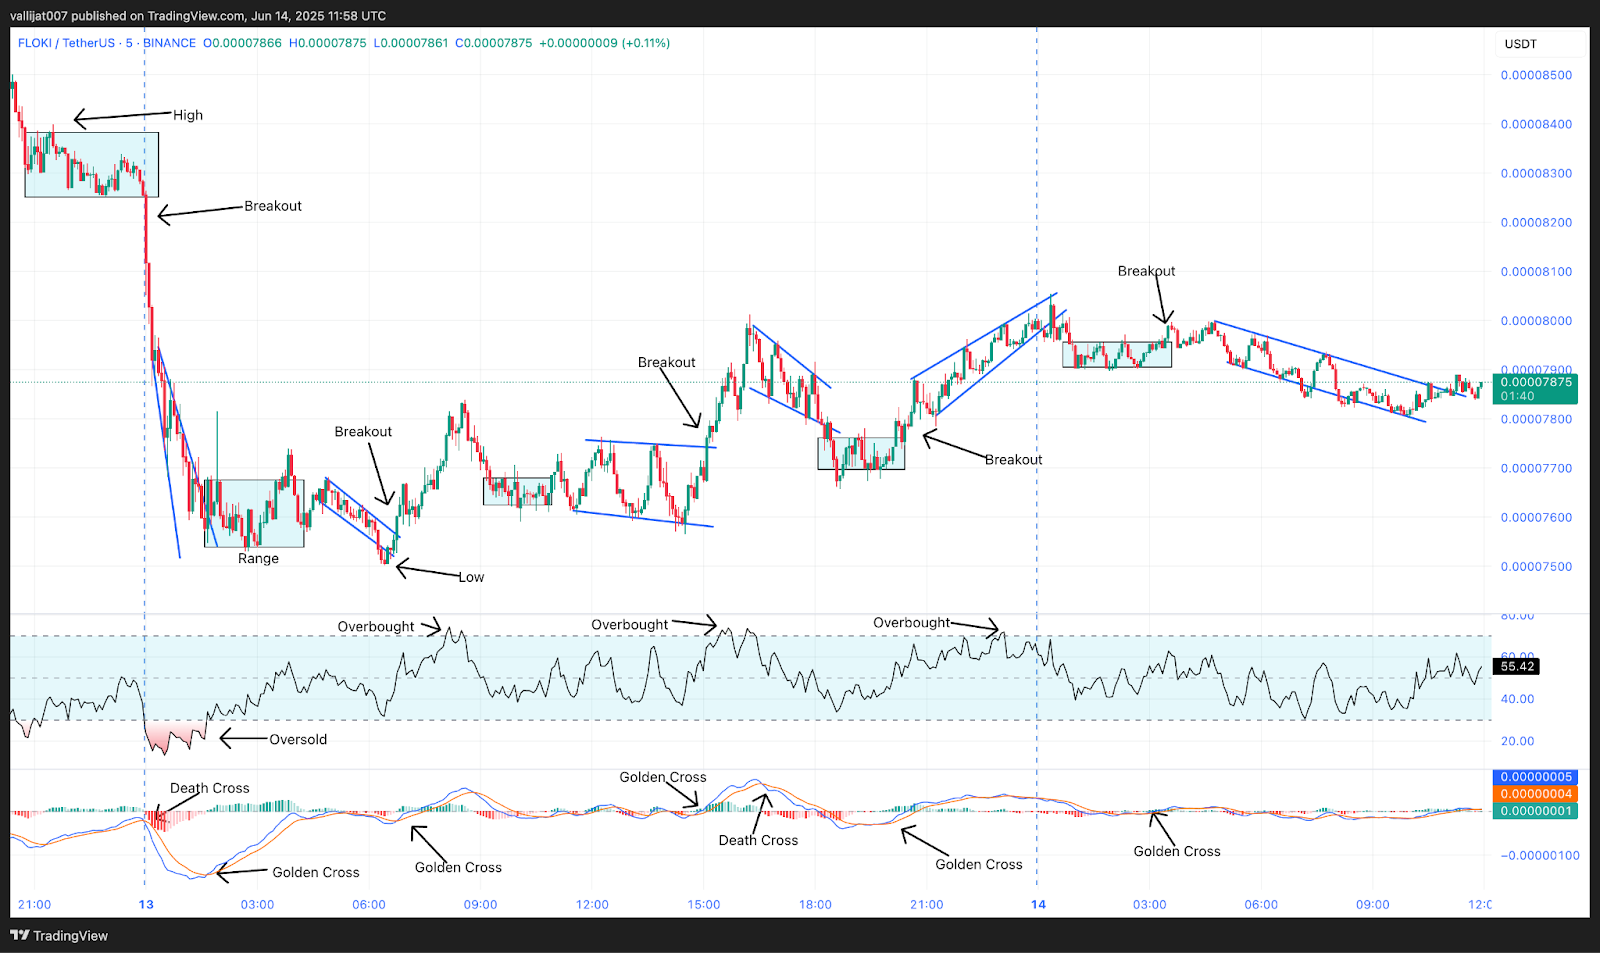
Chart 6: FLOKI/USDT M5 Chart, Analysed by vallijat007, published on TradingView, June 14, 2025
Floki price formed a range, which marked the high for the day at $0.00008399. The range broke out to the downside at 00:00 UTC, supported by a death crossover of the MACD price back to the downside, and formed an expanding triangle pattern. At 00:20 UTC, RSI dropped below the level of 30, indicating oversold market conditions, suggesting a reversal or at least a pullback. The expanding triangle pattern failed to break out to either side, and the Floki token developed into a range. The range broke out to the upside at 03:50 UTC, supported by a golden crossover of MACD.
Daily Low Established at $0.00007502 in Downward Channel
Price spiked to the upside, but the breakout failed and price dropped downward, forming a downward-moving channel. The downward-moving channel marked the low for the day at $0.00007502. The downward-moving channel broke out to the upside at 06:45 UTC, supported by a golden crossover of MACD. Price spiked to the upside and formed a range. The range broke out to the upside at 10:55 UTC, supported by a golden crossover of MACD, but the breakout soon failed, and price formed another downward-moving channel.
Final Channel Structure Emerges Following Failed Rally
The downward-moving channel broke out to the upside at 15:05 UTC, supported by a golden crossover of MACD. The Floki trend spiked to the upside and formed another downward-moving channel. At 15:30 UTC, RSI moved above the level of 70, indicating overbought market conditions, suggesting a reversal or at least a pullback. The downward-moving channel broke out to the downside at 18:15 UTC, supported by a death crossover of the MACD price back to the downside, and formed a range. The range broke out to the upside at 20:25 UTC, supported by a golden crossover of MACD.
Price spiked to the upside and formed an upward-moving converging triangle pattern. At 23:00 UTC, RSI moved above the level of 70, indicating overbought market conditions, suggesting a reversal or at least a pullback. The converging triangle pattern broke out to the downside at 00:25 UTC on 14th June 2025, supported by a death crossover of the MACD price back to the downside, and formed a range. The range broke out to the upside at 03:30 UTC, supported by a golden crossover of MACD. Floki trend spiked to the upside, but momentum soon faded, and price formed a downward-moving channel.
$0.00008399 High to $0.00007502 Low: Floki Remains Range-Bound with Fading Momentum
Unconvincing breakouts and sustained range-bound behavior characterized the Floki pricing movement. MACD signals repeatedly caused both positive and negative movements; however, few led to ongoing trends. Notably, every upward breakout, especially those at 10:55 UTC and 20:25 UTC, was followed by a loss of momentum, back into downward channels or consolidations. Overbought conditions often preceding reversals were indicated by RSI values above 70 at crucial points such as 15:30 UTC and 23:00 UTC. The ultimate design, a down channel, shows continuing market uncertainty. Stay wary, traders, as the Floki price is stuck between resistance around $0. 00008400 and support near $0. 00007500.


