

Have you been monitoring the GALA price charts? Are you curious about potential investment opportunities? As we delve into the latest GALA price analysis, you’re in the right place. The GALA Token has proved strong, now consolidating a little under the $0.01706 resistance level with signs of a potential upward trend. Technical indicators such as MACD have seen golden crosses, while RSI sits approximately at 57.36, showing a battle between the buyers and the sellers. The GALA price moves between support and resistance levels, and everything is preparing to break out or retrace. So let’s analyze the GALA price analysis, look for possible patterns, and predict the possible movements.
GALA Price Analysis of the Last 24 Hours
GALA Token began trading on April 22 at $0.0159, with the early hours spent consolidating near that support. The RSI dropped toward 39, giving a quick signal of an oversold condition at 06:35 UTC. GALA began moving up but stayed within the trading range. At 07:20 UTC, MACD flashes a golden cross under a steadily rising price, the trigger for GALA to propel upward, passing through the $0.016 mark at midday. Around 15:30 hours, the GALA price stuttered after a death cross appeared, but then buyers quickly came to the rescue, preventing further downward movement.
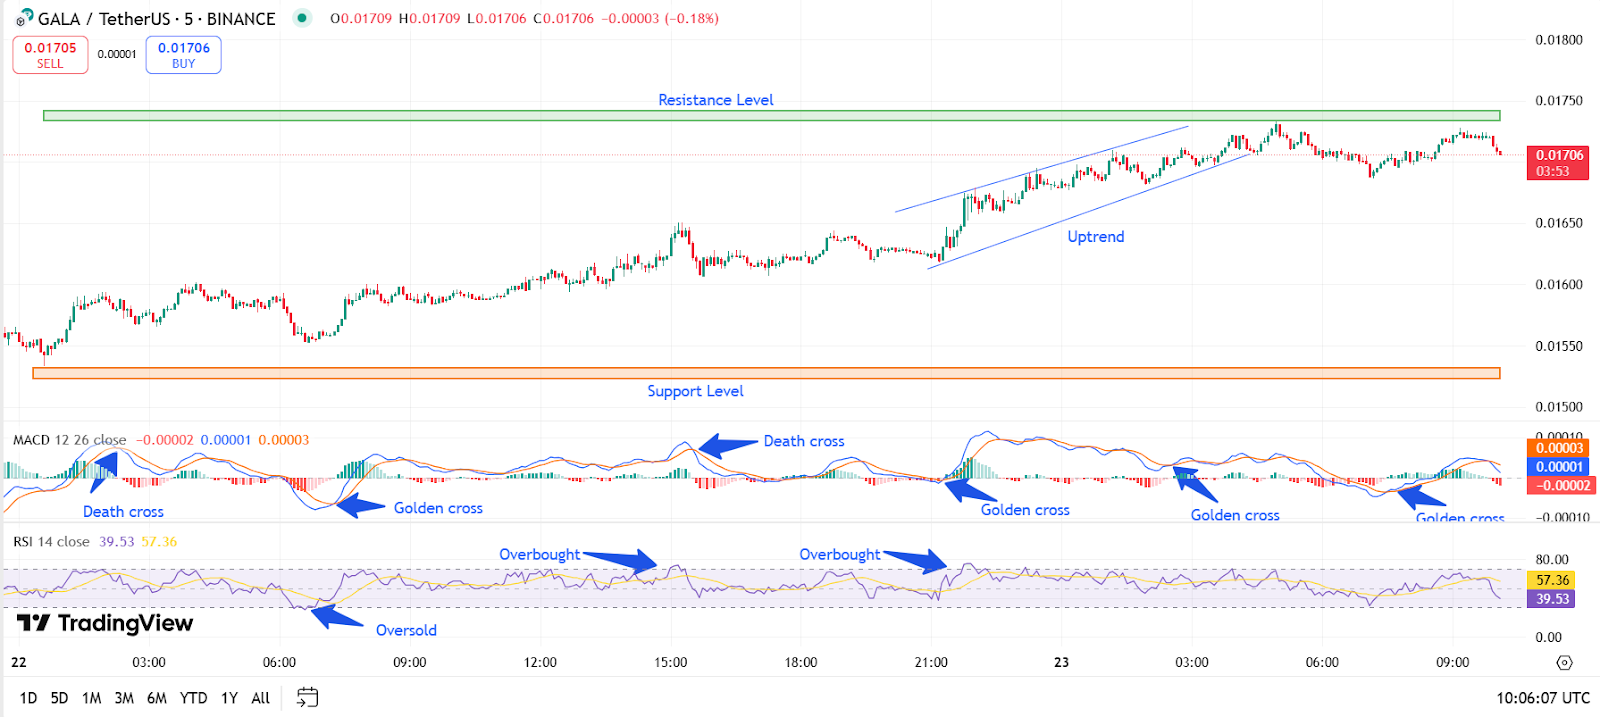
Chart 1, analysed by Anushri Varshney, published on TradingView, April 23, 2025
Momentum revived around 21:15 UTC with another golden cross on the MACD, which turned out to be the day’s most significant signal. This signal marked GALA’s entry into a clean uptrend channel characterized by a series of higher highs and lower lows. On the next day, GALA Token reached the resistance zone at around $0.0171, where it was experiencing overhead pressure.
As of 09:00 UTC, the MACD formed yet another golden cross, but momentum seems to be slowing as the RSI hovers at around 57, suggesting a cooldown period rather than exhaustion. Despite close resistance, the uptrend remains technically intact. Unless the RSI dips below 40 and the MACD confirms with the death cross, GALA appears to consolidate around present levels or break above another resistance at $0.0175. Should the channel break down, traders should watch as the support zone near $0.0154 comes back into play.
GALA Price Prediction for April 23, 2025
On April 23rd, GALA’s price action moved upward to test resistance at approximately $0.0173. It also indicated the powerful bullish momentum in the MACD by showing multiple golden cross formations as evidence; however, the bearish crossover indicated death crosses. The RSI was oscillating around the level of 57.36, which means there was equality in the amount of buying and selling. Currently, GALA is traversing between support and resistance levels, indicating a sideways period. Nothing can be said about where the price would have a clear breakout or downward correction.
What’s Next For GALA?
The future of the GALA coin will depend on whether it can break through the level of $ 0.0174 decisively. On the other hand, the inner conflict will be between bullish and bearish effects, evidenced by the Golden and Death Crosses of MACD, which tells us that we are in a period of heavy volatility and indecision. If the move can hold above resistance, a rally could be magical; if not, a long consolidation period, possibly retesting even lower support levels, will happen. Additionally, by tracking the RSI and volume trends, one will get more interesting insights into the strength of these breakouts or pullbacks in contributing to GALA’s ultimate direction.


