

Are you tracking the latest price movements of GALA and wondering if it’s gearing up for a breakout or another drop? You’re in the right place. GALA remains confined to its tight price zone, which extends from $0.0150 to $0.0157. Multiple bullish start-ups have happened, but the price remains below resistance at $0.0157, signaling that market participants doubt the upward trend. Before trading GALA, traders need to carefully evaluate both MACD and RSI signals since the current conditions produce conflicting momentum outcomes. The current GALA price movement requires our attention because it proves valuable to traders looking for short-term opportunities.
GALA Price Analysis For May 5, 2025
The GALA price action started with high fluctuations yesterday. The session began with early upward movement, but bearish pressure quickly took over. The prices were moving near the resistance level of $0.0157. This momentum indicated a good start to the trading day, indicating strength in the breakout. This was supported by a golden crossover that appeared on the MACD at 01:10 UTC. However, after reaching the resistance level at 02:30 UTC, the prices started moving in a downward trend. This was confirmed by the occurrence of a death cross at 06:10 UTC. This bearish downward trend dragged on until the prices hit the support at $0.0150.
After this hit, the token entered into the brief consolidation phase, moving into the upward channel. This started a new upward trend, giving hope for the traders to bounce back in the session. As the bull maintains the control, the prices moved upward towards the resistance level once again. With lower volatility and increasing false breakouts, the environment favors patience and disciplined trading over aggressive positioning.

Chart 1- GALA/USDT M5 Chart, Analysed By Anushri Varshney, Published on TradingView, May 5, 2025
A moderate upward trend followed, lifting the price token to $0.0157. However, this rally failed to breach the marked resistance level, causing the prices to fluctuate once again. Early on May 5, the token stabilized in the range of $0.0157- $0.015e. The GALA price is moving with multiple attempts at upward movement, but the price has struggled to form a clear pattern. By the end of the session, the GALA price settled around the $0.0156 level, unable to reclaim higher highs.
Death Cross Triggers GALA Breakdown- Will It Hold In Trading Range?
After hitting the support level, the GALA price action began moving upward, supported by MACD crossovers. An occurrence of multiple crossovers between 18:30 and 23:25 UTC caused the highest fluctuations in the price action. Despite repeated tests of the $0.0157 resistance, GALA failed to establish a breakout. MACD and RSI momentum indicators display conflicting indications since they continue alternating between oversold territory and weak upward momentum. This market consolidation shows bearish forces soaking up resistance at support areas without sustained bullish support.
GALA token maintains itself within a compressing trading zone because traders are waiting for strong market signals indicating the next movement direction. GALA is likely to stay in a consolidating pattern unless both trading volume rises or a substantial price breakout happens, therefore producing frequent intraday price fluctuations along with fake breakouts throughout the session. The current market requires both patience and confirmation for entering new positions.
When Will GALA Break The Trading Range?
Unless strong momentum picks up, GALA is unlikely to escape this consolidation anytime soon. Price behavior didn’t match the RSI indications along with the MACD indications, thus producing market uncertainties. A strong GALA breakout can define the next move of the coin. The next decisive move will depend on whether GALA can break above $0.0157 with rising volume. Until then, sideways action is likely to persist. However, Traders should watch for a breakout above $0.0157 or a drop below $0.0150 with strong bearish candles to confirm a breakdown and the next move.
GALA Price Analysis of May 9, 2025
The GALA price analysis over the last 24 hours shows a clear bullish movement, marked by consistently higher highs and smooth momentum. The price started the day near $0.01526, beginning a climb inside a well-defined upward channel, which shaped most of the early movement. By 03:00 UTC, GALA formed a golden cross on the MACD, initiating a sharper uptrend. RSI briefly touched the overbought zone, but the price stayed stable. A death cross followed near 06:30 UTC, balancing the momentum. From 08:00 UTC to 14:00 UTC, GALA coin traded sideways within the channel, showing consolidation. The RSI became neutral while the MACD hovered near the midline.

Chart 2- GALA/USDT M5 Chart, Analysed By Anushri Varshney, Published on TradingView, May 9, 2025
A golden cross emerged around 14:30 UTC, triggering renewed buying interest. This momentum built toward a breakout later in the evening. At 18:35 UTC, GALA broke above the channel at $0.01852, confirming a clean GALA breakout. Price quickly surged toward the resistance at $0.01954, briefly peaking at $0.01989. However, momentum faded as a death cross appeared around 20:00 UTC, causing a temporary dip. Price retraced toward the new support level at $0.01753, holding steady above it. Buyers re-entered at this support, pushing the price back into a mild uptrend overnight.
GALA Falls Below Resistance, Bulls Remain in Control
GALA stabilized just under $0.01920, showing strength just beneath resistance. GALA Coin extended its bullish structure for most of the day, staying inside an upward channel until its breakout near $0.01852. The structure of the rally was well supported by clear MACD golden crosses and RSI patterns that marked both momentum and exhaustion points. After the breakout, the price tested the resistance at $0.01954 but failed to sustain above it due to short-term overbought signals.
The support level at $0.01753 held strong during the pullback phase. Multiple rebounds from this zone confirmed buyer interest and kept the market biased to the upside. With price now consolidating near $0.01918, bulls remain in control, and a close above $0.01954 could spark another leg higher. However, caution is needed as overbought signals remain close on the RSI.
GALA Price Retests Support After Rejection Near $0.01950
The GALA price today started with mild consolidation near $0.01918, showing hesitation just below the $0.01954 resistance. After a brief attempt to push higher, the price was rejected, triggering a pullback toward the $0.01753 support level. MACD showed a bearish crossover during the downturn, and RSI slipped from overbought levels to neutral. Despite the drop, bulls defended the support zone well, leading to a small recovery. GALA is now hovering near $0.01840, stuck between key levels. Momentum remains fragile, and a decisive move above $0.01954 or below $0.01753 will likely define the next direction. For now, GALA Coin remains in a consolidation phase after yesterday’s breakout.
GALA Holds Steady as Market Awaits Next Move
The price remains in a holding pattern after a strong GALA breakout and retest of key resistance. Yesterday’s move above $0.01852 confirmed bullish momentum, but today’s rejection near $0.01950 shows that buyers are pausing just below the $0.01954 resistance. The price has since pulled back toward $0.01753, where support held firmly. Technical indicators show mixed signals; MACD is slightly bearish, while RSI has returned to a neutral range around 50. Despite this, GALA continues to form higher lows, suggesting bulls are still in control. As long as the price stays above $0.01753, the market bias remains upward. A breakout above $0.01954 would likely attract further momentum. If bulls manage to clear the $0.01954 barrier with strong volume, the next logical target lies near $0.02050, where selling pressure may return.
GALA Price Analysis For May 13, 2025
The GALA Price analysis over the last 24 hours shows a bullish momentum, correction, and sideways recovery. The session yesterday began with an early rise. By 06:00 UTC, RSI hit overbought territory, signaling the upcoming growth. GALA Coin moved upwards in an upward channel through a $0.0203 to $0.0212 rise from 06:30 to 07:00 UTC. From 07:00 to 15:00 UTC, GALA traded in $0.0210 and $0.0214. A minimal uptrend formed in the trading range, but multiple death crosses on the MACD suggested weakening momentum. Buyers failed to break above $0.0214, with the range top acting as resistance throughout the mid-session.
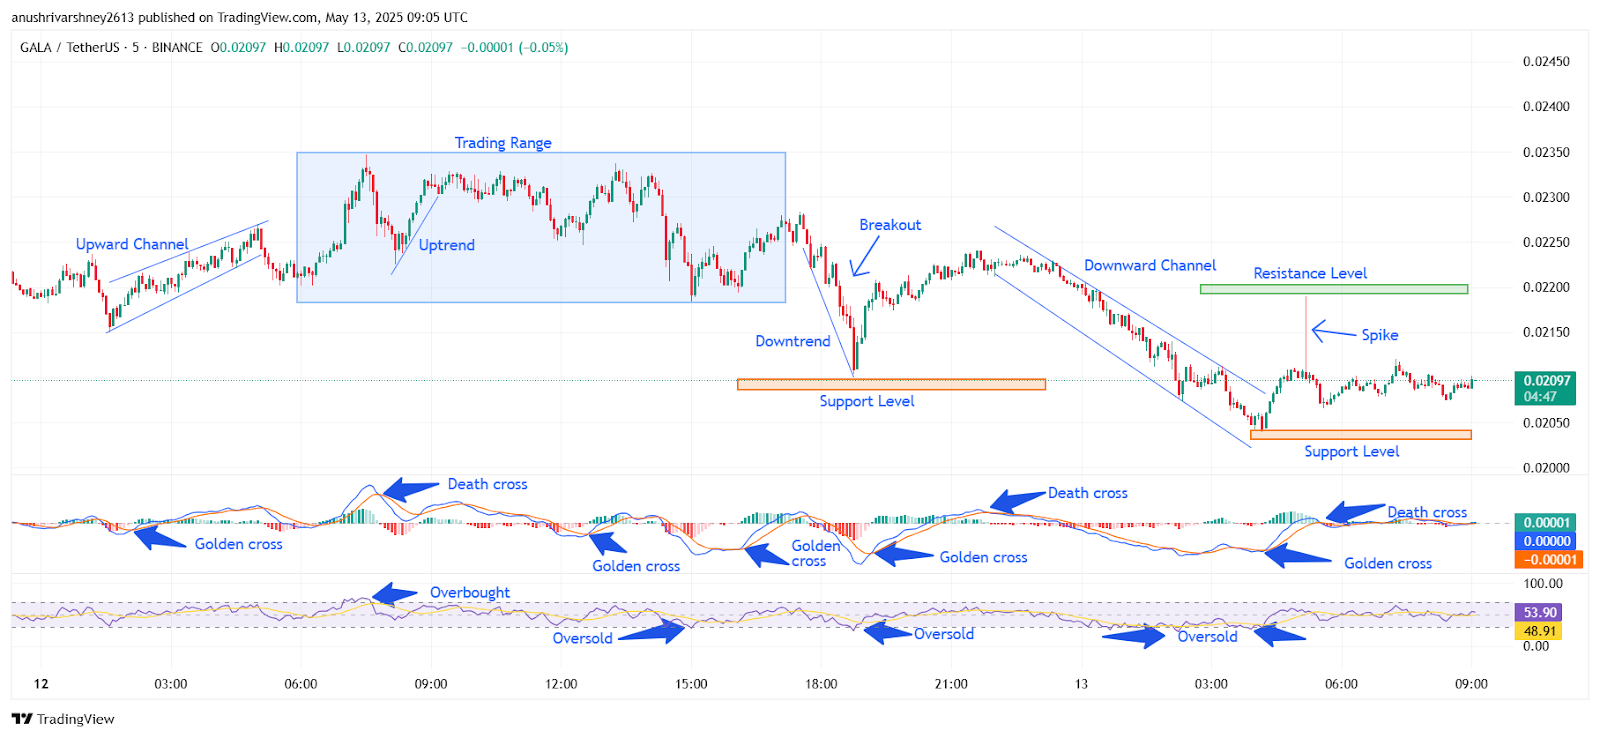
Chart 3- GALA/USDT M5 Chart, Analysed By Anushri Varshney, Published on TradingView, May 13, 2025
A breakdown came around 16:00 UTC. GALA Price dropped quickly in a downtrend, losing the range and falling to $0.0203 by 17:45 UTC. RSI touched oversold, while the MACD turned bearish. Around 18:30 UTC, GALA Coin attempted a breakout to $0.0210, but sellers quickly rejected the move, pushing it back under resistance. From 19:00 UTC, GALA trended in a clear downward channel of lower highs and lows, continuing until 03:00 UTC the next day.
A bounce followed from support. By 04:00 UTC, a new golden cross appeared, and buyers pushed the GALA Coin price sharply to $0.0215 by 05:30 UTC. However, this sharp spike was sold into, as the price failed to hold above the resistance level. After the failed breakout, the price fell under $0.0210 and traded sideways. From 06:00 to 09:00 UTC, GALA price stayed range-bound between $0.0205 and $0.0210.
Gala Coin Fails To Sustain Breakout, Stalls Below Resistance
The GALA Price stayed volatile today, starting with a steep fall inside a downward channel. A strong bounce followed from the $0.0202 support, forming a sharp GALA breakout toward $0.0215, but the rally was short-lived. Sellers stepped in, pushing the price back under $0.0210. GALA Coin moved sideways most of the day, staying within a narrow range. MACD crossovers and RSI levels stayed mixed, showing no clear trend. Buyers held the $0.0202 support again in the afternoon, but the lack of strength failed to maintain the momentum. GALA now trades at $0.02097 with a neutral bias.
GALA Breakout Fades As Support Holds – What’s Next?
GALA coin ended the session in a fairly tight range, as price action was constrained by overhead resistance at $0.0215 and firm support at $0.0202. The MACD indicator is currently neutral, while RSI is also neutral in the mid-range, indicating indecision in the market. In this context, GALA has the potential for continuing consolidation in the short term. A confirmed breakout above $0.0215 would likely move toward the $0.0220 area of price action, while a breakdown below $0.0202 opens up the potential for renewed downside pressure. For the foreseeable future, GALA Price is likely to remain sideways until one of these levels is breached. Traders should monitor for high-volume candles or directional signals near key levels to identify the next move. Overall, momentum remains weak, and market participants appear cautious.
GALA Price Analysis For May 24, 2025
The GALA price analysis shows a choppy but reactive structure as bulls attempted multiple breakouts, while bears continued to hold key resistance zones in check. The day started with an upward channel around midnight, pushing GALA Coin from the $0.01860 level toward the $0.01900 area. Momentum picked up as the MACD flashed a golden cross just before 00:30 UTC, which helped the price extend slightly higher. However, that strength faded quickly, and the pair moved into a trading range by 01:00 UTC, hovering between $0.01895 and $0.01910.
At 01:30 UTC, another golden cross showed up on MACD, followed by a minor uptrend that pushed the price to retest the upper part of the range. That move, however, lacked strength, and a sideways consolidation took over again from 02:00 to 03:00 UTC. The RSI entered overbought territory briefly around 02:45 UTC, suggesting buyers were pushing too fast. By 03:00 UTC, a death cross on the MACD confirmed that momentum had shifted.
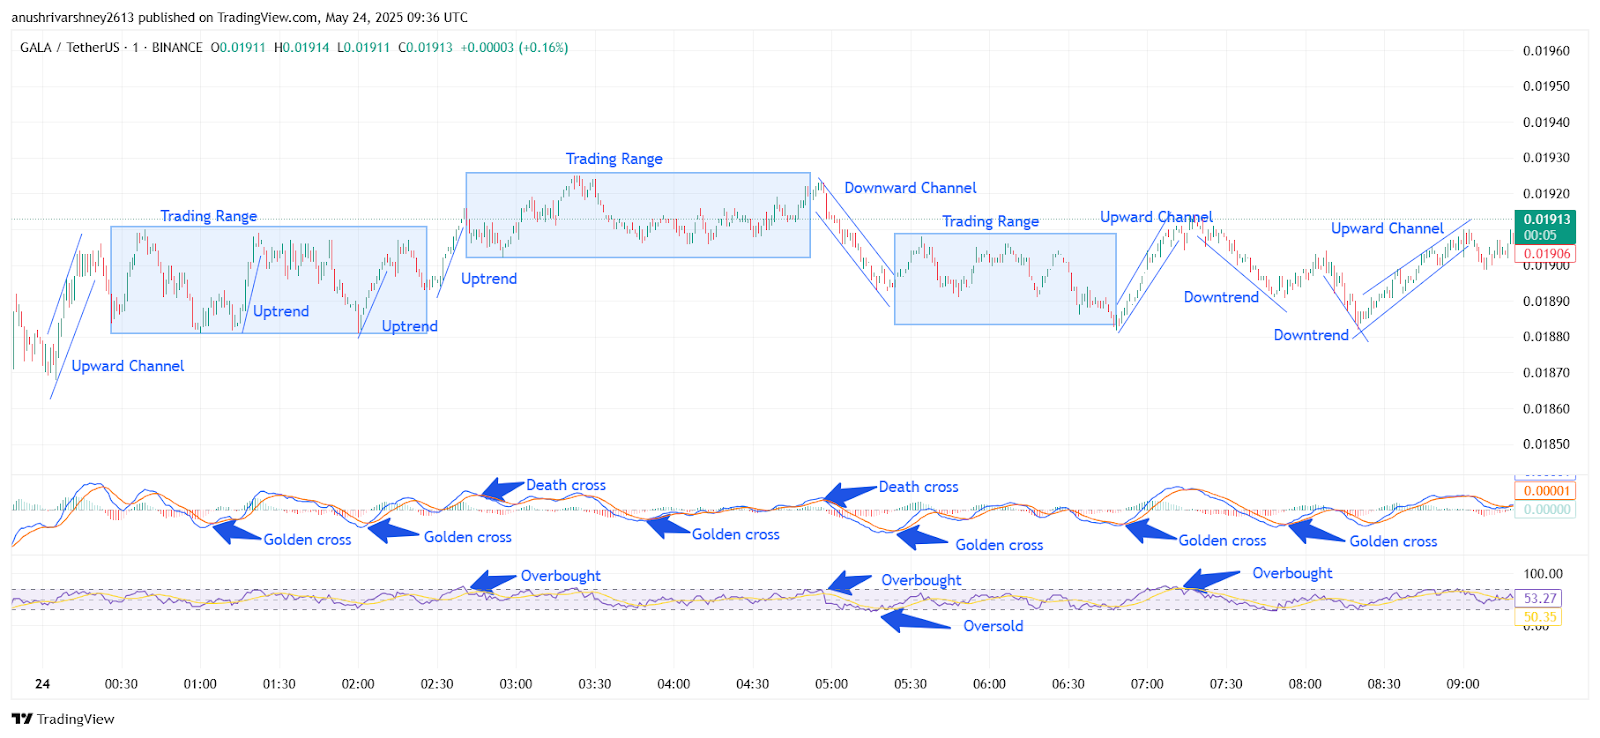
Chart 4- GALA/USDT M1 Chart, Analysed By Anushri Varshney, Published on TradingView, May 24, 2025
Between 03:30 and 05:00 UTC, GALA Price drifted sideways in a broader trading zone, unable to break through the $0.01915 resistance. A downward channel kicked in around 05:15 UTC, breaking below $0.01900 and sending the coin into a lower consolidation range. By 05:30 UTC, RSI hit oversold levels, and MACD printed another golden cross, triggering a short bounce.
GALA Price Breakout from $0.01880 to $0.01915 Sparks Upward Surge
The price remained trapped in a trading range from 05:30 to 06:30 UTC, with limited volatility. But around 06:45, a fresh GALA Breakout emerged as the price surged back into an upward channel, climbing from $0.01880 to $0.01915. RSI confirmed this move by pushing above 60, and MACD followed with a golden cross at 07:00 UTC.
From 07:15 to 08:00 UTC, however, a downtrend began to form again. The price retraced to $0.01885, forming a short-lived correction. But the buyers stepped in again, and from 08:15 UTC onward, another upward channel developed, slowly lifting the pair toward the $0.01910 zone.
GALA Coin Holds Range as Momentum Shifts Between Bulls and Bears
The current structure of the GALA price action reflects a market in waiting. Despite multiple attempts to break through the $0.01920 resistance, buyers have struggled to maintain control for more than a few hours at a time. The frequent presence of golden crosses on the MACD suggests that bullish momentum keeps trying to build, but each push is met with equally strong resistance. For now, GALA Coin remains in a tight range between $0.01880 and $0.01920, with no confirmed breakout. If bulls can push and hold above the $0.01920 level with strength, we could see a new uptrend. However, any rejection from here may push the price back to the $0.01860 zone. Traders should stay alert to a possible GALA Breakout while keeping an eye on momentum signals in the coming hours.
GALA Price Analysis For May 27, 2025
The GALA price analysis shows sharp intraday shifts that led to a clear GALA breakout by early morning. The day opened near $0.01959 but quickly slipped into a downward channel. Between 00:15 and 01:15 UTC, the GALA token saw consistent selling pressure. A bearish structure formed as lower highs and lower lows pulled the price to the day’s bottom near $0.01875.
The MACD showed a death cross early at 00:30 UTC, confirming bearish momentum. Shortly after, the RSI dropped below 30, hitting oversold levels around 01:00 UTC. This signaled exhaustion in the sell-off. Buyers wasted no time stepping in once RSI hit oversold territory, and a clean uptrend formed from 01:20 to 02:00 UTC. The GALA price rebounded sharply, marking a golden cross on the MACD and a recovery in RSI from oversold to neutral.
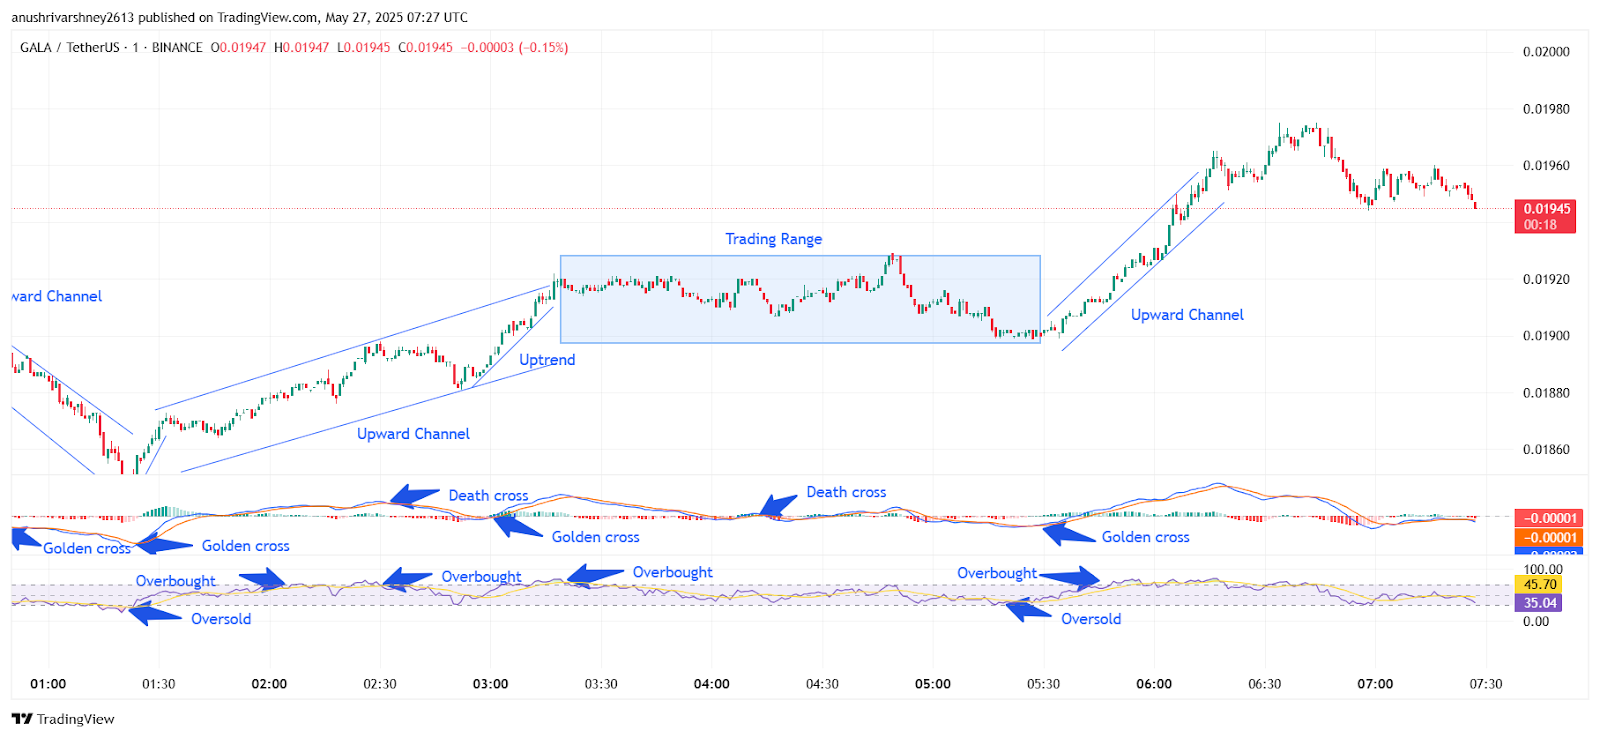
Chart 5- GALA/USDT M1 Chart, Analysed By Anushri Varshney, Published on TradingView, May 27, 2025
From 02:00 to 02:50 UTC, the token climbed inside an upward channel, making higher highs toward $0.01930. This steady rally faced its first pullback near 03:00 UTC, where the MACD showed a death cross again. RSI also touched the overbought zone, prompting minor profit-taking.
GALA Breaks $0.01925 Range, Hits $0.01975 High
The mid-section of the chart, from 03:15 to 05:00 UTC, reflects a trading range. The GALA price moved sideways between $0.01910 and $0.01925. Buyers and sellers struggled for control, but no clear trend emerged. MACD stayed neutral during this phase, and RSI fluctuated around the midline, showing balance.
By 05:10 UTC, the momentum shifted again. A fresh golden cross appeared on MACD, followed by a final upward breakout from the range. The GALA token gained strong traction, moving inside another upward channel from 05:20 to 06:15 UTC. Price climbed steadily to $0.01975, the intraday high. RSI entered the overbought zone again above 70, confirming buying strength behind the breakout. As of 06:20 UTC, the GALA price is hovering around $0.01954 with a slight dip after the rally. Despite the pullback, the structure remains bullish due to higher lows and breakout continuation.
GALA Token Eyes Stability After Breakout Surge
The GALA price strongly recovered after early losses, closing the trading session with signs of buyer control. The initial sell-off drove the token into a downward channel, but a clean reversal followed after hitting oversold RSI levels near $0.01875. That bounce sparked a sharp shift in sentiment, with bulls quickly taking control. Mid-session consolidation between $0.01910 and $0.01925 built a solid base for a late-stage GALA breakout above the range. The upward channel from 05:20 UTC pushed the GALA token to a high of $0.01975 before minor cooling.
Current support sits at $0.01950. If this holds, the bulls may retest at higher levels. On the downside, a break below $0.01910 could invite short-term weakness. RSI remains elevated but not extreme, while MACD still leans bullish. Overall, the GALA token maintains a favorable short-term structure as long as momentum stays above key support.
GALA Price Analysis For June 1, 2025
The GALA price analysis over the last 24 hours shows a clear sequence of consolidation, breakout attempts, and intraday trend reversals. The price started the day hovering inside a tight trading range between $0.01655 and $0.01665. Momentum was weak during the early hours, with RSI flat near 50 and MACD lines crossing into a death cross around 00:30 UTC, setting the stage for a dip.
By 01:00 UTC, the GALA coin broke below the range and entered a downward channel, falling sharply toward the $0.01610 zone. The RSI dropped into oversold territory while MACD confirmed the bearish wave. This correction bottomed out around 01:45 UTC.
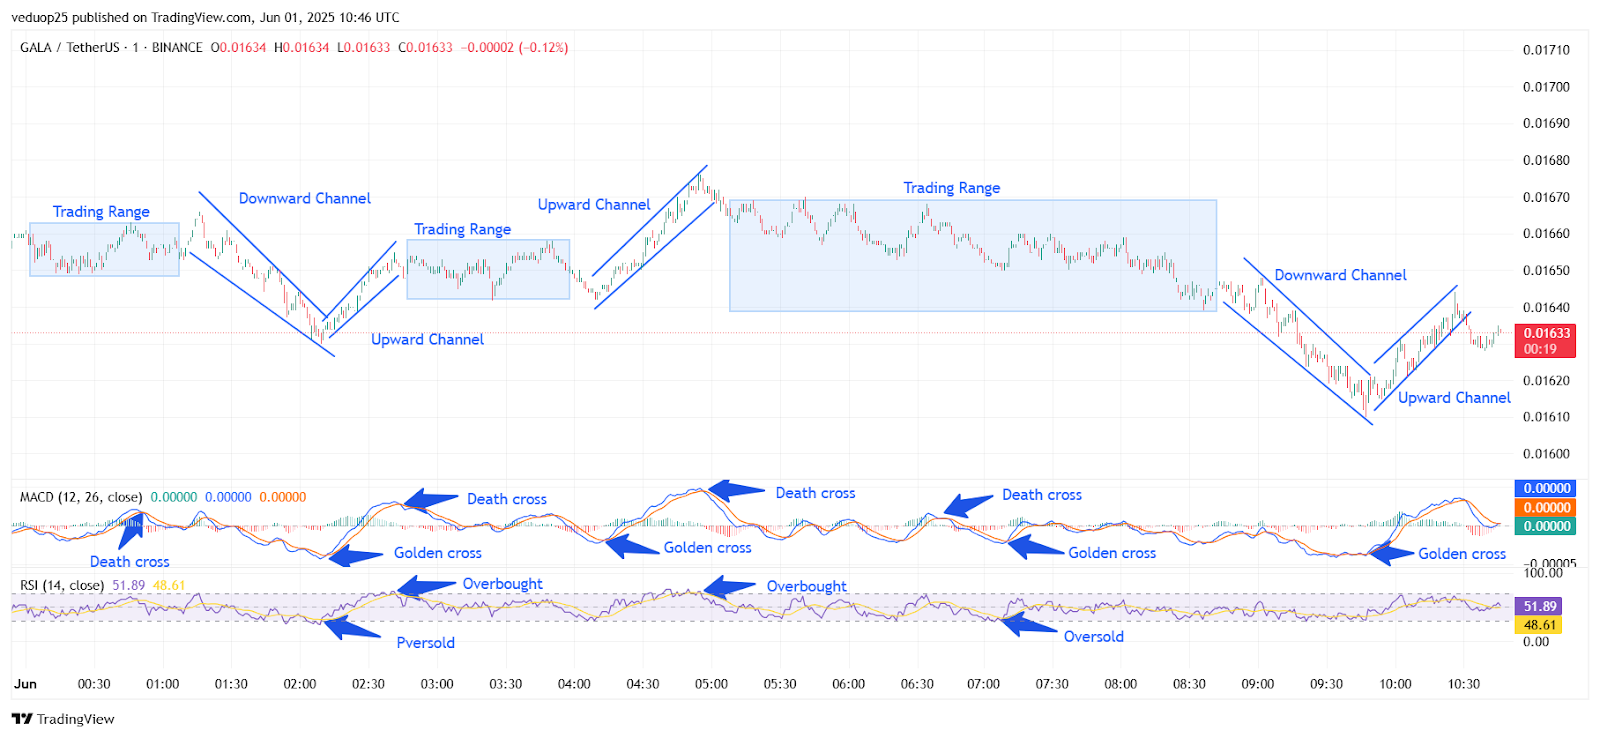
Chart 6- GALA/USDT M1 Chart, Analysed By Anushri Varshney, Published on TradingView, June 1, 2025
A reversal came soon after. From 02:00 UTC, the GALA price began climbing through an upward channel, showing strength backed by a golden cross on the MACD and RSI recovery above 50. This bullish move lasted until 03:15 UTC, with GALA reclaiming the $0.01660 level. The market entered another sideways range from 03:30 to 04:15 UTC, capped between $0.01645 and $0.01660.
GALA Price Hits $0.01690 Then Drops to $0.01610
But around 04:30 UTC, GALA coin picked up steam again, forming a sharp upward channel that peaked near $0.01690 at 05:00 UTC. The RSI touched overbought, signaling that buyers might be overextending. A death cross followed shortly after.
From 05:15 UTC to 08:15 UTC, the GALA moved sideways in a broad trading range, swinging between $0.01655 and $0.01675. Multiple MACD crossovers and mild RSI fluctuations defined this uncertain mid-session period. But by 08:30 UTC, bearish pressure returned, and the price broke lower into a new downward channel, falling from $0.01650 to $0.01610 by 09:45 UTC. Another GALA breakout emerged just before 10:00 UTC, with MACD flashing a new golden cross and RSI lifting from oversold. The price steadily climbed back upward, reclaiming the $0.01630–$0.01640 zone.
GALA Coin Outlook Remains Neutral With Potential for Breakout Reattempt
The overall outlook for the GALA coin remains neutral, with price consolidating after a day of sharp intraday swings. The repeated transitions between trading ranges and channels show that buyers and sellers are still battling for control, without a clear trend dominating yet. In contrast, the latest GALA breakout attempts have shown some strength, the resistance at $0.01670 remains firm. Momentum indicators like RSI and MACD are neutral at the moment, suggesting the market is waiting for a fresh trigger.
A strong move above $0.01670 could open the door for a retest of $0.01690 and possibly $0.01710. On the downside, if $0.01610 support breaks again, it may invite another wave of selling. For now, GALA price is in a wait-and-see zone. Short-term traders may look for confirmation before entering, while long-term holders might view this consolidation as healthy after recent volatility.
GALA Price Analysis For June 2, 2025
The GALA price analysis showcased a full-cycle pattern, moving from consolidation to a steep downtrend and recovering inside an upward channel. Today’s price action opened with GALA coin moving sideways in a tight trading range between $2.55 and $2.56. This lasted for the first 90 minutes of the day, showing no clear trend. The RSI remained close to 50, and the MACD lines were neutral, suggesting indecision.
Around 01:45 UTC, GALA price broke down from the range and entered a downward channel. Selling pressure picked pace as the MACD confirmed a death cross, and the RSI dipped sharply below 30, indicating oversold conditions. This downtrend lasted through to 03:15 UTC, with the price slipping toward $2.49.
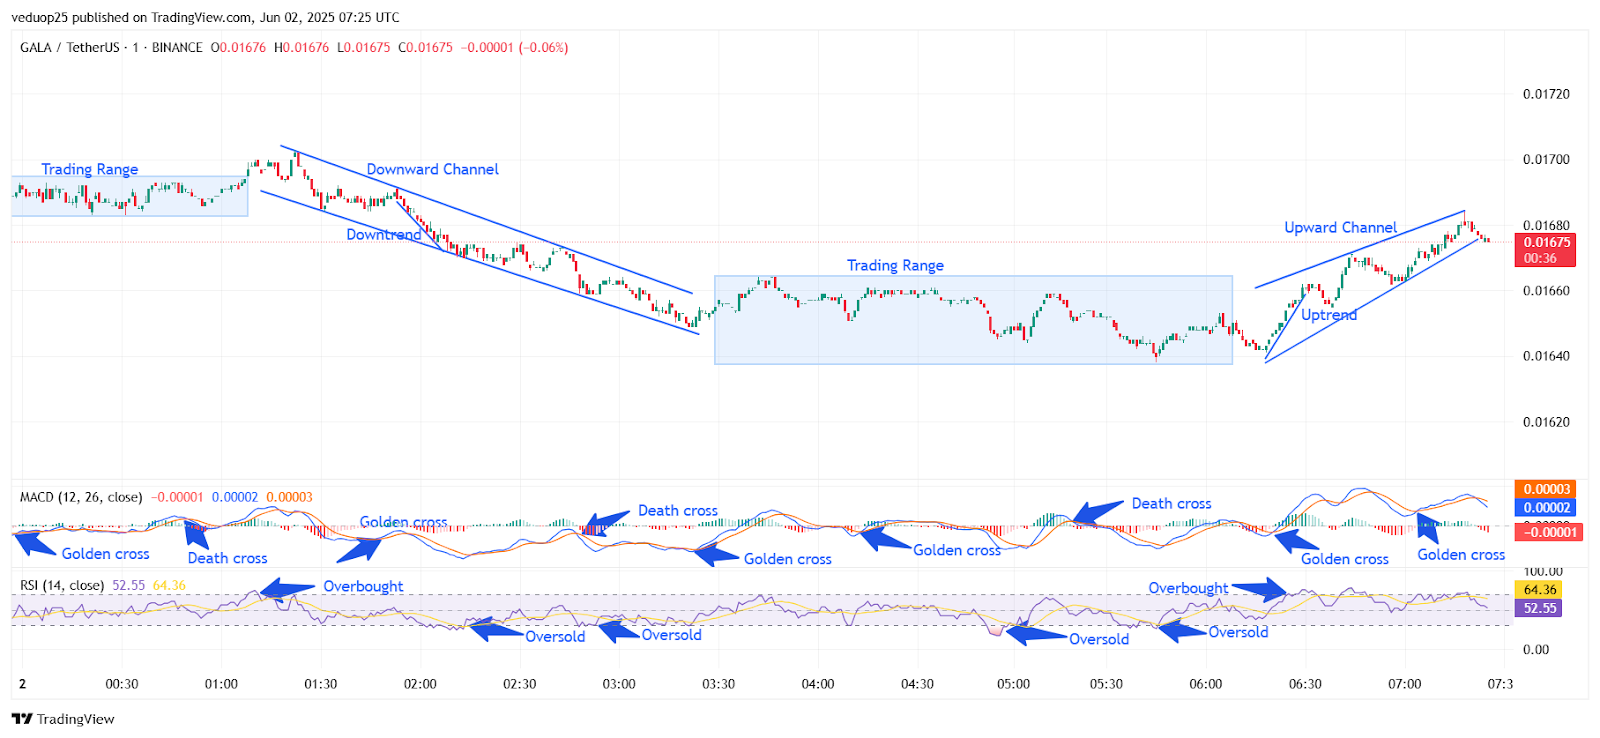
Chart 7- GALA/USDT M1 Chart, Analysed By Anushri Varshney, Published on TradingView, June 2, 2025
By 03:30 UTC, a MACD golden cross formed near the bottom of the channel, and the RSI showed a bullish divergence after staying oversold for a while. This triggered a mild recovery, and the price re-entered a new sideways trading range between $2.51 and $2.53. This range persisted until 05:15 UTC, with momentum flipping back and forth. Multiple golden and death crosses occurred on the MACD, showing the indecisiveness in this phase. RSI hovered near the neutral zone throughout.
GALA Breakout from $2.51 to $2.57 Faces Pullback Near $2.54 Support
The GALA breakout came shortly after 05:30 UTC. A clean MACD golden cross formed, and RSI crossed 60 as the GALA coin began to climb steadily. The price entered an upward channel, marking the beginning of a strong uptrend. From 05:30 to 06:45 UTC, GALA price climbed from $2.51 to $2.57, breaking past resistance levels. This move pushed the RSI into overbought territory, confirming strong buyer interest. However, near 07:00 UTC, a slight pullback began as the MACD printed another death cross and RSI dipped back toward 50. The price held within the upward channel, finding support near $2.54.
What’s Next for GALA Coin After the Breakout?
GALA coin showed a textbook breakout pattern in the last 24 hours, moving from range-bound action to a downtrend and surging through an upward channel. The GALA breakout above $2.53 brought strong momentum, but the price paused below resistance at $2.57. With RSI cooling off from overbought and MACD signaling mixed momentum, GALA price is now at a decision point. If bulls reclaim strength and push above $2.57, we could see a continuation toward the next resistance near $2.60. However, if support at $2.51 breaks, a pullback toward the $2.49 zone may follow.
Momentum indicators are neutral, so traders should watch for the next MACD crossover or a clear RSI move. Overall, GALA coin remains technically healthy, but the short-term direction will depend on whether the market follows through after yesterday’s breakout. A retest or clean breakout will shape the next move.
GALA Price Analysis For June 6, 2025
The GALA price analysis follows a well-organized price sequence, beginning with a breakout, followed by two strong channels and defined indicator signals. The session opened near $0.01530, with price action building steadily after a sharp GALA breakout at 00:15 UTC. This breakout lifted the GALA coin into a tight trading range between $0.01545 and $0.01562. By 01:00 UTC, momentum slowed, but the price stayed within range. A brief overbought RSI reading near 01:30 UTC indicated local resistance. MACD remained neutral, showing no strong bullish continuation. This sideways phase lasted until around 02:15 UTC.
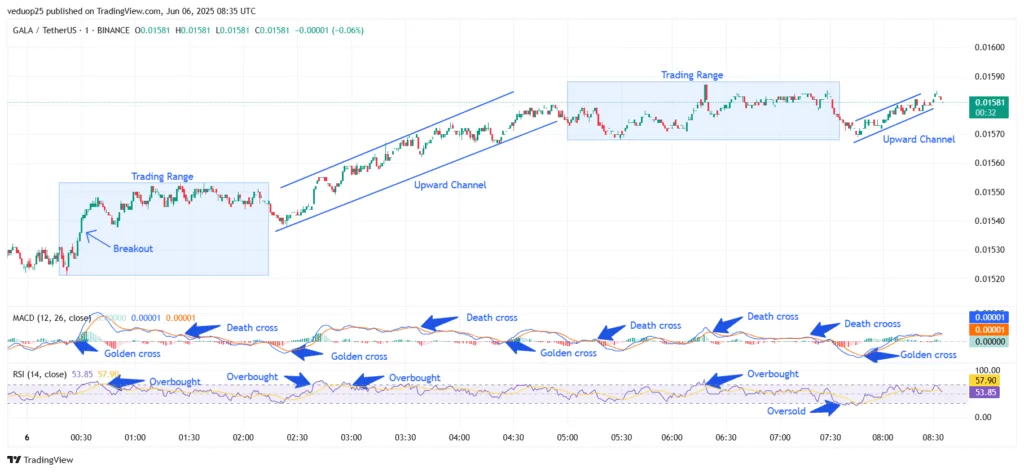
Chart 8- GALA/USDT M1 Chart, Analysed By Anushri Varshney, Published on TradingView, June 6, 2025
At 02:20 UTC, the GALA price began trending upward again. A golden cross formed on MACD at 02:30 UTC, supported by rising volume and RSI above 60. This started a strong upward channel from $0.01545 to $0.01585. Price climbed steadily, with brief overbought RSI levels between 02:50 and 03:20 UTC. The channel held firm until about 04:15 UTC, when a double death cross appeared on MACD, signaling a slowdown.
Consolidation Holds, Upward Channel Forms Above $0.01555
From 04:30 to 06:15 UTC, GALA coin consolidated for nearly 1 hour and 45 minutes, holding firm support between $0.01570 and $0.01588. RSI hovered between 50 and 60, and MACD showed multiple crosses without decisive strength. This phase lacked momentum but showed clear support zones.
The final major move came at 06:30 UTC. A short dip broke below $0.01565, pushing RSI into oversold territory near 07:10 UTC. However, a quick recovery followed. A fresh golden cross appeared on MACD at 07:45 UTC. Price began forming a mini upward channel from $0.01555 to $0.01581. By 08:30 UTC, GALA price held the upward slope with RSI at 58 and mildly bullish MACD. The session ended with GALA coin holding just above $0.01580, showing steady buyer interest despite minor pullbacks.
GALA’s Structured Moves and Steady Momentum
The GALA price showed a well-structured technical day, moving from a breakout into a defined trading range, and then rising steadily through a clean upward channel. Each phase followed a logical sequence, backed by golden and death crosses on the MACD and clear RSI signals. While the middle session saw sideways movement, the price held key support zones without major breakdowns. The late-stage upward channel reinforced bullish interest, ending the day near $0.01580. With indicators still moderately positive, GALA coin holds short-term strength. If the current structure continues and $0.01580 support holds, GALA coin may attempt a fresh GALA breakout above $0.01600 in the next session.
GALA Price Analysis For June 12, 2025
The GALA price analysis shows a choppy session with multiple short rallies and deep corrections, all controlled within bearish structures. GALA coin opened near $0.01700 at 00:00 UTC but lost steam early. A sharp downtrend started from 00:15 UTC, dropping the price toward $0.01670 by 00:45 UTC. This dip triggered the first golden cross on the MACD. RSI touched the oversold zone, but there was no major bounce. Price briefly reversed upward between 01:00 and 01:20 UTC, forming a small uptrend to $0.01690.
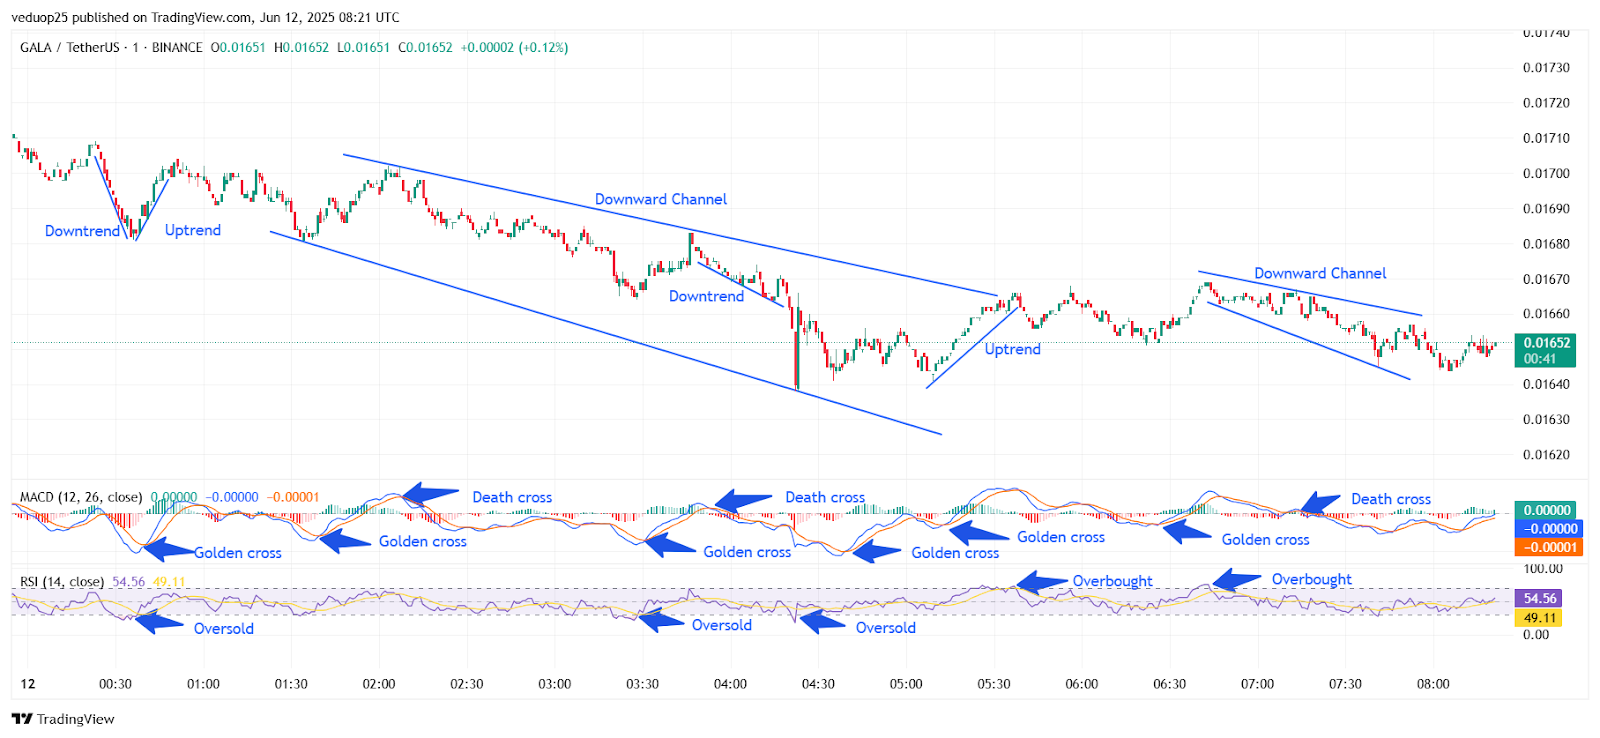
Chart 10- GALA/USDT M1 Chart, Analysed By Anushri Varshney, Published on TradingView, June 12, 2025
A clear downward channel started forming by 01:30 UTC. From 01:30 to 03:45 UTC, GALA price moved steadily lower. MACD showed multiple golden crosses but failed to generate any strong GALA breakout. RSI dipped again near 03:30 UTC, confirming continued weakness. GALA slid to $0.01635 by 04:00 UTC as another short downtrend kicked in.
Sharp Drop and Weak Recovery Keep GALA Coin Range-Bound
The deepest fall came at 04:15 UTC when GALA coin dropped sharply from $0.01635 to $0.01600. RSI entered deep oversold territory, and MACD flipped into a clean death cross. This steep correction was followed by a quick recovery. Between 04:45 and 05:30 UTC, GALA formed its strongest uptrend of the day, bouncing from $0.01600 to $0.01665. MACD flipped bullish again, and RSI crossed above 50, signaling short-term strength. That rally stalled near 06:00 UTC. Price began another slow drop inside a smaller downward channel. From 06:00 to 07:15 UTC, the GALA price moved lower from $0.01670 to $0.01645.
MACD gave a fresh death cross at 07:15 UTC. RSI, which was overbought near 06:15 UTC, began falling steadily during this phase. In the final session, between 07:30 and 08:15 UTC, the price flattened out. GALA coin hovered between $0.01645 and $0.01660 with no clear direction. MACD flashed a weak golden cross near 08:00 UTC, and RSI held near neutral levels. There was no significant GALA breakout by the end of the window.
GALA Coin Stuck in Channels, Bulls Show Weak Follow-Through
GALA coin struggled to hold momentum across the day, moving mostly inside two downward channels. While the price briefly spiked during the early morning hours near 05:00 UTC, the GALA breakout lacked strength and failed to hold above the $0.01670 level. MACD gave several golden crosses, but none of them translated into lasting bullish moves. RSI moved between oversold and neutral zones, highlighting the choppy nature of GALA price action. Sellers stayed active at every minor rally.
The trend remains bearish unless bulls can reclaim the $0.01670 resistance and push toward $0.01700 with volume. On the downside, support remains at $0.01600, and any breakdown below this could lead to deeper losses. GALA coin needs stronger confirmation before any meaningful trend reversal can be considered in the near term.
GALA Price Analysis For June 17, 2025
The GALA price analysis highlights a failed recovery attempt followed by a steady drift inside a downward channel. After an early morning sell-off, the GALA coin staged a sharp rebound, but bullish momentum didn’t last long as price action turned weak again in the other half of the session.
At 00:15 UTC, the GALA price touched a low near $0.01440, forming a short-term bottom momentum. The RSI had entered deep into oversold territory, and the MACD showed a golden cross around 00:30 UTC. This triggered an upward push, and GALA entered an upward channel. From 00:30 to 01:30 UTC, the coin climbed from $0.01440 to around $0.01530, fueled by short-term buyers taking advantage of the dip.
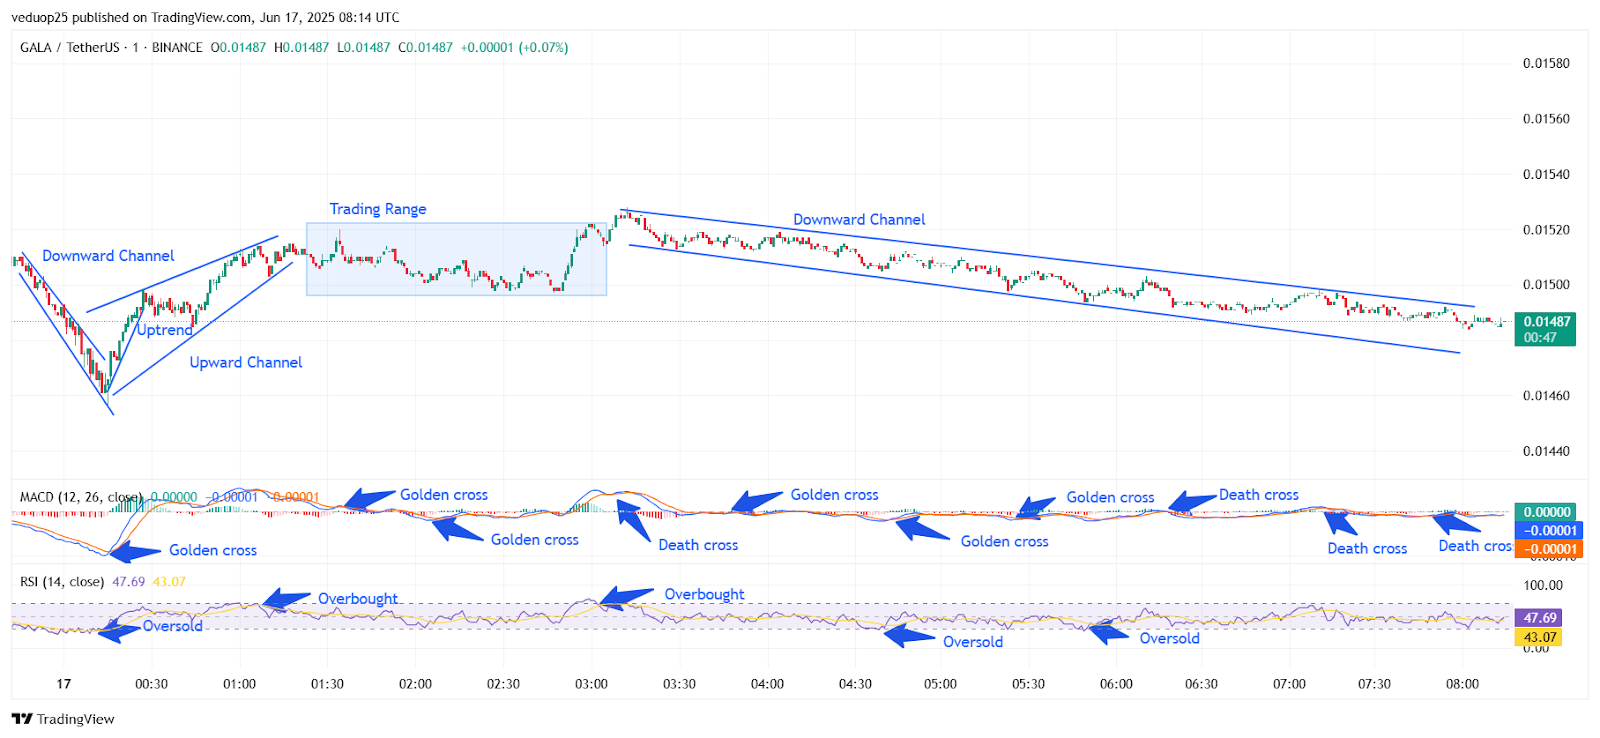
Chart 11- GALA/USDT M1 Chart, Analysed By Anushri Varshney, Published on TradingView, June 17, 2025
Between 01:30 and 03:00 UTC, the GALA coin shifted into a sideways trading range between $0.01520 and $0.01550. The RSI remained slightly elevated, touching overbought levels twice during this time, while the MACD printed multiple golden crosses, signaling active buying interest. But despite holding this range for over 90 minutes, the GALA breakout above $0.01550 never came.
GALA Price Slips Below $0.01500 as Downward Channel Extends
By 03:15 UTC, the bulls began to lose control. A slight pullback turned into a complete trend reversal, and the GALA price entered a new downward channel. From 03:30 UTC onward, GALA started making lower highs and lower lows. Even though a brief golden cross on the MACD around 04:00 UTC gave some hope, it was followed by a death cross, confirming a bearish shift.
From 05:00 to 07:30 UTC, the RSI fell back into the 35–45 zone, flashing oversold conditions multiple times. The MACD also showed multiple death crosses, and GALA traded steadily lower within the channel. The price dipped back to nearly $0.01460 and showed no real signs of breaking the pattern. By the end of the session at 08:00 UTC, GALA was trading at $0.01487, sitting close to the lower boundary of its falling channel. Momentum indicators stayed weak, with RSI near 47 and MACD still trending in neutral momentum.
GALA Coin Faces Pressure Below Key Resistance as Breakout Stalls
The GALA coin closed the session weaker after failing to sustain momentum above the $0.01520 level. MACD shifting into a bearish mode could be reworded more precisely as MACD flipping to bearish with repeated death crosses. The lack of a clear GALA breakout above the $0.01550 resistance kept buyers cautious, and repeated death crosses confirmed that selling pressure remained intact.
The GALA price must break and hold above the $0.01520–$0.01550 zone with strong volume. Until then, bears are likely to stay in control, especially with momentum indicators still not showing any real strength. As long as the GALA coin remains inside this falling pattern, traders should stay alert for volatility spikes and only look for bullish setups once a confirmed breakout takes place beyond the current resistance band.


