If you are considering whether to invest in Google stock or are searching for the optimal Google price to enter, you are in the right place. This analysis will study the price trends followed by supportive resistance patterns and death cross and golden cross technical reactions in the stock. The chart shows essential price areas and identifies when the stock attempts to break out from its previous prices to display market trends exactly. We will examine Google price movements to find trading opportunities that establish meaningful market decisions.
Google Price Analysis For May 3, 2025
Google stock has experienced tight consolidation in the past several hours. The opening value reached $164 before the price reached $165 as a resistance level. Google’s price encountered multiple attempts to surpass its resistance level at $165 but completely failed to breach it. The current market prices have brought the stock back to $164 indicating investors remain unsure about the direction of the share value. A golden cross on the MACD drove Google’s price temporarily higher before it reached its resistance point.
A death cross interrupted the rally because it emerged in the market which resulted in a fast price decrease. The RSI pointed toward a seller victory because it crossed into the overbought area several times. A minor price downward trend occurred after each signal of overbought conditions kept the price stationary below $165.

Chart 1-Google/USDT M5 Chart, Analysed By Anushri Varshney, Published on TradingView, May 3, 2025
The second golden cross appeared after the initial trading phase but failed in its breakout attempt against Google. The resistance area received support from sellers which caused the price to drop toward its support area at $162. Both bullish and bearish trading forces lost their dominance according to the RSI readings which reached the neutral area. The MACD produced unstable signals while the market remained unchanged because no consistent directional pattern formed. A google breakout requires the price to close at $165 with robust trading volume. Between $162 and $165 the stock will probably stay within this price range until further developments occur. New position entries should wait for verified breakouts or breakdowns on the chart.
Google’s Stalled Breakout: Traders Eye $165 Resistance
The price action of google hovered between $162 support and $165 resistance levels today. The Google stock chart indicates a golden cross on the MACD, resulting in a brief upside movement followed by a swift reversal of gains with a subsequent death cross. The RSI had various overbought readings, indicating acute selling near resistance. Multiple attempts at Google breakouts could not sustain interest above $165. The session ended near $164, with indecisive momentum indicators. A proper breakout will require traders to look for a strong closing above resistance with high volume.
The Waiting Game: Google Price Stuck Between Key Levels
Google’s price continues to face heavy resistance near the $165 mark, with momentum showing clear signs of exhaustion. The inability of buyers to overcome resistance around $165 indicates they have lost their market control. The golden cross signals from the MACD become less persuasive due to their poor follow-up performance. Market contraction in zones where RSI measures excessive buying activity verifies the deceleration of price momentum. The stock needs to break out above $165 sustainably before the breakout becomes valid. A fall in price below $162 support will potentially produce a strong downward market movement. Current price movements indicate the market could remain stable for this period. Until then, Google stock shall continue trading within a range, favoring short-term trading strategies over trend following.
Google Price Analysis of May 7, 2025
Yesterday, Google opened with selling pressure, dropping to near $160.60 by early afternoon. The RSI confirmed this setup by bouncing from below 30 at around 13:45 UTC, signaling a potential trend reversal from oversold conditions. The price steadily climbed into the $163–$164 range by 15:00 UTC, with momentum favoring buyers. But after that point, candlesticks lost strength. From 15:00 to 16:00 UTC, the stock moved sideways under $164.50. Each attempt to rise higher stalled near the broader resistance zone marked at $165.
At 16:30 UTC, the MACD printed a death cross, signaling momentum had flipped back to the bears. This was followed by tight consolidation and flat movement. Volume stayed weak, suggesting a lack of conviction in the uptrend, and Google’s price couldn’t break above the $164.75 resistance level, building the struggle at higher levels. RSI hovered around neutral, reflecting no significant changes. From 17:00 to 18:00 UTC, bears began to slowly push the price lower.

Chart 2- Google/USDT M5 Chart, Analysed By Anushri Varshney, Published on TradingView, May 7, 2025
On the next day, the last candlesticks before the current session showed a clean drop below $164.00. At 11:22 UTC, the price stood at $163.25, marking a slow but steady fade from intraday highs. The RSI fell to 51, and the MACD turned red again, supporting the bearish shift. Google support holds around $160.50, while resistance is firm at $165. Unless bulls break through that ceiling, rallies may continue to get rejected. The failure to reclaim the $164 level signals weakening bullish sentiment, and unless a breakout above $165 occurs soon, any further rallies are likely to be short-lived. Current indicators show weakening, not full reversal. But if price loses the $163 level, sellers could drive the next move toward support.
Google Stock Dips Below $164 as Momentum Weakens
Today, Google stock opened under pressure and slipped to $163.25 by 11:22 UTC, retreating from earlier highs near $164.75. The RSI dipped to 51, signaling a loss of bullish strength, while the MACD flipped bearish with a fresh red crossover. Price faced consistent rejection near the $165 resistance, and lower highs have started to form. Google support remains firm at $160.50, but momentum favors sellers in the short term. Unless bulls reclaim $164 quickly, the Google price may continue to drift lower toward key support in the next trading session. Without a clear bullish reversal, the risk of further downside remains elevated, particularly if the $164 resistance continues to prevent price movement upward, confirming ongoing selling pressure.
Google Price at Risk Without Clear Breakout Signal
Google stock is showing early signs of weakness after failing to break above the $165 resistance. The price action has been gradually shifting lower, with momentum indicators turning bearish. The RSI has dropped from stronger levels, and the MACD is now flashing red again. These signals suggest that bullish strength is fading, at least in the short term. However, Google support around $160.50 is still holding, and that remains a key level to watch. If the price stays above this zone, a rebound is still possible. But if $163 fails to hold, sellers may push toward a retest of that support level. A drop below $163 could trigger further selling pressure, possibly toward the $160.50 support region.
For now, the Google price remains stuck between strong resistance and solid support. So until then, traders should wait for confirmation, before getting involved in new long positions in Google shares. The next few trading sessions should be key for figuring out whether Google shares break resistance or there is more support for a potential rebound.
GOOGLE Price Analysis For May 14, 2025
The Google stock price analysis over the last 24 hours shows a sharp rebound from support, followed by sideways movement under key resistance. Yesterday, the Google price started under pressure in the early session, dropping toward the lower support region near $155.90. Around 13:30 UTC, the price showed signs of exhaustion from selling, briefly touching the support line. By 14:00 UTC, bulls charged in, reversing momentum in their favor as the Google price surged off from the support level. This bounce from the Google support level, further confirmed by the RSI, which moved out of the oversold zone, shows a clear sign of trend reversal. Simultaneously, a golden cross appeared on the MACD, strengthening the bullish move.
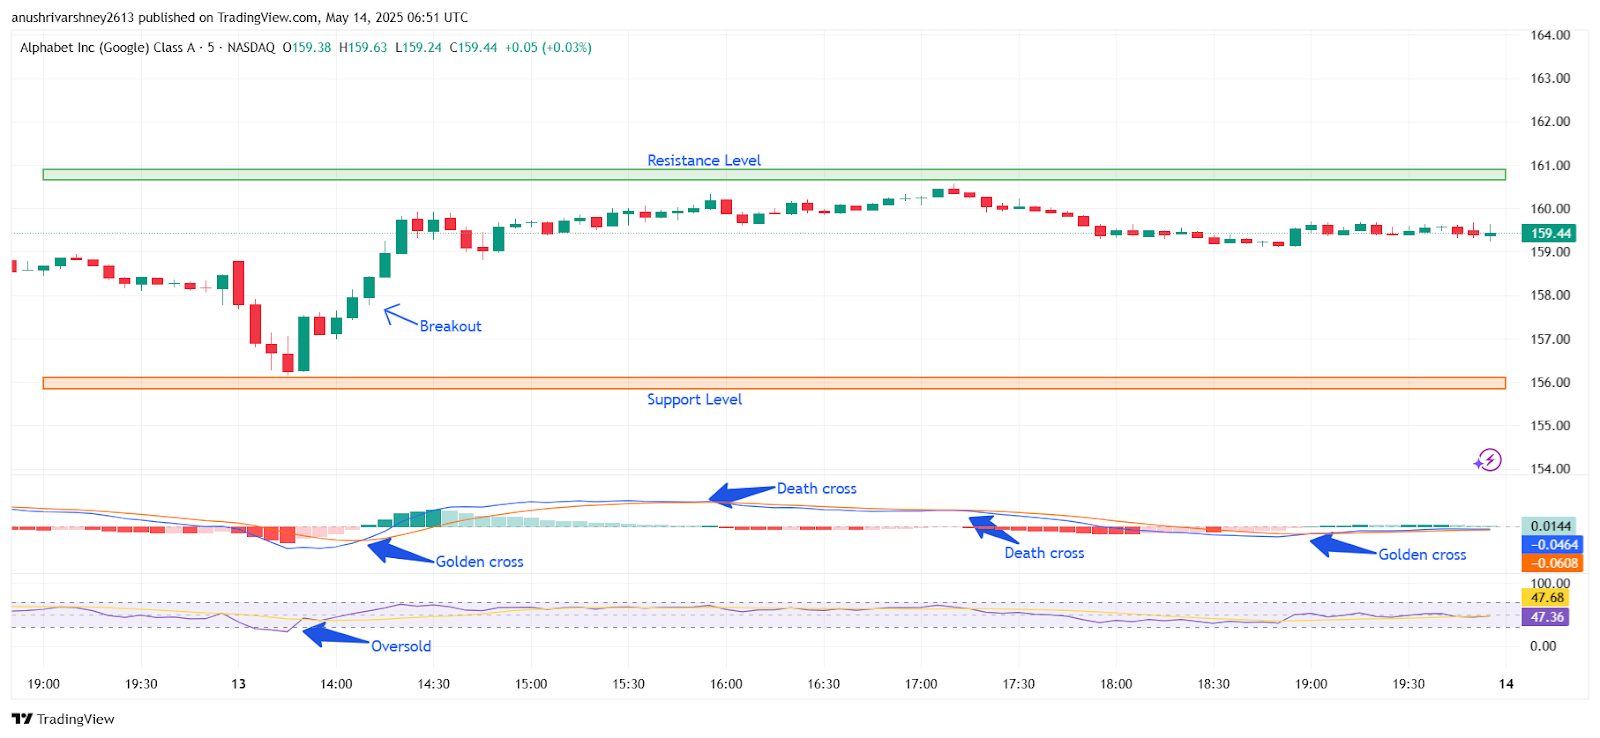
Chart 3- GOOGLE/USDT M5 Chart, Analysed By Anushri Varshney, Published on TradingView, May 14, 2025
As the upward move gathered pace, momentum picked up quickly, sending Google stock above $158.00 by 15:00 UTC. Buying pressure remained consistent through the afternoon, with candles forming higher highs and lows. The bullish run peaked near the $160.80–$161.00 resistance level, but the breakout attempt stalled as sellers defended this zone. By 16:00 UTC, the bulls began to lose steam as momentum slowed. The MACD printed a death cross, hinting that momentum was cooling off. From this point forward, Google stock traded sideways, unable to push above the resistance. Another death cross followed closer to 17:30 UTC, reinforcing the idea of fading bullish strength.
Google Stock in Wait-and-See Mode
Despite the lack of upward continuation, the price didn’t fall sharply either. The Google stock price coiled tightly between $159.40 and $159.60, showing slow growth below resistance. Support held above $159.00, indicating that buyers were still present, but cautious. In the final hours of the trading session, around 19:30 UTC, a small golden cross formed again on the MACD, suggesting that bullish interest could return if volume picks up. RSI showed 47, indicating an indecisive market. Key levels to watch going forward will be resistance of $161.00 that needs to break for upside continuation, and support of $155.90 is still strong and legitimate. Until those levels get established, Google’s price is likely to continue to consolidate, waiting for its next move.
Google Stock Holds Steady Below $161.00 After Rebound From $155.90 Support
The Google price action over the last 24 hours shows a market in transition. After rebounding strongly from the $155.90 support zone, buyers drove prices higher, but resistance near $161.00 capped the move. This leaves Google trading in a tight range, with neither bulls nor bears in full control. The technical indicators suggest a pause in momentum, with the RSI sitting at neutral and the MACD showing mixed signals. If Google clears $161.00 with volume, the next leg higher could unfold quickly. But until then, traders should stay cautious and reactive, not predictive. Traders should keep an eye on volume and MACD crossovers for early indications about direction. With broader market sentiment also in play, Google support may continue to consolidate before making its next decisive move. Patience and clear level-watching remain key for navigating what comes next.
GOOGLE Price Analysis For May 16, 2025
The Google price analysis over the last 24 hours shows a sharp breakout early in the session, followed by a steady pullback and a late recovery from key support. Yesterday’s session opened smoothly, with Google stocks hovering near $163.50 early morning. Around 14:45 UTC, bulls stepped in, pushing the price gradually upward. The move gathered momentum and by 15:15 UTC, a clear breakout was seen as the price surged past short-term consolidation. The price touched a local high near $165.70 but couldn’t break the key Google resistance level at $166.50.
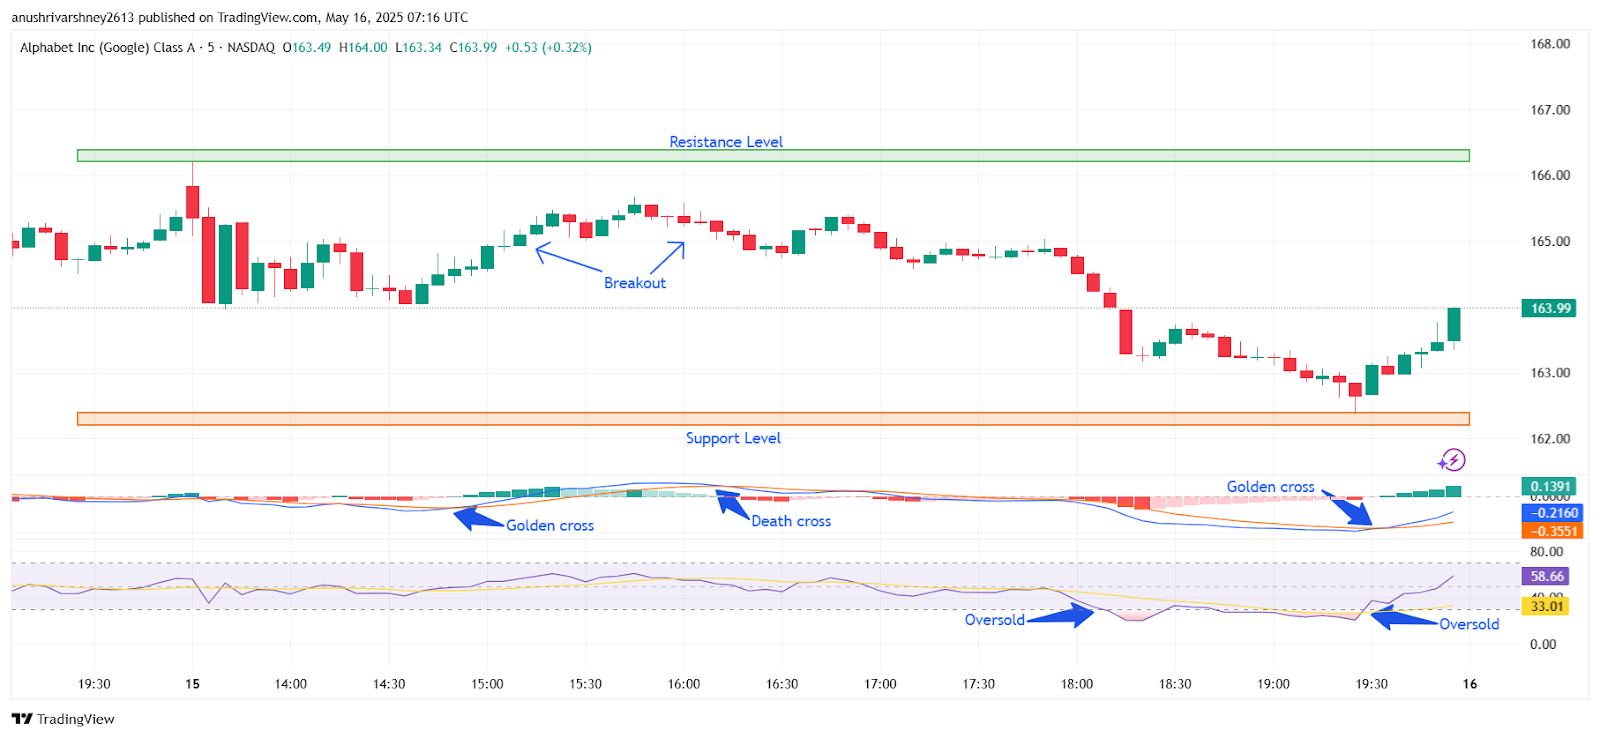
Chart 4- GOOGLE/USDT M5 Chart, Analysed By Anushri Varshney, Published on TradingView, May 16, 2025
From 15:30 to 16:30 UTC, candles began to turn bearish, and a shift in momentum was noticed. The MACD started to weaken, and around 16:45 UTC, a death cross formed, confirming a bearish reversal. Sellers took control, and Google’s price declined over the next two hours from 17:00 to 18:30 UTC. The RSI slipped steadily and hit oversold territory near 30 just before 18:45 UTC. At this point, Google stocks reached its support zone at $162.50. Google price tested this level but didn’t break below, showing strong buyer interest at the support.
Google Price Rebounds Above $163.00 After Holding $162.50 Support
From 19:00 UTC onward, the momentum started to shift again. A second MACD golden cross appeared around 19:15 UTC, while RSI began to climb from the oversold level. This marked the beginning of a slow but steady recovery. Google price moved back above $163.00 as buying pressure increased. By 20:00 UTC, the bounce gained more strength. Buyers pushed the stock toward $163.80 with steady green candles and low volatility, keeping the uptrend stable into the final hours. At 21:30 UTC, another price surge came in, and by the session, Google’s price was trading at $163.99, posting a +0.32% gain on the day.
The support at $162.50 held firmly, preventing a deeper decline. Meanwhile, the $166.50 resistance stayed untouched, highlighting the current range. In summary, yesterday’s price action showed how the market responded to technical triggers and key support zones. The early breakout failed to clear major resistance, but the bounce from oversold levels and the second MACD golden cross point to renewed momentum. If Google’s price stays above $163.00 today, the focus could retest the $166.50 resistance.
Google Stock Eyes Recovery After Holding Strong Support
In conclusion, the recent stock movement shows resilience as it holds firmly above the $162.50 support level. Despite early selling pressure and a failed attempt to break above $166.50 resistance, the price found strength at the end of the session, supported by a golden cross and a bounce from oversold RSI levels. This rebound signals a potential shift in short-term momentum. Google stocks could make another attempt at $166.50 if momentum stays strong. However, any slip below the key support zone may invite renewed selling pressure. As long as buyers stay active while MACD stays positive and RSI remains above 50, GOOGLE support could be setting up for a steady recovery toward higher levels in the short to medium term.
Google Price Analysis For May 21, 2025
The Google price analysis over the last 24 hours shows a strong upward push inside a rising channel, followed by a sharp breakdown and quick shift into a downtrend. Price opened the day around $163.50 and moved sideways during early trading. Between 08:00 and 13:00 UTC, the price held steady with low volume as buyers slowly began to take control. Around 13:30 UTC, the Google stock started climbing inside an upward channel, showing signs of strength. Momentum increased through the afternoon, with bulls pushing the price from $164 to $168.80 by 16:45 UTC. Just before 17:00 UTC, a Google price breakout occurred above the upper boundary of the channel. The breakout initially gained attention, but buyers couldn’t maintain momentum. As sellers stepped in, the price stalled at resistance.
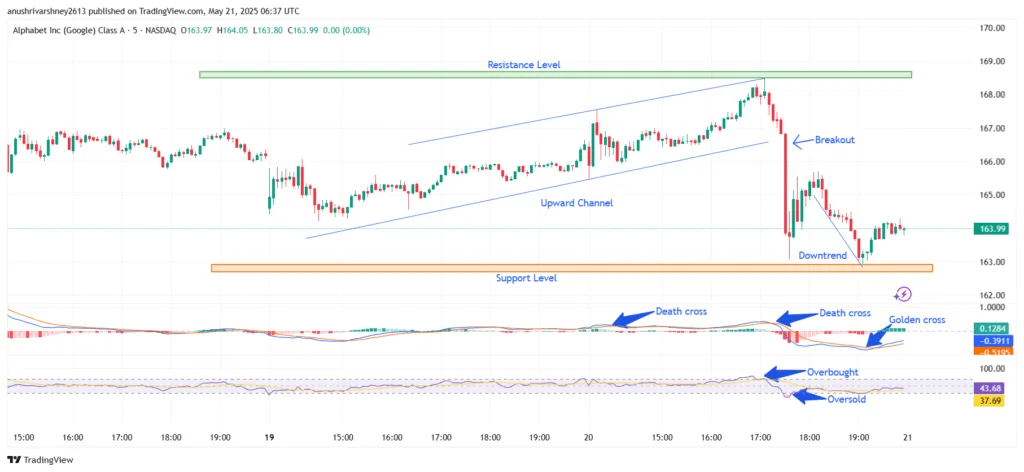
Chart 5- GOOGLE/USDT M5 Chart, Analysed By Anushri Varshney, Published on TradingView, May 21, 2025
By 17:20 UTC, a strong red candle took the price from $168.80 to $165.50. A few minutes later, it dropped even further to $163.10. The MACD printed a death cross around 17:10 UTC, confirming the bearish shift. At the same time, the RSI dropped into the oversold zone below 30, signaling panic selling and exhaustion. The downtrend continued for the next hour as the price touched the marked support level near $163. The Google stock finally found some buying interest between 18:00 and 19:00 UTC. Bulls started slowing the decline, and small green candles appeared as the market tried to stabilize.
Weak Bounce Holds $163–$164 Range into Close Range
Around 19:30 UTC, the MACD showed a golden cross. This shift hinted that bearish momentum was fading. The RSI also climbed out of oversold territory, crossing above 35 and signaling that a short-term bottom might be forming. Despite the weakness, the Google price managed to hold above the $163 zone into the close. From 20:00 UTC to 23:59 UTC, the price stayed between $163.20 and $164.20 with no major moves. The recovery was cautious, and volume remained light. The final close came in at $163.99, slightly above the day’s low but well below the breakout high.
Support Holds as Indicators Shift, What’s Next for Google Stock?
Google managed to defend its support zone at nearly $163 after a sharp intraday reversal from the $169 resistance. Google price broke out of the upward channel earlier, triggering a fast drop confirmed by a MACD death cross and RSI oversold reading. This panic move found buyers around the support zone, where the price began to stabilize. By late session, the MACD formed a golden cross, and the RSI climbed above 35, signaling a shift in short-term momentum. However, the recovery remained weak, with low volume and limited follow-through. The Google price must reclaim the $166–$167 area for any meaningful upside. Until then, the price may continue to consolidate near support. Traders should watch for a clean break above $167 for bullish confirmation, or a drop below $163 for renewed weakness. The indicators show signs of recovery, but the trend remains cautious heading into the next session.
Google Price Analysis For June 12, 2025
The Google price analysis over the last 24 hours shows clear selling pressure inside a broad downward channel. The session started with a sharp drop around 13:00 UTC, as Google stock fell from $179.80 into a tight downward slope. RSI moved near oversold, and MACD gave an early golden cross, but the price kept sliding. By 13:30 UTC, buyers stepped in. A small uptrend formed between 13:30 and 14:00 UTC, lifting the Google price to $178.80.
Price rejected from resistance and moved sideways till 15:00 UTC. MACD printed back-to-back golden crosses, but the stock failed to break the upper channel. From 15:00 to 15:45 UTC, the trend shifted into a clean downtrend. MACD turned bearish with a death cross near 15:50, and RSI fell below 30, entering oversold territory. Google stock then bounced from support near $177.00. A golden cross and RSI reversal led to a minor Google breakout at 16:30 UTC. Price quickly spiked to $178.20 but failed to hold gains.
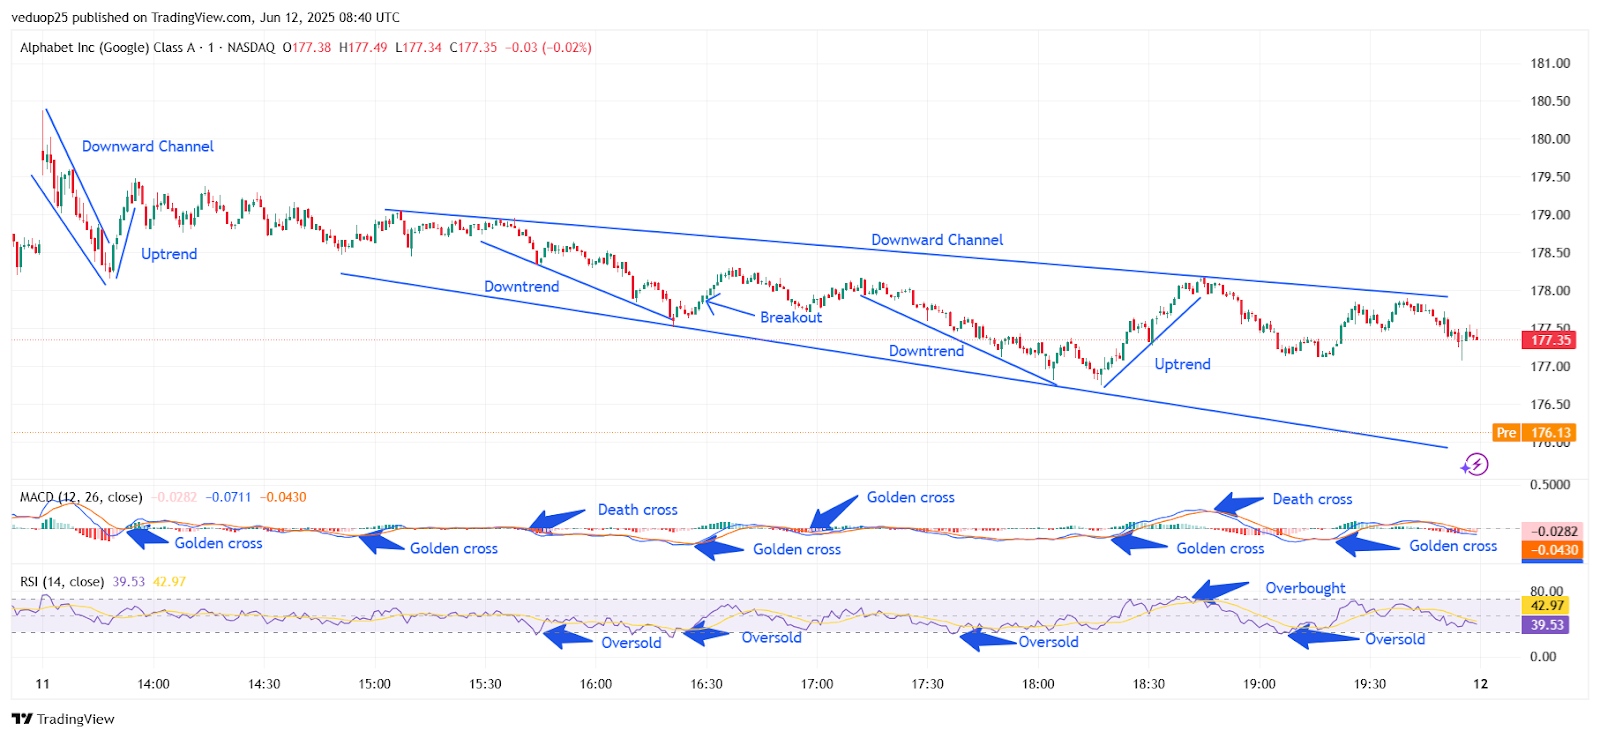
Chart 6- GOOGLE/USDT M1 Chart, Analysed By Anushri Varshney, Published on TradingView, June 12, 2025
Between 17:00 and 18:00 UTC, the stock resumed its downward move. A fresh downward channel formed. RSI hit oversold again by 17:30 UTC. Although a golden cross formed on the MACD, price action stayed weak. At 18:15 UTC, Google’s price began to recover from the lower boundary of the channel.
Failed Breakouts Keep Google Stock Trapped Below Resistance
From 18:15 to 18:45 UTC, the price jumped from $176.60 to $178.20. RSI entered the overbought zone, and MACD showed strong bullish momentum. However, sellers returned nearly $178.20. The chart showed another MACD death cross at 19:05 UTC, confirming a fresh wave of selling. The final trading hour saw one last attempt to regain strength. A golden cross formed again on the MACD at 19:30 UTC.
Price bounced from $177.00 to $177.60 but couldn’t break the upper channel. Google stock then moved sideways into the close. By the end of the session, the Google price settled at $177.35, just below intraday resistance. RSI hovered near 43, showing weak buying. MACD stayed flat, signaling no clear trend into the next session.
Google Stock Holds Support but Struggles to Escape Channel
The Google stock closed the session near $177.35 after moving inside a falling channel for most of the day. Although two Google breakout attempts were seen—once at 16:30 UTC and another around 18:30 UTC—both failed to break the upper resistance line near $178.50. RSI showed multiple oversold signals through the day, especially during sharp dips around 15:45, 17:25, and 18:00 UTC. MACD printed several golden crosses, hinting at short-term recoveries, but each attempt lost strength near the channel top.
The strongest uptrend came between 18:15 and 18:45 UTC, but the momentum faded quickly. As of now, RSI holds near 43 and MACD remains flat, reflecting indecision. The broader trend stays bearish as long as the Google price trades below the falling resistance line. A sustained move above $178.50 is still needed to confirm a reversal. Until then, the pressure on lower support levels may continue into the next session.
Google Price Analysis For June 24, 2025
The Google price analysis shows a clean sequence of channel formations, clear signals on RSI and MACD, and a late recovery after a sharp midday fall. The session opened with Google stock showing bearish momentum, slipping below $161 by 13:00 UTC. However, buyers stepped in quickly, pushing the price into a steady upward channel by 13:30 UTC. From there, the Google price began rising gradually, building bullish momentum through higher lows and consistent volume.
At 14:00 UTC, the chart confirmed a Google breakout above resistance, taking the price from $162.40 to $165.80 in just over an hour. During this rise, RSI moved from oversold to above 70, marking the asset as overbought, while a golden cross formed on the MACD near 14:15 UTC, supporting the strength of the uptrend.
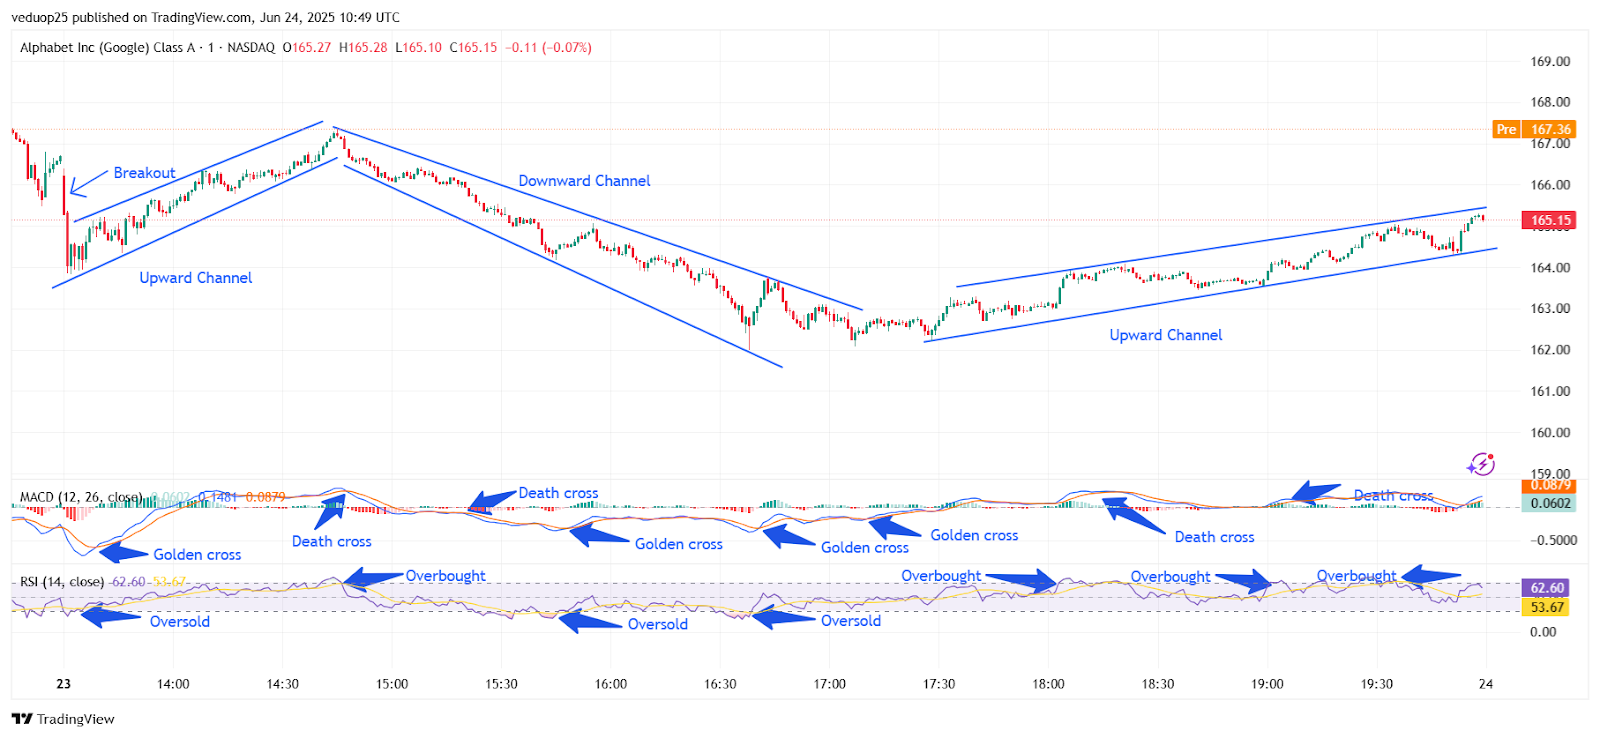
Chart 7- GOOGLE/USDT M1 Chart, Analysed By Anushri Varshney, Published on TradingView, June 24, 2025
But after 15:15 UTC, the momentum began to fade. A death cross on MACD showed the start of a new correction, and by 15:30 UTC, Google stock slipped into a downward channel. RSI dropped sharply below 40 and reached oversold levels by 16:15 UTC. The downtrend continued through lower highs and weaker bullish volume, pulling the price down to $161.50 by 16:45 UTC.
Google Price Recovers in Upward Channel, Closes Strong Near $165
Between 17:00 and 17:15 UTC, the price found a base and formed a new upward channel. A golden cross on the MACD around 17:20 UTC confirmed the reversal. The Google price started recovering, gaining pace slowly as RSI moved back above 50. By 18:00 UTC, the price touched $164.50, breaking through minor resistance.
From 18:15 UTC onward, Google stock stayed within this rising structure. RSI again moved into the overbought zone between 18:30 and 19:30 UTC. Several golden crosses on MACD followed, though one final death cross near 19:45 UTC signaled possible exhaustion. Still, the price held firmly around $165 through the final hour. As the session closed, the Google price stayed just below $165.20, right near the top of the upward channel, suggesting that buyers maintained strength after the earlier sell-off.
Google Price Holds Gains After Breakout and Recovery Rally
The Google price showed strong volatility across the last 24 hours, driven by sharp reversals, channel shifts, and momentum indicators. The day began with a dip, but the price quickly formed an upward channel, leading to a clear Google breakout above $165. After hitting overbought levels, Google stock entered a downward phase marked by falling RSI and a MACD death cross. However, the recovery was swift as buyers stepped in again around $161.50, forming another upward channel. MACD golden crosses and rising RSI values backed the recovery, helping the Google price regain lost ground.
By session close, the price held near $165.15, showing strength despite the earlier drop. RSI stayed elevated, suggesting strong buying interest, while MACD remained near neutral. If momentum continues, a move above $166 could trigger another Google breakout. But if the price slips below $164, short-term weakness may return. Bulls must protect key levels to sustain the current trend.