

Are you closely following the price movements of GRT (Graph Token) and wondering when the best time to buy might be? Well, you’ve come to the right place. The latest Graph Token market trends require inspection through analysis of recent price data to determine short-term investment prospects. GRT has displayed bullish potential while enduring difficult times because an ascending downward pattern maintains its price within set boundaries. Over the day GRT experienced numerous points of support at $0.09000 but its price encountered powerful resistance close to $0.09800. Analyze the market signals with caution due to inconsistent MACD and RSI indicators along with the need to monitor current market changes.
GRT Price Analysis For May 4, 2025
GRT started the day in a descending trend within a properly bounded price boundary. The price dynamic channel functioned as an active resistance force while supporting prices during the trading day which prevented GRT from establishing sustained directional movements. Price reached its minimum for the day at the $0.09000 support level multiple times thus providing recurring purchasing opportunities.
Multiple price droplets encountered sustained support at the $0.09000 mark so it turned into a strong level. A resistance zone that extends from $0.09800 hinders GRT price advances from the upper side. The price maintained an upward and downward motion that established its downward channel while creating the present trend. When GRT breaks through this formation it might indicate its upcoming main directional shift. During the day MACD created essential trading signals which appeared at various times. The bullish momentum indicated by the first golden cross at 02:45 UTC lasted for a short period before the price reversed course downward. The benchmark continued showing declining momentum with two death crosses that emerged at 07:45 UTC and 09:30 UTC.

Chart 1- GRT/USDT M5 Chart, Analysed By Anushri Varshney, Published on TradingView, May 4, 2025
Three golden crosses formed during UTC around 17:50 UTC then at 23:55 UTC and then one more at 11:00 UTC which indicated possible reversal points. The market demonstrated positive signs with bullish crossover events although each price rally encountered sellers who prevented an upward breakout. The bearish death crosses retained overall control which forced every bullish rally to return to the trading channel. RSI asserted important information about market fatigue. RSI entered into oversold levels on numerous occasions from 03:15 UTC to 16:40 UTC to 01:30 UTC to 06:00 UTC demonstrating the bearish market dominance. Markets aimed at short-term support levels at 30 but investors failed to sustain the buying pressure after every decline below this threshold. RSI briefly reached its overbought level at 20:45 UTC and experienced an immediate turn which showed an unsuccessful breakout attempt.
GRT Breakout Watch: Support and Channel Structure in Focus
The GRT cryptocurrency maintains its position within the downward channel at its bottom borderline slightly above $0.09000 support. This convergence area has shown sustained resistance multiple times which resulted in creating a robust base. The channel’s upper border maintains its position as an obstacle to price increases.
Graph Token will likely move toward the $0.09800 resistance zone after crossing its downward channel when supported by the golden MACD crossover and RSI transitioning from neutral to bullish territory. Short-term bullish intentions will be invalidated if the price falls beneath $0.09000 and continues declining.
GRT’s Critical Inflection Point — Will the Channel Break?
The Graph Token’s price behavior reflects a market caught between short-lived bullish signals and persistent bearish control. The downward channel has consistently defined trend resistance and repeated MACD and RSI signals show a lack of follow-through. The $0.09000 support level remains the last defense for bulls. A confirmed GRT breakout from this structure, ideally with strong volume and MACD-RSI, alignment would bring directional clarity. Until then, traders should watch the channel and support-resistance zones closely, as any breach could bring sharp movement either way.
The Graph (GRT) Price Analysis For May 13, 2025
The GRT Price action in the last 24 hours revealed a strong bounce off support, two major breakouts, and a volatile pullback structure shaped by momentum shifts. The Graph Token (GRT) opened the day near $0.1140, holding a tight range before initiating a decisive breakout from the base structure at around 06:00 UTC.
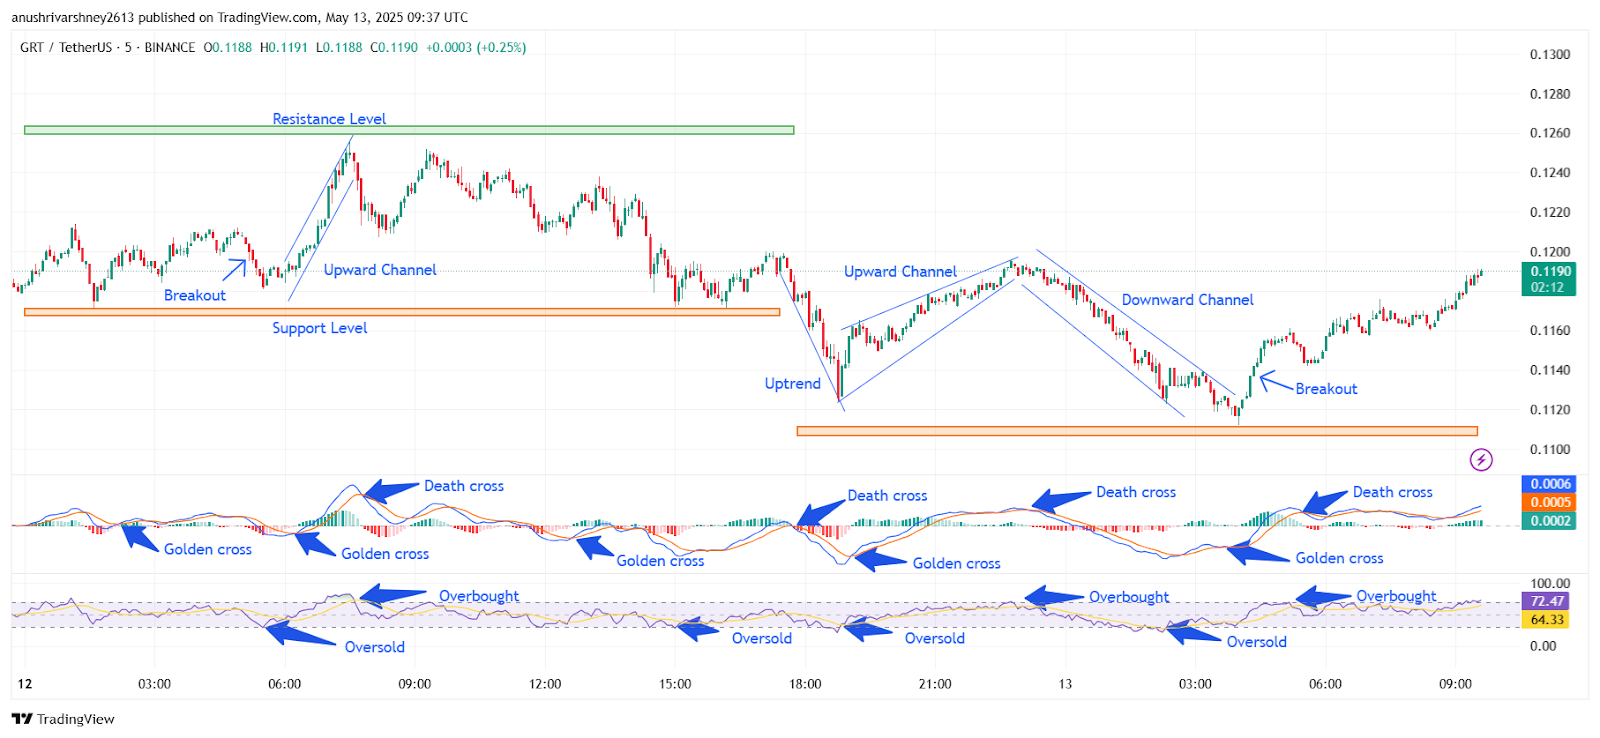
Chart 2- GRT/USDT M5 Chart, Analysed By Anushri Varshney, Published on TradingView, May 13, 2025
This GRT breakout pushed the price into an upward channel, quickly driving momentum past $0.1170 and eventually peaking near $0.1250 by 08:30 UTC. During this climb, RSI surged above 70, signaling an overbought condition. The momentum began to fade shortly after as GRT faced rejection from the $0.1250 resistance zone. By 09:30 UTC, a death cross appeared on the MACD, marking the start of a slow pullback. Price action gradually shifted downward and exited the channel, falling below $0.1200 around 11:00 UTC.
GRT Price Dips to $0.1115
At 15:00 UTC, another golden cross emerged on the MACD, but the follow-through was weak. The Graph Token dropped below support at 17:00 UTC, hitting an intraday low near $0.1115 by 18:30 UTC. A golden cross formed on the MACD around 19:00 UTC, and the RSI reached oversold territory, signaling a possible bottom. The GRT price responded with a short rally, forming a steep uptrend into $0.1170 by 20:30 UTC.
From there, GRT entered another upward channel, but this time with less strength. The move topped out at $0.1195 by 22:00 UTC, sliding into a downward channel and dipping again below $0.1140 at 02:00 UTC. The final turnaround happened just before 04:00 UTC, when GRT bounced back from support near $0.1110. Another GRT breakout followed, taking the price gradually toward $0.1190 by day’s end.
Graph Token Surges After Breakout, Targets $0.1250 Resistance
The GRT price started today with steady gains after a clean breakout above the downward channel near $0.1120. Bulls took control early in the session, forming a strong upward move that pushed the Graph Token above $0.1190. The MACD showed a golden cross around 06:00 UTC, confirming the shift in momentum. RSI also climbed back into the overbought zone near 72, signaling strong buying interest. Price action stayed stable through minor pullbacks, suggesting bullish consolidation. If momentum holds, a retest of the $0.1250 resistance remains likely. So far, the market remains in favor of buyers with support forming around the $0.1150 area.
Graph Token Bulls in Control, But For How Long?
Looking ahead, the GRT coin shows signs of strength after bouncing from key support and completing several healthy breakouts. The price has respected technical patterns like channels, breakouts, and momentum shifts, all confirmed by RSI and MACD indicators. As long as the GRT price holds above the $0.1150 zone, buyers may continue targeting the $0.1250 resistance. A breakout above that level could open the way toward $0.1300 or higher in the short term. However, if the price fails to maintain this momentum, a dip back toward $0.1110 support is possible. Traders should watch for volume spikes and MACD direction as early signs. Overall, if bulls sustain volume and momentum above $0.1190, GRT could accelerate toward $0.1250–$0.1300. Failing that, a drop below $0.1150 might invalidate the bullish setup.


