

Hedera spent most of the session trapped in a sideways structure, with frequent but failed breakout attempts. After a minor converging triangle broke down, the price dropped sharply, forming a new range before continuing lower. Despite establishing a brief support at $0.1870, Hedera could not maintain stability and was marked at a low of nearly $0.1855. RSI signals consistently entered oversold territory, but reversals were shallow.
MACD also stayed near its base, reflecting weak momentum. Overall, the day was characterized by false breakouts, range-bound trading, and failed attempts to build meaningful support or resistance, keeping Hedera stuck in indecisive market conditions. Let’s examine the Hedera price analysis to see how it reacted to different daily patterns.
Hedera Price Analysis for April 28, 2025
A minor converging triangle appeared in the price of Hedera, which broke out to the downside, supported by a Death Cross of MACD. The HBAR price dropped and formed a minor range, which again broke out to the downside at 04:30 UTC, supported by a Death Cross of MACD. In the meantime, RSI dropped below 30 at 05:25 UTC, suggesting oversold market conditions. Hedera formed a support area at $0.1870 and a resistance area at $0.1905.

Chart 1: Analysed by vallijat007, published on TradingView, April 28, 2025
Hedera dropped below the support area and marked the low for the day at $0.1855, but the Hedera breakout soon failed, and price moved to the upside and formed a converging triangle pattern, which broke out to the downside at 23:25 UTC, supported by a Death Cross of MACD. Most of the time, Hedera moved in a sideways market, with every breakout failing and reversing. The Hedera price also tried to form strong resistance and support areas but failed. RSI and MACD meandered near their base levels for most of the day.
Hedera broke down from the previous day and dropped to $0.1853. In the meantime, RSI dropped below the level of 30. Hedera moved in a V-shape and formed a converging triangle pattern, marking the day’s high at $0.1945. The converging triangle pattern broke out to the downside at 04:50 UTC, supported by a Death Cross of MACD. If the downside Hedera breakout succeeds, then Hedera could drop below the level of $0.1850. But if the breakout fails, then Hedera could cross its previous high of $0.1945, and if the breakout to the upside is strong, Hedera may move to the level of $0.2025.
Key Levels to Watch for Hedera’s Next Move
Hedera is balancing between critical levels, with $0.1850 acting as immediate support and $0.1945 as short-term resistance. If the downside breakout below $0.1850 succeeds, further declines could follow, extending the bearish structure. However, if the breakout fails and the HBAR price reclaims $0.1945, a move toward $0.2025 could unfold. RSI and MACD indicators remain neutral to slightly bearish, suggesting traders should be cautious before committing to either direction. Until a clean breakout backed by volume occurs, Hedera’s price will likely stay trapped within this tightening range, offering limited opportunities for strong directional trades.
Hedera Price Analysis for April 30, 2025
Hedera showed clear range-bound behavior throughout the session, with multiple downside breakouts dominating the structure. After marking a session high around $0.19195, the Hedera price broke lower at 01:50 UTC, followed by another failed spike and continued range formation. RSI entered oversold territory early, confirming weakening momentum. A converging triangle broke down at 08:20 UTC, pushing the price toward $0.18600. Later, an expanding triangle also broke to the downside, forming the session low at $0.18315. Despite multiple breakdowns, some recoveries emerged, but price action largely reflected failed breakouts and limited follow-through within a broad consolidation structure. Let’s take a look at Hedera’s price analysis to see how everything happened.
What Do MACD’s Death Cross and RSI’s Oversold Suggest?
A range appeared in Hedera’s price, which marked the high for the day at $0.19195. The range broke out to the downside at 01:50 UTC, supported by a Death Cross of MACD. Price failed to form a spike; another range again broke out to the downside at 04:40 UTC, supported by a Death Cross of MACD. In the meantime, RSI dropped below 30, indicating oversold market conditions. Price formed a converging triangle, which broke out to the downside at 08:20 UTC, supported by a Death Cross of MACD. The price of Hedera moved down to the level of $0.18600.

Chart 2: Analysed by vallijat007, published on TradingView, April 30, 2025
An expanding triangle pattern appeared in the price of Hedera, which broke out to the downside at 19:40 UTC, supported by a Death Cross of MACD. HBAR price spiked to the downside and marked the low for the day at $0.18315. In the meantime, at 21:15 UTC, RSI dropped below 30, indicating oversold market conditions and suggesting a reversal or at least a pullback in the ongoing downward movement. Hedera mostly moved in a range, with some breakouts failing and some reaching their target levels.
A narrow range appeared in the price, which broke out to the downside at 05:40 UTC, supported by a Death crossover of the MACD. The HBAR price spiked to the downside to the level of $0.18400. If the price breaks its previous low of $0.18300, it might drop to $0.18000, which acts as a psychological support level for Hedera. If the HBAR breakout from the narrow range fails, the price may rise to $0.18800, which currently acts as a resistance area for Hedera.
Hedera Tests Support in Weak Market Structure
Hedera price remains under pressure, currently testing support around $0.18300. A confirmed break below this level could trigger further downside toward the $0.18000 psychological support zone. If, however, the HBAR breakout fails and buyers step in, a recovery toward $0.18800 is likely, where immediate resistance has formed. RSI remains oversold, suggesting a potential bounce, but MACD continues to flash bearish signals. Given the persistent range and failed breakouts, traders should cautiously approach and prioritize short-term targets. Until Hedera breaks out with conviction, sideways movement with a bearish tilt remains the dominant pattern.
Hedera (HBAR) Price Analysis of May 25, 2025
The session opened with a breakdown from an upward-moving channel, leading to a sharp drop that formed a converging triangle and established the day’s low at $0.18481. Despite this bearish start, RSI quickly entered oversold territory, triggering a reversal supported by a golden MACD crossover. What followed was a sequence of tight formations, ranges, triangle patterns, and channels, with alternating HBAR breakouts. Although both bulls and bears pushed the Hedera price with conviction, neither side maintained control for long. The high was eventually marked at $0.19029, but momentum faded again, and the HBAR price retreated into a range by session close.
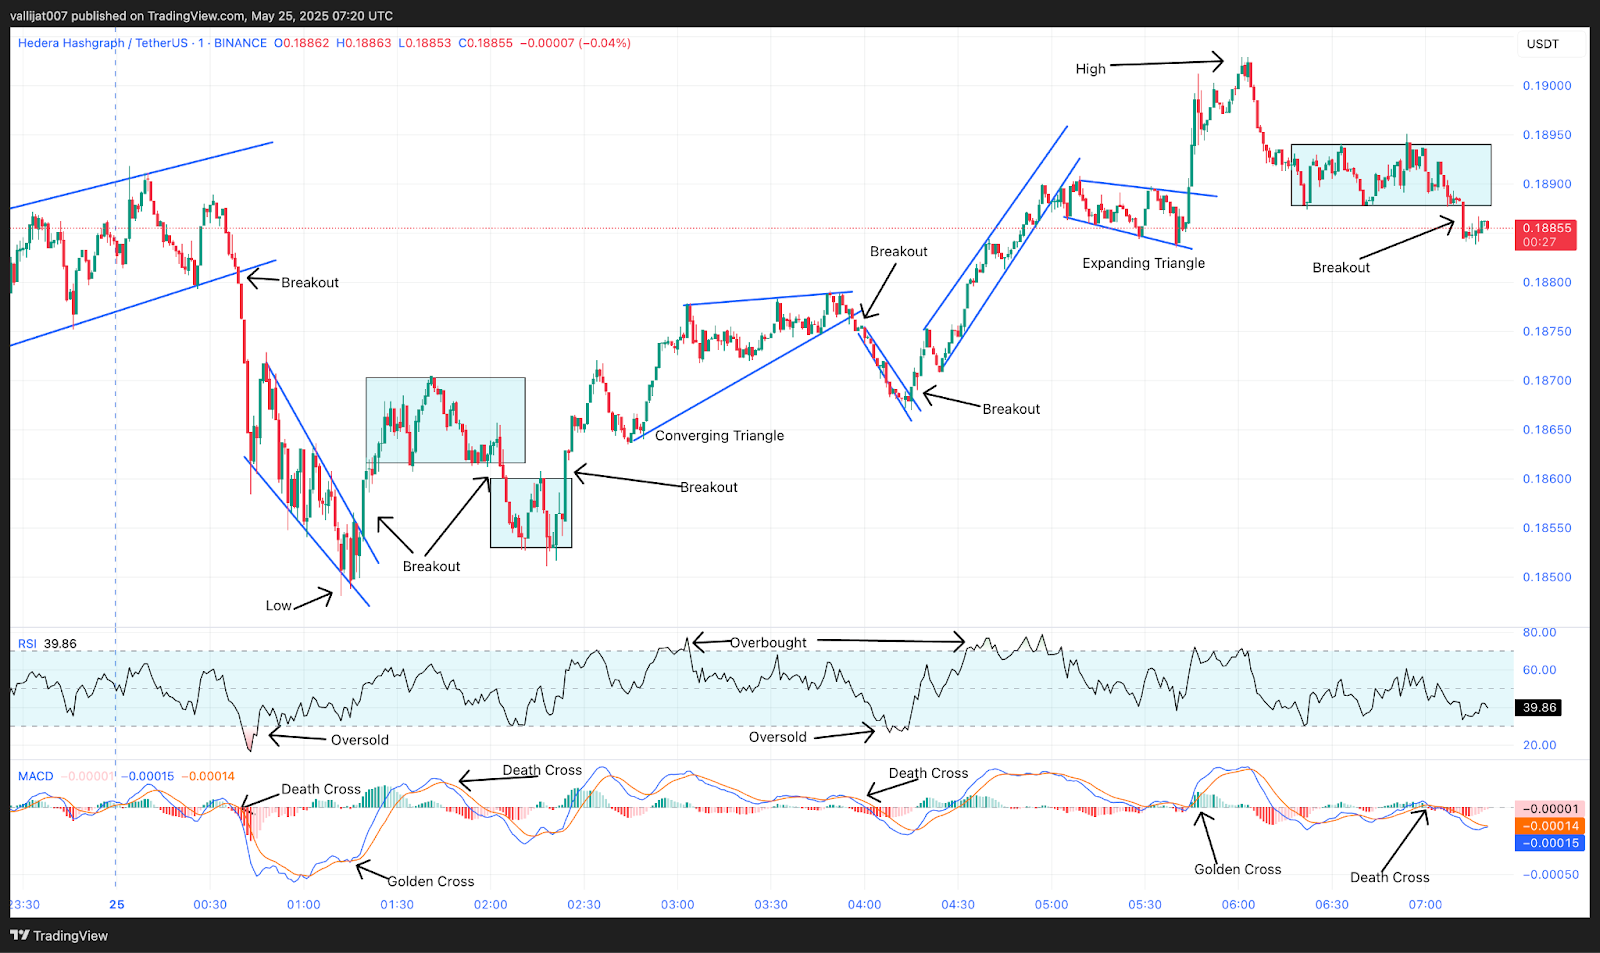
Chart 3: HBAR/USDT M1 Chart, Analysed by vallijat007, published on TradingView, May 25, 2025
An upward-moving channel appeared in the Hedera price, which broke out to the downside at 00:39 UTC, supported by a death crossover of MACD. Price spiked to the downside and formed a converging triangle pattern. In the meantime, at 00:45 UTC, RSI dropped below the level of 30, indicating oversold market conditions, suggesting a reversal or at least a pullback. That converging triangle pattern marked the low for the day at $0.18481. The converging triangle pattern broke out to the upside at 01:19 UTC, supported by a golden crossover of MACD. Price spiked to the upside and formed a range.
Expanding Triangle Breakout Tests Resistance
The range broke out to the downside at 02:03 UTC, supported by a death crossover of MACD. Hedera price moved to the downside and formed another range. The second range broke out to the upside at 02:24 UTC, supported by a golden crossover of MACD. Price spiked to the upside and formed a converging triangle pattern. In the meantime, at 03:05 UTC, RSI moved above the level of 70, indicating overbought market conditions, suggesting a reversal or at least a pullback.
The converging triangle pattern broke out to the downside at 03:56 UTC, supported by a death crossover of MACD. Hedera price spiked to the downside and formed a downward-moving channel. The downward-moving channel broke out to the upside at 04:15 UTC, supported by a golden crossover of MACD. Price spiked to the upside and formed an upward-moving channel. The upward-moving channel broke out to the downside at 05:03 UTC, supported by a death crossover of MACD. Price spiked to the downside and formed an expanding triangle pattern.
The expanding triangle pattern broke out to the upside at 05:44 UTC, supported by a golden crossover of MACD. Hedera price spiked to the upside and marked the high for the day at $0.19029. After reaching the high, the price dropped to the downside and formed a range. The range broke out to the downside at 07:12 UTC, supported by a death crossover of MACD. If the HBAR breakout succeeds, then the price may drop to the level of $0.18500. If the breakout fails, then the price may rise to the level of $0.19100.
Price Stalls Between Breakouts, Direction Hinges on Follow-Through
After a session defined by volatility and back-and-forth breakouts, the Hedera price now sits at a technical decision point. The most recent downside breakout from the range, supported by a MACD death crossover, suggests renewed selling pressure. However, given the day’s frequent reversals and failed follow-throughs, a quick recovery remains possible. If bears maintain control, the HBAR price could fall toward $0.18500. On the other hand, a failed breakdown may lift the price toward the $0.19100 level. Traders should wait for confirmation and volume before acting, as the current setup favours reactive, short-term strategies over committed trend trading.
Hedera (HBAR) Price Analysis of May 31, 2025
The Hedera token opened the day trading within an upward-moving channel, briefly pushing to a session high before momentum faded. A sequence of bearish MACD signals triggered a breakdown from the channel, and the price quickly transitioned into a downward structure. Selling pressure increased until conditions became oversold, as flagged by the RSI dropping below a key level. A brief recovery followed, but attempts to reclaim bullish momentum were short-lived. The Hedera price cycled through a series of minor ranges and triangle formations, repeatedly failing to sustain either upward or downward breakouts, highlighting growing indecision in the market.
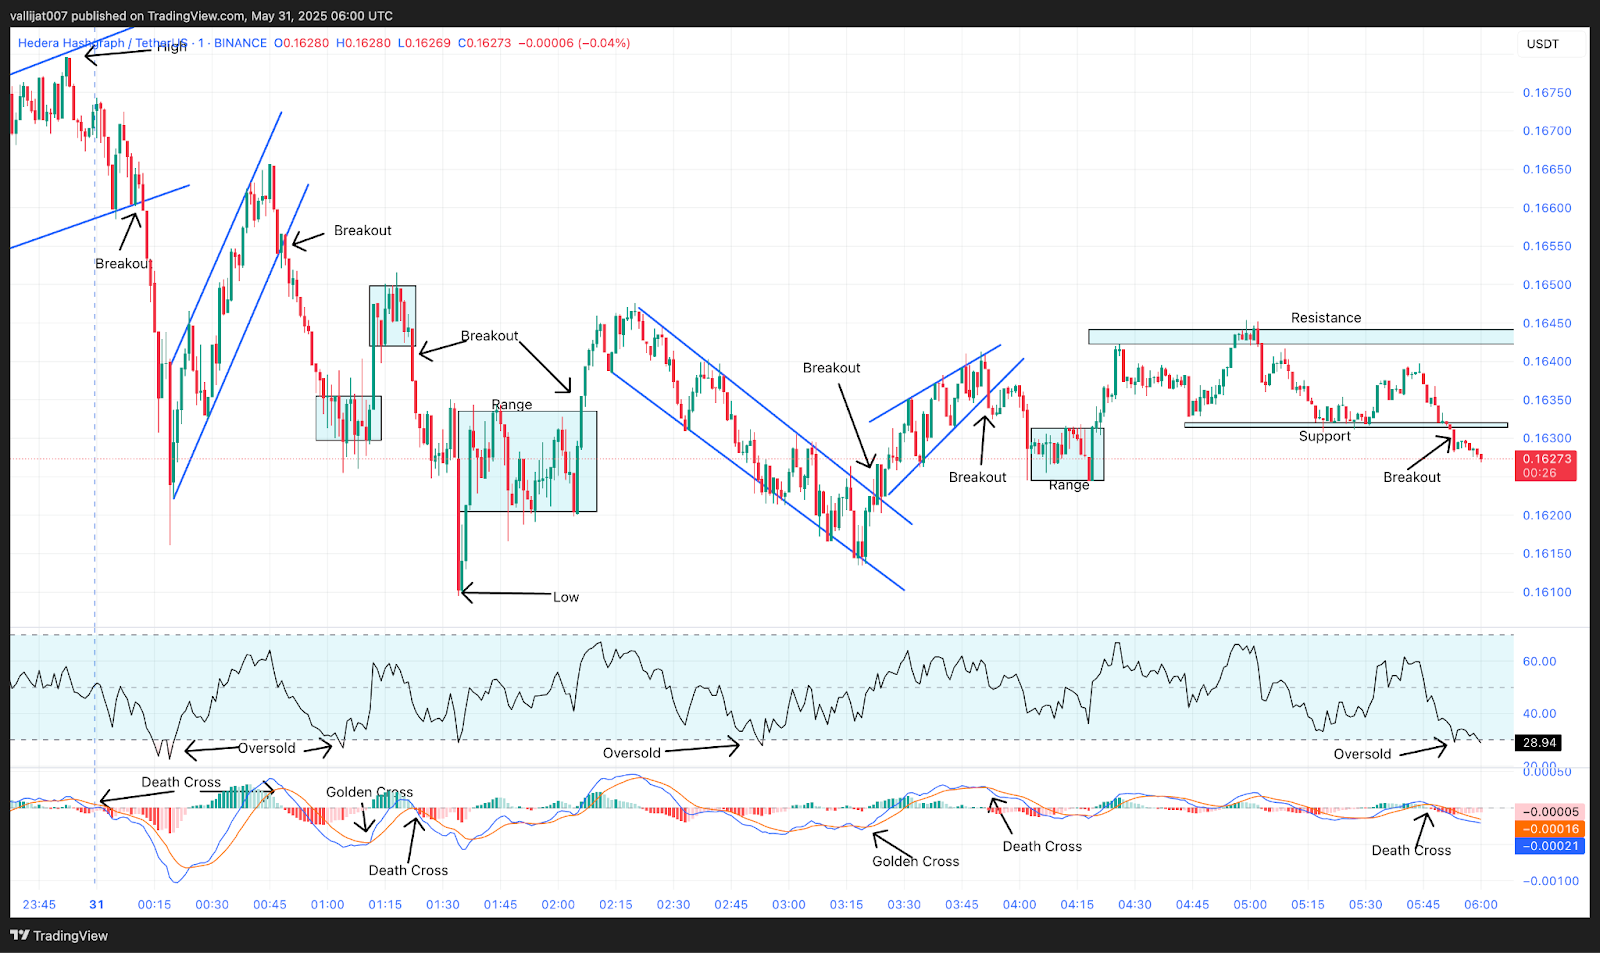
Chart 4: HBAR/USDT M1 Chart, Analysed by vallijat007, published on TradingView, May 31, 2025
The Hedera price formed an upward-moving channel, which marked the high for the day at $0.16796. The upward-moving channel broke to the downside at 00:12 UTC, supported by a death crossover of MACD, and formed another downward-moving channel. The downward-moving channel broke out to the downside at 00:49 UTC, supported by a death crossover of MACD, and formed a range. In the meantime, at 01:05 UTC, RSI dropped below the level of 30, indicating oversold market conditions, suggesting a reversal or at least a pullback.
Golden Cross Breakout Tests $0.16450 Resistance
The range broke out to the upside at 01:12 UTC, supported by a golden crossover of MACD, and formed another range. The second range broke to the downside at 01:22 UTC, supported by a death crossover of MACD, marking the low for the day at $0.16095. After marking the low, the HBAR price rose to the upside and formed a range. The range broke out to the upside at 02:06 UTC, supported by a golden crossover of MACD, and formed a downward-moving channel.
The downward-moving channel broke to the upside at 03:23 UTC, supported by a golden crossover of MACD, and formed a converging triangle pattern. The converging triangle pattern broke to the downside at 03:52 UTC, supported by a death crossover of MACD, and formed a range. The range broke out to the upside at 04:20 UTC, supported by a golden crossover of MACD, and formed a resistance area at $0.16450 and a support area at $0.16320.
The Hedera price broke the support area to the downside at 05:53 UTC, supported by a death crossover of the MACD. In the meantime, at 05:53 UTC, RSI dropped below the level of 30, indicating oversold market conditions, suggesting a reversal or at least a pullback. If the breakout succeeds, the HBAR price may drop to the level of $0.16000. If the breakout fails, the price may rise to the level of $0.16500.
Caution Warranted as Hedera Token Faces Key Support Zone
The HBAR price still swings in a range-bound manner, with multiple fake breakouts on either side of the market. Though there have been sporadic bullish MACD indicators, the Hedera price has found it difficult to keep momentum going and has often gone back to consolidation. Readings for RSI swinging between extremes highlight how sensitive present trading is. Hedera’s short-term trend will most probably be determined by a verified move in either way as it approaches a crucial support area. Until then, merchants should be prudent and refrain from strong positions without verification because the market waits for a definitive breakout or breakdown.
Hedera (HBAR) Price Analysis of June 11, 2025
Hedera began the session trading within a tight range, which broke out to the upside at 00:00 UTC, supported by a golden crossover of MACD, briefly pushing the price to the high of the day at $0.18199. However, the upside momentum quickly faded. HBAR price action turned volatile, forming a series of downward-moving channels and failed breakouts. While RSI peaked above 70 twice, at 02:10 UTC and again at 03:10 UTC, indicating overbought conditions, the Hedera trend struggled to maintain any bullish trend. Multiple golden crossovers attempted to lift the price, but each rally lacked follow-through, leading to choppy consolidation and downward pressure. Currently, Hedera price is trading at $0.18000.
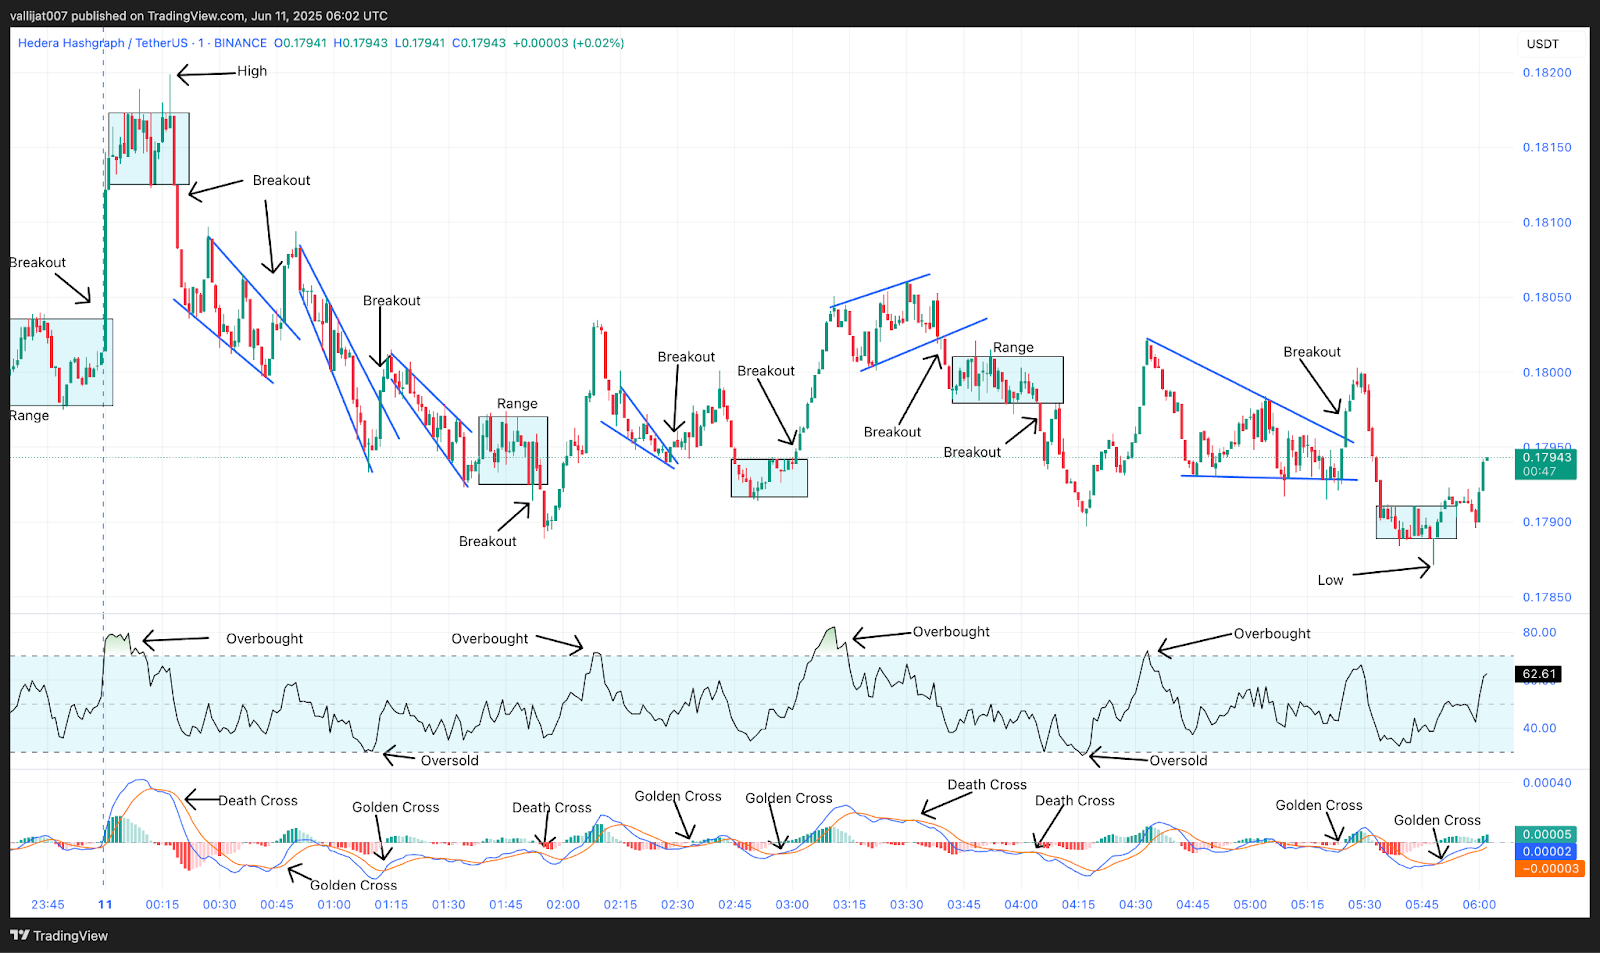
Chart 5: HBAR/USDT M1 Chart, Analysed by vallijat007, published on TradingView, June 11, 2025
With support from a golden MACD crossover, Hedera’s price created a range that broke to the top at 00:00 UTC. Hedera rose to the upside and established another range. Supported by a death crossover of MACD, the range broke out to the downside at 00:19 UTC, forming a descending channel and reaching the day’s high at $0.18199. Supported by a golden cross of MACD, the down-moving channel broke out to the upside at 00:47 UTC, but the upside breakout failed, and the price created another channel to the downside.
The $0.17871 Support Test: Critical Level for Hedera’s Next Move
The second downward-moving channel again broke out to the upside at 01:13 UTC, supported by a golden crossover of MACD, but the breakout failed to sustain, and another downward-moving channel formed. The third downward-moving channel failed to break out to either side, and a range developed. The range broke out to the downside at 01:54 UTC, supported by a death crossover of MACD, but the breakout soon failed, and price rose to the upside, forming a converging triangle pattern. At 02:10 UTC, RSI moved above the level of 70, indicating overbought market conditions, suggesting a reversal or at least a pullback.
Supported by a golden crossover of the MACD, the converging triangle pattern broke out to the upside at 02:29 UTC, but momentum waned, and the Hedera trend fell to the downside, creating another range. Supported by a golden MACD crossover, the range burst to the upside at 03:01 UTC and created an upward-moving channel. At 03:10 UTC, RSI was over 70, pointing to overbought market circumstances and implying a reversal or at least a pullback. Supported by a MACD death crossover, the upward-moving channel broke out to the downside at 03:40 UTC to create another range.
The range broke out to the downside at 04:05 UTC, supported by a death crossover of MACD, and formed a converging triangle pattern. The converging triangle pattern broke out to the upside at 05:25 UTC, supported by a golden crossover of MACD, but the breakout soon faded, and the Hedera price dropped to the downside, forming another range. The range marked the low for the day at $0.17871. The range broke out to the upside at 05:15 UTC, supported by a golden crossover of MACD.
$0.17871 Low Establishes Support in a Choppy Market
Hedera’s trading session was marked by inconsistent breakout momentum and repeated failures of both bullish and bearish setups. While the MACD produced several golden crossovers, they failed to generate sustainable trends. RSI signals above 70 were followed by immediate pullbacks, reinforcing the market’s overbought status. The low for the day was set at $0.17871, acting as key short-term support. If the breakout at 05:15 UTC holds, Hedera price could attempt to revisit the $0.18199 resistance. However, if momentum fades again, further downside toward $0.17500 is possible. Traders should wait for stronger confirmation before positioning, as the HBAR price remains range-bound and indecisive.


