

Are you thinking about buying HNT and wondering whether it’s gearing up for another push or heading into more downside? This Helium price analysis helps break down what’s really happening on the chart. We take you through the latest HNT breakout attempts, support/resistance tests, and what the RSI and MACD are flashing right now. If you’re trading short-term or just watching for solid entries, this one’s for you. Let’s walk through the action and see where HNT could realistically be headed next.
Helium (HNT) Price Analysis of May 5th, 2025
The Helium price action over the last 24 hours shows a sequence of changing trends starting with a sideways phase. Price remained between $3.730 and $3.815 in a clear sideways path until around 16:40 UTC. Despite multiple short-lived attempts to break the upper bound, HNT lacked enough volume or momentum for an early breakout. RSI briefly touched oversold levels near 12:00 UTC before rebounding, while MACD formed a golden cross shortly after, indicating a slight bullish bias brewing. However, price volatility was low, and buyers stayed cautious around the upper limit of the sideways range.

Chart 1 – HNT/USDT M5 Chart, Analyzed by Alokkp0608, published on May 5th, 2025.
Momentum shifted upward during the 16:40–21:00 UTC window as HNT price broke above $3.815 and entered an uptrend channel, climbing toward $3.865. This HNT breakout was confirmed by a golden cross on the MACD and RSI rising into the overbought zone around 18:30 UTC. The price action showed increasing bullish confidence as higher lows formed steadily. Still, after testing and briefly surpassing the $3.850 resistance level, a sharp pullback began. By 21:00 UTC, momentum was already weakening, and a reversal started to take shape, driven by profit-taking and a lack of follow-through above $3.865.
Volatility Increases as Price Fails to Hold Resistance
From 21:00 UTC to 00:00 UTC, Helium price began a rapid descent, eventually reaching the key support level near $3.750 by 23:00 UTC. RSI sharply reversed from overbought to oversold within this short span, signaling a strong momentum shift. This move was accompanied by a death cross on MACD, reinforcing the bearish reversal. Between 00:00 and 02:00 UTC, the price bounced between $3.750 and $3.800 in a choppy manner, struggling to establish direction. MACD flipped to a golden cross briefly, while RSI stayed mostly neutral, highlighting indecision and the market’s attempt to reset after the sharp decline.
A new upward push began around 02:00 UTC, as Helium price started another uptrend, gradually climbing from the $3.760 region. Price eventually reached back to $3.850 by 05:30 UTC, testing the same resistance level once more. This second approach was more cautious, with RSI rising into the overbought region by 05:00 UTC but not as steep as the earlier run. MACD again triggered a golden cross before 04:00 UTC, confirming the recovery attempt. Yet, momentum faded quickly after the resistance test, leading to sideways action between $3.830 and $3.860 for the next couple of hours, reflecting uncertainty and buyer fatigue.
Downtrend Reclaims Control Before Chart Close
By 09:00 UTC, a clear downward trend had reappeared. After reaching an intraday high of $3.887 around 08:45 UTC, HNT entered a declining channel, falling back toward the $3.775 area. RSI dropped sharply from overbought into neutral and oversold territory in less than an hour, showing aggressive momentum reversal. MACD produced a fresh death cross just before the 09:00 UTC close, confirming bearish control. This final leg down erased much of the recent gains and reinforced the importance of the $3.850–$3.865 resistance zone, which repeatedly stalled upside moves. Buyers were unable to sustain upward pressure, leaving HNT vulnerable to further drops.
Helium Faces Rejection at Resistance, Momentum Turns Bearish
HNT’s failure to maintain momentum above $3.865 led to a strong rejection and eventual decline to near $3.775. Momentum has turned bearish heading into the new trading session. Key resistance remains at $3.865 and $3.887, while immediate support lies at $3.750. RSI exited overbought levels quickly and dipped into oversold territory in the final stretch, signaling exhaustion among buyers. MACD confirmed this shift with a new death cross. If selling pressure continues, the HNT price may retest the $3.750 support again. However, consolidation between $3.750 and $3.800 could also follow before the next directional move emerges. A break below $3.750 could lead to deeper losses.
Helium (HNT) Price Analysis of May 9th, 2025
The HNT price action over the last 24 hours shows a clear shift from steady accumulation to strong bullish expansion. The move began early with an HNT breakout past the $3.85 support level around 13:20 UTC, triggering a rally that tested resistance at $4.02 by 21:20 UTC. Although that resistance initially held, RSI indicated overbought conditions during the move, suggesting early bullish exhaustion. MACD confirmed upward strength with a golden cross ahead of the rally, but a death cross formed near the peak hinted at a weakening trend. Price then entered a sideways path, consolidating just below $4.02 with no decisive breakouts through the late session.

Chart 2- HNT/USDT M5 Chart, Analyzed by Alokkp0608, published on May 9th, 2025.
During the 21:00–00:00 UTC and 00:00–03:00 UTC windows, HNT price traded tightly below resistance as the market digested the earlier gains. Repeated overbought signals from RSI emerged without follow-through, reinforcing signs of buyer fatigue. MACD produced back-to-back death crosses, reflecting short-term bearish divergence and momentum cooling off. Despite this, buyers maintained price stability above $3.95, a level that began acting as informal support. This stability suggested underlying bullish intent, though cautious. Price remained rangebound through these intervals, with low volatility and tight candles reinforcing the sideways consolidation bias.
Buyers Regain Control After Dip
The consolidation ended during the 03:00–06:00 UTC window when a modest breakout attempt failed, producing what became a fake breakout above $4.02 around 07:15 UTC. Helium price hit a new high of $4.11 by 08:35 UTC but was quickly rejected, collapsing back to $3.92 by 09:25 UTC, below the prior breakout zone. RSI dropped sharply from overbought into neutral territory, and MACD confirmed the loss of bullish control with another death cross. This breakdown invalidated the earlier breakout, reaffirming $4.02 as a tough resistance zone. The decline also briefly dipped below the new local support, introducing short-term bearish concern.
A strong rebound followed shortly after the 09:30 UTC mark, as HNT price launched into a new breakout that decisively flipped $4.02 from resistance into support. This HNT breakout, beginning around 10:45 UTC, carried prices sharply upward toward the $4.15 resistance area. The move was backed by an RSI spike back into overbought territory, showing renewed buying pressure. MACD confirmed the momentum reversal with a clean golden cross and increasing histogram strength. The transition from failed breakout to confirmed bullish continuation highlights a key momentum pivot, with buyers reasserting dominance ahead of the chart close.
Consolidation Near Resistance After HNT Breakout
By the final 3-hour window leading up to the chart’s endpoint near 11:00 UTC, HNT price was trading firmly at $4.15, testing a newly established resistance zone. Price action showed a clean upward trend, supported by bullish MACD crossover and strengthening histogram bars. RSI remained elevated in the overbought zone, suggesting strong short-term momentum but also signaling potential for minor cooling ahead. The $4.02 level has now turned into reliable support, and any further continuation above $4.15 would likely target $4.25 as the next resistance. The current pattern favors a continuation unless rejected strongly from this zone.
Bulls Regain Full Control as $4.02 Flips to Support
The Helium price trend has turned decisively bullish after reclaiming $4.02 and surging to challenge resistance at $4.15. Momentum is strong, with MACD showing a golden cross and accelerating histogram, while RSI remains firmly in overbought territory after a sharp reversal. Immediate support now lies at $4.02, followed by $3.92 on deeper pullbacks. Resistance at $4.15 remains the key level to break for further upside toward $4.25. If bullish pressure sustains, HNT could breach this ceiling, but short-term overheating suggests a possible brief pause or minor retest before continuation.
Helium (HNT) Price Analysis of May 13, 2025
The Helium price action over the last 24 hours shows a shift from sideways movement into a series of directional trends. The day began with HNT holding in a consolidation range between $3.88 and $4.06. This tight sideways channel lasted from 09:00 UTC until approximately 17:15 UTC, signaling market indecision following a bullish run in previous sessions. The RSI during this phase hovered near neutral, mostly between 50–60, while the MACD showed alternating weak crossovers with no strong momentum in either direction. This period reflected a holding pattern where buyers and sellers were evenly matched, waiting for a breakout or breakdown confirmation.
Chart 3- HNT/USDT M5 Chart, Analyzed by Alokkp0608, published on May 13th, 2025.
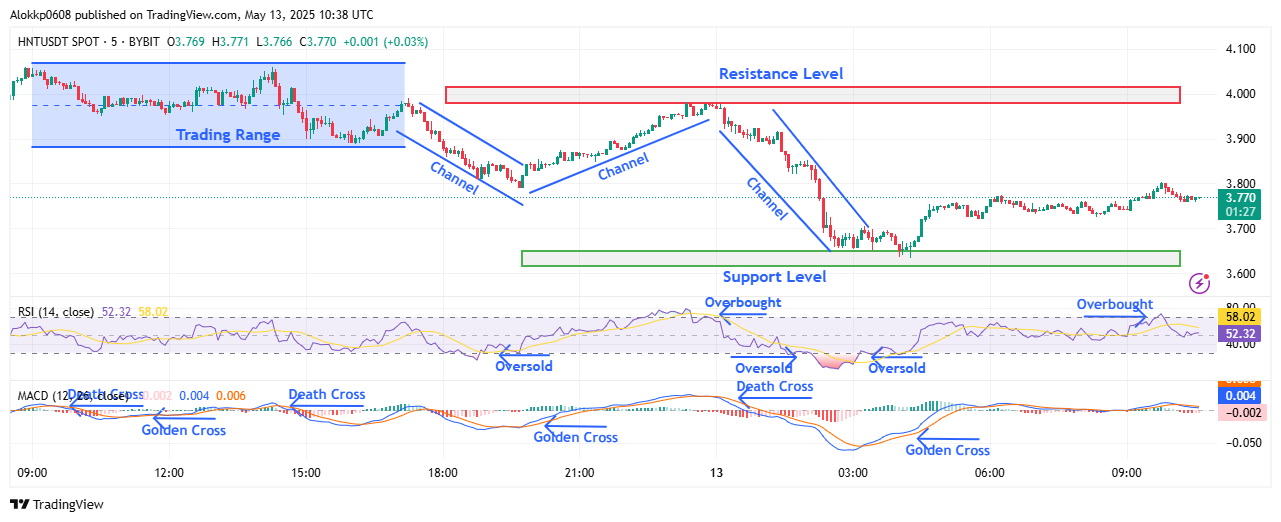
After 17:15 UTC, HNT price broke down from its trading range and initiated a clear downward channel, falling from around $3.90 to $3.79 by 19:40 UTC. This decline aligned with a MACD death cross and an RSI dip into the oversold zone, confirming growing bearish pressure. However, buyers stepped in quickly, launching a sharp bounce that formed a rising channel into the late evening. Between 19:40 UTC and 23:45 UTC, HNT surged back toward $4.00, reaching the resistance zone but failing to break above. This rejection coincided with the RSI briefly crossing into overbought territory, indicating a short-term overheated condition.
Buyers Regain Control After Dip
Following the failed breakout at $4.00, the HNT price reversed course again. Between 23:45 UTC and 04:00 UTC, a fresh wave of sellers pulled the price sharply down into a falling channel, hitting a low near $3.65, a key support zone. RSI slid back into oversold territory, and another MACD death cross signaled continued bearish momentum. Yet again, HNT found footing at this strong support level. Starting around 04:00 UTC, bulls initiated another HNT recovery attempt, which was supported by a MACD golden cross and RSI rebounding from oversold conditions, suggesting a potential shift back to bullish sentiment.
Between 04:00 UTC and the end of the chart window near 10:30 UTC, HNT price moved into a mild recovery and sideways consolidation around the $3.75–$3.78 area. While the earlier surge failed to regain the $4.00 resistance, the HNT recovery from $3.65 highlighted strong buyer interest at lower levels. RSI pushed back above 50 and even neared the overbought region once more, while the MACD maintained a shallow bullish stance. This period reflected cautious optimism, where bulls were rebuilding strength after back-to-back directional swings. Market volatility subsided as traders awaited the next breakout cue.
HNT Stabilizes After Volatile Swings
In the final stretch toward 10:30 UTC, Helium price held steady near $3.77, showing consolidation after earlier volatility. Although momentum has softened, buyers appear to be defending the $3.70–$3.75 area effectively. Price action was more horizontal, with RSI settling near the midline and the MACD flattening just above the zero line, both suggesting neutral momentum for now. While there’s no clear breakout yet, the sustained HNT recovery from $3.65 and failure to break below that support level point to underlying strength building again. Bulls may be preparing for another attempt at the $4.00 barrier.
HNT Momentum Faces Resistance Near $4.00
The HNT price is consolidating just below resistance with early signs of recovery momentum. If bulls maintain control above $3.75, a retest of $3.90 and possibly $4.00 looks feasible. Momentum has shifted to neutral-bullish, but a breakout needs confirmation through stronger volume. The $3.65 level remains crucial as support; any break below could trigger renewed selling. RSI’s latest move toward overbought suggests buyer activity is increasing, though not yet overheated. MACD’s recent golden cross supports the bullish case, but is still shallow. Traders should watch for volatility if HNT nears either key boundary again in the coming hours.
Helium (HNT) Price Analysis of May 27, 2025
The Helium price action today has shown a volatile journey, marked by a breakdown early on, followed by recovery attempts and a range-bound structure. Price opened near $4.160 but quickly broke below the initial support of $4.110 by 01:00 UTC, initiating a sharp downtrend that bottomed out at $4.050 around 01:24 UTC, forming a Lower Low (LL). A Golden Cross on the MACD at 01:26 UTC signaled the start of an upward shift. The price rebounded steadily, building a Higher Low (HL) structure and entering a defined uptrend channel by 01:42 UTC. RSI climbed from oversold levels, showing recovering strength alongside the price movement.
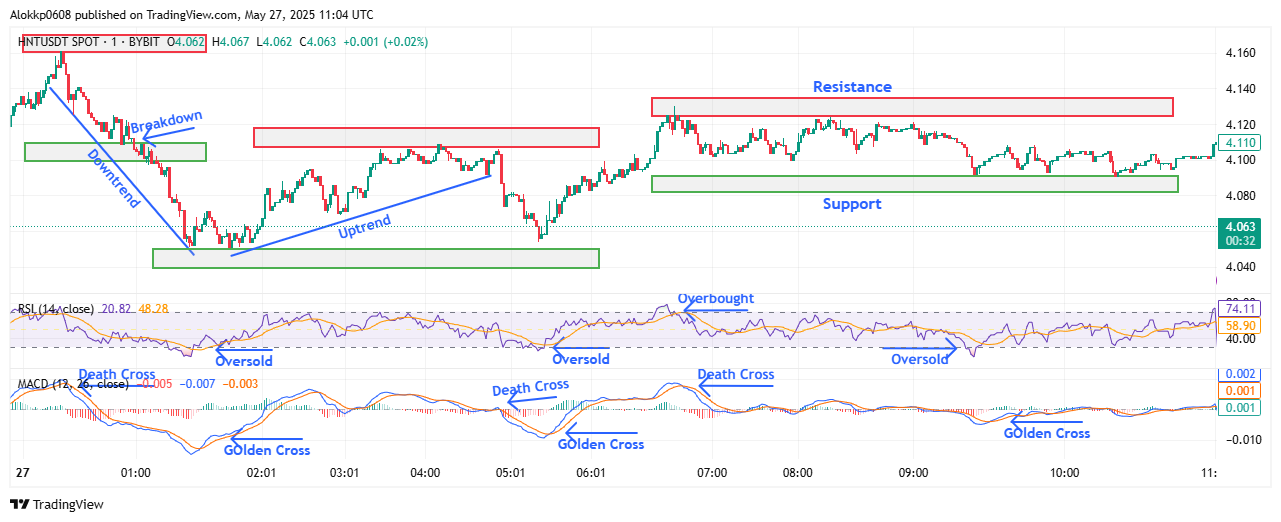
HNT/USDT M-1 Chart, Analyzed by Alokkp0608, published on May 27th, 2025.
Between 01:42 UTC and 04:51 UTC, HNT price stayed in a mild uptrend with resistance near $4.110 repeatedly rejecting bullish pushes. A Lower High (LH) formed near $4.107 around 03:43 UTC, indicating fading strength. Price remained compressed below the resistance, building pressure, but failed to break out decisively. RSI remained in the mid-range, and MACD flattened after its earlier bullish cross. By 04:51 UTC, a death cross appeared on MACD, coinciding with a fast dip to retest the $4.050 support. This price rejection formed another HL, reaffirming buyers’ willingness to defend this key level despite waning momentum.
Failed Breakout and New Trading Channel Develops
Between 05:17 UTC and 06:46 UTC, HNT price established a fresh uptrend, carving out a new HL and climbing toward a newly formed resistance zone around $4.125. The MACD printed a Golden Cross at 05:27 UTC, and the price rallied, hitting the $4.125 high at 06:36 UTC. However, the RSI briefly entered overbought and then turned down, suggesting exhaustion. A death cross on MACD followed at 06:46 UTC, confirming bearish divergence. The rally lost steam, and no Higher High (HH) formed beyond $4.125. Instead, the price settled into a sideways consolidation phase with weakening directional signals.
From 07:00 UTC through 10:30 UTC, the HNT price consolidated within the $4.090–$4.125 range. This Sideways Channel showed tightening price action as momentum faded. Minor support formed near $4.100 with multiple HLs, but no significant HH occurred. RSI frequently tested the midpoint without clear breaks, indicating indecision. MACD produced another Golden Cross at 09:30 UTC, but it lacked follow-through. The price continued oscillating near the support zone with shrinking candles, reflecting low-volume consolidation. Traders remained cautious, waiting for a clear direction above $4.125 or below $4.090 to confirm the next phase.
Stability Below Resistance as Session Closes
In the final stretch of the chart, HNT hovered at $4.110, locked between the identified resistance and support levels. No fresh momentum emerged despite the prior Golden Cross, and RSI climbed to around 58.90 but didn’t reach the overbought zone again. Price tested the upper band of the range but was capped, forming a short-term LH just below $4.115. The session closed with price action stabilizing in a narrow $4.105–$4.110 pocket, leaving the market in a neutral stance. The structure now holds $4.090 as a soft support and $4.125 as firm resistance until a decisive breakout or breakdown occurs.
HNT Struggles to Break $4.125 as Momentum Stalls
The Helium price intraday structure leans neutral to mildly bullish, but upward momentum is fading below $4.125 resistance. For now, $4.090 remains a short-term support to watch, while $4.050 serves as a more critical floor. A sustained breakout above $4.125 could open room toward $4.145, but failure would risk revisiting the $4.090 zone. MACD’s recent Golden Cross has yet to spark a follow-through rally, and RSI’s inability to retest overbought territory suggests caution. Until momentum reasserts above resistance, price is likely to remain in a narrow consolidation band.
Helium (HNT) Price Analysis of June 13th, 2025
The Helium price action today shows a steep decline early in the session, followed by prolonged sideways movement. Price opened near $2.697 and quickly reversed in a sharp downtrend, confirming breakdown below the $2.605 support by 00:37 UTC. Despite a brief bounce attempt around 00:38 UTC, sellers overwhelmed buyers and dragged the price into a second downtrend channel. The lower support at $2.515 provided some stability as the decline decelerated. RSI dipped into oversold territory near this point, while the MACD printed a golden cross — a minor bullish divergence that helped slow the fall.
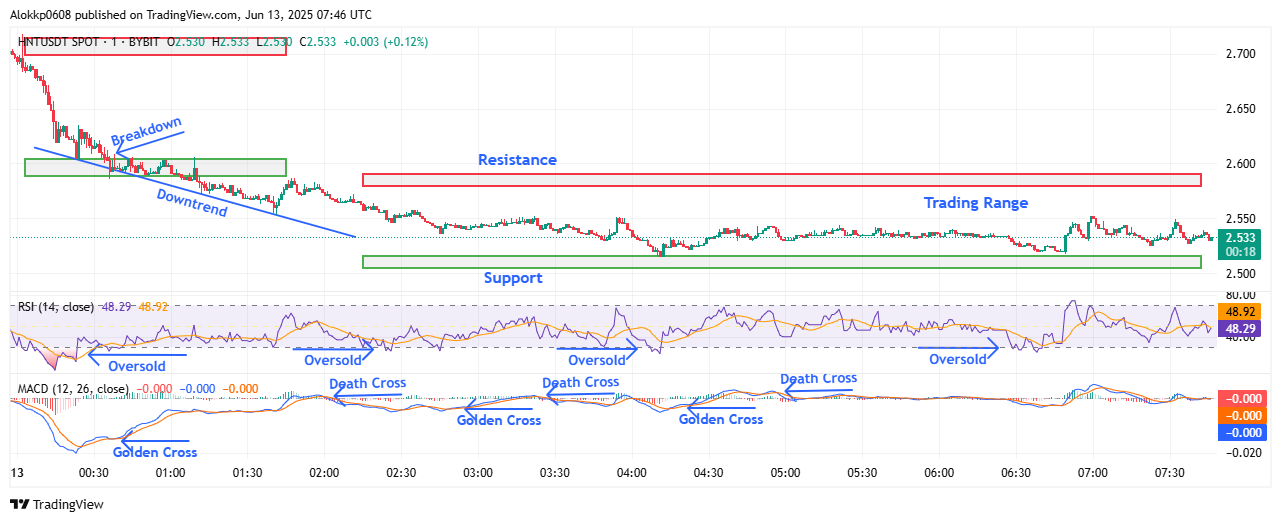
HNT/USDT M-1 Chart, Analyzed by Alokkp0608, published on June 13th, 2025.
From 01:00 UTC to 02:00 UTC, HNT prices moved within the new lower range of $2.515 to $2.580, forming multiple lower highs (LHs) that confirmed continued bearish pressure. The RSI remained weak and hovered below the midline, failing to show any bullish strength. MACD showed indecision, with the signal and MACD lines almost flat, reflecting low momentum. Although the market attempted to lift off from support twice during this window, it failed to reach previous highs, suggesting waning interest from bulls and ongoing dominance of sellers at every small rally attempt.
Sideways Drift Within New Range Shows Weak Buyer Interest
Between 02:00 and 04:00 UTC, the price consolidated tightly in a narrow band, moving laterally between $2.523 and $2.548 with no breakout attempts. There were no clear higher highs or higher lows, confirming an indecisive trading structure. Multiple MACD crossovers, including golden crosses at 02:47 UTC and 04:15 UTC, failed to spark any trend. Death crosses at 03:25 UTC and 04:55 UTC added to the indecision. RSI tested the oversold zone again, showing how weak the bounce attempts were. The support zone around $2.515 continued to act as the floor, but no sustainable recovery materialized.
From 04:00 to 06:00 UTC, HNT price action stayed inside the same channel, with occasional upticks facing immediate rejection near $2.550. The market printed minor higher lows (HLs), but these were not accompanied by strong highs, making it more of a compression than a bullish trend. RSI remained trapped between 45 and 50, reflecting a neutral-to-weak tone. Meanwhile, MACD hovered around the zero line without firm crossover signals, showing traders were in wait mode. The lack of upward follow-through highlighted that the earlier golden crosses were not supported by real buying momentum.
Rejection Near $2.550 Caps Any Upside Momentum
From 06:00 to 07:45 UTC, HNT prices continued their struggle below the $2.550 zone, facing repeated resistance at that level. Despite a quick uptick to $2.545 around 07:10 UTC, the price could not build momentum and slipped back. This rejection created a minor lower high (LH) and confirms $2.545–$2.550 as a short-term ceiling. RSI remained muted below 50 throughout the window, and MACD showed little follow-through after a weak crossover, both suggesting a lack of bullish conviction. The broader pattern remains a consolidation with fading volatility and no clear reversal signs yet.
HNT Price Stuck in Sideways Zone With Momentum Still Neutral-Bearish
With price holding between $2.515 and $2.550, Helium remains range-bound after an early sharp decline. The immediate outlook is neutral-bearish unless the price can close above the $2.550–$2.580 resistance zone. On the downside, $2.515 and then $2.500 serve as crucial supports. Momentum remains weak: RSI has yet to reclaim 50 meaningfully, and MACD’s recent golden and death crosses have lacked strength. For bulls to regain traction, a clear break and hold above $2.580 is needed. Until then, the market appears directionless and vulnerable to another leg down.


