

Hype coin has recently seen some exciting price action, with sharp moves, trend reversals, and a key HYPE breakout attempt. Traders have closely watched how it reacts around the critical $18.80 resistance level. After a fake breakout earlier, the HYPE Token is now holding above this level, raising hopes for a real upward move. With momentum building again, many wonder if this is the start of a bigger rally or another trap.
HYPE Price Analysis of 29th April, 2025
The HYPE price action on a 5-minute chart on April 28 exhibits a strong uptrend initiating at 01:45 UTC, accelerating momentum through a defined bullish channel. The HYPE Token climbed steadily toward the resistance zone near $18.80, peaking around $18.57 by 09:25 UTC. In this rally, RSI flashed overbought signals across several candles, while MACD hovered in a bullish crossover range. However, signs of exhaustion emerged below resistance, where price action paused and formed a brief sideways structure before slipping into a sharp descending channel.

Chart 1, Analyzed by Alokkp0608, published on April 29th, 2025.
Between 09:30 UTC and 15:30 UTC, HYPE price entered a clear descending channel, steadily shedding gains as it approached the critical support zone around $17.20. The drop aligned with multiple RSI dips into oversold territory, while MACD momentum waned into a bearish range. This decline was halted precisely at the support, confirming its significance. From there, Hyperliquid entered a sideways structure between $17.25 and $17.85, highlighting buyer interest at the lower boundary. MACD signaled early recovery during this period, while RSI rebounded from lows, reflecting emerging demand and a potential base-building phase near support.
Between 18:45 UTC and 00:45 UTC, the HYPE price broke upward into another bullish channel, reclaiming levels up to $18.53 before briefly losing steam around 21:20 UTC. A stronger uptrend began around 22:30 UTC, driving HYPE toward the $18.80 resistance again. During this push, RSI entered and sustained overbought conditions, while MACD crossed back into bullish momentum. A HYPE breakout above $18.80 occurred around 00:45 UTC on April 29 but proved to be a fakeout as sellers quickly reclaimed the zone, pushing the price back to $18.30. Despite this retracement, buyers defended higher lows, initiating a recovery toward resistance again.
HYPE Price Outlook: What Is Ahead for Hyperliquid?
HYPE built an upward structure above $18.50 between 03:00 UTC and 07:30 UTC, testing the resistance-turned-support around $18.80. MACD turned bullish again, while RSI hovered near overbought levels, suggesting momentum remained on the bulls’ side. HYPE Price action has now pushed convincingly through resistance, reaching $18.90. Holding above $18.80 would mark an accurate HYPE breakout confirmation, which could target $19.40 and $20.10 as the following resistance zones. A failure to hold could trigger a retest of $18.50 and $18.30, but indicators currently favor continuation. As long as momentum persists and no bearish divergence appears, upside remains more likely in the short term.
Will HYPE Hold Above $18.80 or Slip Back Again?
HYPE finally shows strength after breaking through the stubborn $18.80 resistance, this time for real. A fake-out rattled a few nerves earlier, but now the HYPE Token seems to be standing. Momentum indicators like the MACD and RSI still flash bullish signals, suggesting there’s room for more upside.
If buying pressure keeps up, we could see a push toward $19.40 or $20.10 in the near term. That said, $18.80 remains a critical level to watch. If the price dips below it, a quick slide to $18.50 or even $18.30 isn’t off the table. The breakout looks solid for now, but staying above support is key to keeping this rally alive.
HYPE Price Analysis of May 1st, 2025
The HYPE price action on a 5-minute chart over the past 24 hours reveals a strong transition from a compressed trading structure into an assertive upward breakout. From 00:00 UTC until nearly 12:00 UTC on April 30, the price remained inside a sideways path between $18.80 and $18.15, marked by low volatility and range-bound movement. During this period, RSI hovered near neutral zones with brief overbought spikes that lacked follow-through. A death cross appeared on the MACD around 06:00 UTC, reinforcing stagnant momentum. This indecision phase represented accumulation, where buyers and sellers were broadly balanced before a shift began post-12:00 UTC.

Chart 2- HYPE/USDT M-5 Analyzed by Alokkp0608, published on May 1st, 2025.
Between 12:00 UTC and 15:00 UTC, HYPE price broke out of the range with a sharp drop into a descending channel that bottomed at $17.65. The fall briefly breached the $18.00 support, but the decline was quickly absorbed, signaling strong buying interest. This reversal came with MACD forming a golden cross around 13:45 UTC, which aligned with a bullish RSI recovery from the oversold zone. By 14:15 UTC, the Hyperliquid token price had exited the downtrend and began carving a new ascending channel. This bullish pivot was the first sign of real directional intent, supported by increasingly bullish RSI readings and narrowing MACD histograms.
A Hype Breakout Retest Confirms Strength
From 15:00 UTC to 21:00 UTC, HYPE gained steadily within the newly formed ascending channel, breaking above multiple interim resistances before challenging the key level at $19.70. By 23:10 UTC, the price broke through this resistance with momentum, reaching as high as $20.28 just after midnight UTC on May 1. RSI entered the overbought zone during this HYPE breakout phase, reflecting aggressive buying pressure, while MACD widened in bullish territory after a golden cross near 20:30 UTC. This phase marked the strongest leg of the rally, signaling broad participation from buyers and confirming bullish structure.
However, between 00:15 UTC and 03:50 UTC, a pullback emerged. The Hyperliquid token fell from its peak of $20.28 below the $19.70 resistance zone, touching $19.26. This decline followed an RSI peak and sharp reversal from overbought territory, indicating buyer exhaustion. A death cross appeared on the MACD in tandem, showing weakening momentum. Despite this drop, the rejection near $19.26 found support above the prior ascending structure, and the HYPE price avoided retesting deeper levels like $18.80. This contained drop, though initially sharp, helped reset overbought conditions and allowed consolidation for another leg.
Sustainability Above Breakout Level Remains Key
Following the retracement, HYPE price began a recovery phase around 03:50 UTC, and by 05:15 UTC, it successfully retested and broke above the $19.70 level once again. This second HYPE breakout held better structure, as price climbed steadily toward $20.00 and consolidated in a tight range, suggesting healthier continuation potential. RSI hovered just below overbought, showing controlled bullish pressure. MACD lines stayed aligned in a minor bullish divergence from the price lows, indicating underlying momentum still favors buyers. Price hovered near $20.05 as of the latest candle, trading just above resistance-turned-support.
Strong Momentum But Needs To Hold Above $19.70 For Further Upside
HYPE price shows healthy bullish momentum, but sustaining above $19.70 remains critical for further gains. If bulls hold the breakout, price could test $20.30 again, with room toward $20.80 on extended strength. Support rests at $19.25 and $18.80. RSI is floating just under the overbought zone, bullish but vulnerable to fatigue, while MACD remains in a mild bullish state with narrowing histograms. For now, upside bias remains intact, but failure to hold above $19.70 could trigger another round of short-term profit-taking. Traders should watch for volume confirmation and MACD continuation to assess the strength of the breakout.
Hyperliquid (HYPE) Price Analysis of May 29, 2025
The Hyperliquid token price action today shows early bullish strength followed by sharp rejection and consolidation. The rally began at 00:17 UTC with a strong push toward the $34.600 resistance. This move came after a MACD golden cross and was supported by RSI entering the overbought zone. Price breached the resistance briefly at 00:57 UTC, reaching a high near $34.970, but failed to hold and reversed sharply after 01:03 UTC as a death cross formed on MACD. The resulting lower high at 01:53 UTC confirmed weakness, and a deeper pullback began, dragging the price to $33.928 before a slight rebound.
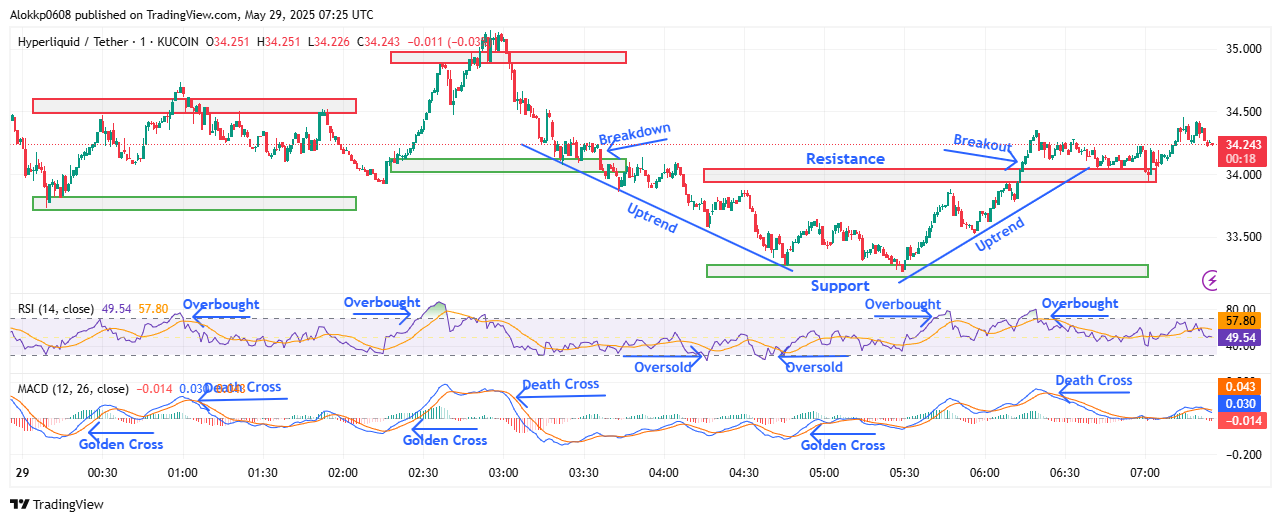
HYPE/USDT M-1 Analyzed by Alokkp0608, published on May 29, 2025
Between 02:15 UTC and 03:37 UTC, HYPE entered a new uptrend channel with a higher support level around $34.125 and resistance at $34.970. Price briefly broke above this range near 02:52 UTC but quickly rejected, leading to a breakdown below support at 03:37 UTC. RSI confirmed this shift, reversing from overbought back toward neutral, while MACD produced a death cross at 02:58 UTC. This shift marked a new LL at $33.285 by 04:45 UTC. Price action formed lower highs and lower lows throughout this decline, establishing a clearly bearish structure across the two-hour span.
Uptrend Recovery and Structure Shift
From 05:00 UTC onward, HYPE stabilized near $33.285 and began climbing steadily. A golden cross formed on MACD at 05:28 UTC, and RSI emerged from oversold territory, fueling a breakout above the new $34.055 resistance by 06:14 UTC. This breakout also invalidated the prior downtrend as price set a new HL at $33.900 before breaking out. The price then climbed above $34.200, establishing a new structure of higher highs and higher lows. This bullish shift occurred over the next hour with consistent volume and RSI testing overbought levels again.
Between 06:30 UTC and 07:15 UTC, the HYPE price continued hovering just above the $34.055 resistance zone, now acting as support. Despite a death cross forming on the MACD at 06:23 UTC, the downside momentum faded quickly. Price traded sideways with higher lows being respected, indicating a potential consolidation phase rather than a reversal. RSI remained near 57, showing neutral to bullish pressure, as the market awaited a decisive move. The higher lows at $34.100 and $34.150 suggest buyers remain active just above the prior resistance-turned-support.
HYPE Price Sideways Drift After Breakout Near $34.24
The most recent action shows that the HYPE price is holding within a tight range around $34.200–$34.300. After the 06:14 UTC breakout, the price formed a short consolidation pattern just above the $34.055 mark. Buyers failed to drive momentum toward the prior high near $34.970, showing hesitation. The sideways drift around the $34.243 mark signals reduced volatility and indecision, though the prior breakout level is still holding firm. MACD remains near neutral with a slight downward bias, and RSI hovers below 60, suggesting mild bullish control but no breakout force. Structure remains intact unless $34.055 breaks down.
HYPE Attempts Recovery but Faces Resistance Below $35
Hyperliquid token shows signs of bullish recovery, but the momentum is softening just below the $34.600–$34.970 resistance zone. Price has held recent gains above the $34.055 level, suggesting short-term bullish bias remains, though upward drive is stalling. Watch $34.055 and $33.900 as key support zones. Resistance sits at $34.600 and $34.970. MACD’s recent death cross tempers momentum expectations, while RSI remains in a neutral range after avoiding a sharp pullback. If price holds above $34.200, a move toward $34.600 remains possible, but momentum needs to pick up quickly.
Hyperliquid (HYPE) Price Analysis of June 3rd, 2025
The HYPE price action today shows early volatility within a tight range between $36.24 and $36.70. Price initially tested resistance around $36.70 multiple times but failed to break through. After forming a Lower High (LH) near 00:50 UTC, bearish momentum took over. A breakdown of $36.24 followed by sustained selling pushed the price down to $36.00 by 01:52 UTC. MACD confirmed this weakness with a death cross around 01:11 UTC, and RSI hovered near neutral, unable to show any strength. The early session established a bearish tone and created the first key support around $36.00.

HYPE/USDT M-1 Analyzed by Alokkp0608, published on June 3rd, 2025
Between 01:52 UTC and 03:22 UTC, HYPE price moved into a descending channel, making a Lower Low (LL) at $35.81. A short-lived bounce from this level retraced to $36.10 resistance before another breakdown. This downtrend was confirmed as the MACD stayed weak, despite a brief golden cross at 02:11 UTC. RSI also dipped near the oversold zone, aligning with the price revisiting support levels. Notably, the range between $35.81 and $36.10 became the next support-resistance band. As price broke $35.81 at 03:22 UTC, it entered a new range defined by support at $35.60 and resistance near $36.10.
Strong HYPE Recovery Off Support, But Resistance Holds
From 03:30 UTC to 05:30 UTC, the HYPE price stabilized near $35.60 and started forming an ascending structure with Higher Lows (HLs). A golden cross on the MACD at 04:50 UTC confirmed this bullish reversal. RSI climbed steadily without reaching overbought, showing controlled buying strength. The price pushed through $36.10 resistance around 05:30 UTC, completing a breakout and transitioning out of the downtrend. However, despite the breakout, momentum struggled to carry forward. Sellers reappeared near the earlier resistance zone at $36.24, hinting at hesitation in continuing the uptrend.
Following the breakout, between 05:30 UTC and 06:20 UTC, HYPE price reached a session high just above $36.30 before pulling back again. A brief rally was rejected near the previous RL zone around $36.24–$36.30, suggesting strong selling pressure at that level. MACD remained in a weak golden cross, but the histogram began fading, and RSI also cooled down from near 50 to 42. The price dipped back to $36.00 by the end of the session, closing below the prior breakout zone. This hesitation after the rally suggests a pause or potential reversal unless fresh bullish momentum returns quickly.
HYPE Price Hesitates After Breakout, Bullish Momentum Fading
Short-term momentum for the Hyperliquid token has turned neutral to slightly bearish after an early breakout attempt lost steam. Price is now hovering around $36.00, which aligns with the mid-range of the $35.60 support and the $36.24–$36.30 resistance zone. Immediate support remains at $35.60, while $36.24 acts as the key ceiling. A break below $36.00 could send HYPE retesting $35.81. MACD’s fading golden cross and RSI’s drop toward 40 show weakening bullish energy. Unless price reclaims and holds above $36.24 convincingly, upside remains limited in the near term.
HYPE Price Analysis of June 9th, 2025
The HYPE price action today shows multiple trend shifts within a tight $0.40 range. After opening near $34.70, the price moved in a choppy structure marked by quick golden and death crosses on the MACD, indicating indecisiveness. Between 00:00 and 01:40 UTC, the price hovered between $34.70 and $35.10, with RSI oscillating near 60 and briefly entering overbought by 01:30 UTC. A breakout attempt at $35.10 around 01:42 UTC failed to sustain, leading to another dip. Support at $34.70 held firmly multiple times during this stretch, establishing a strong base early in the session.
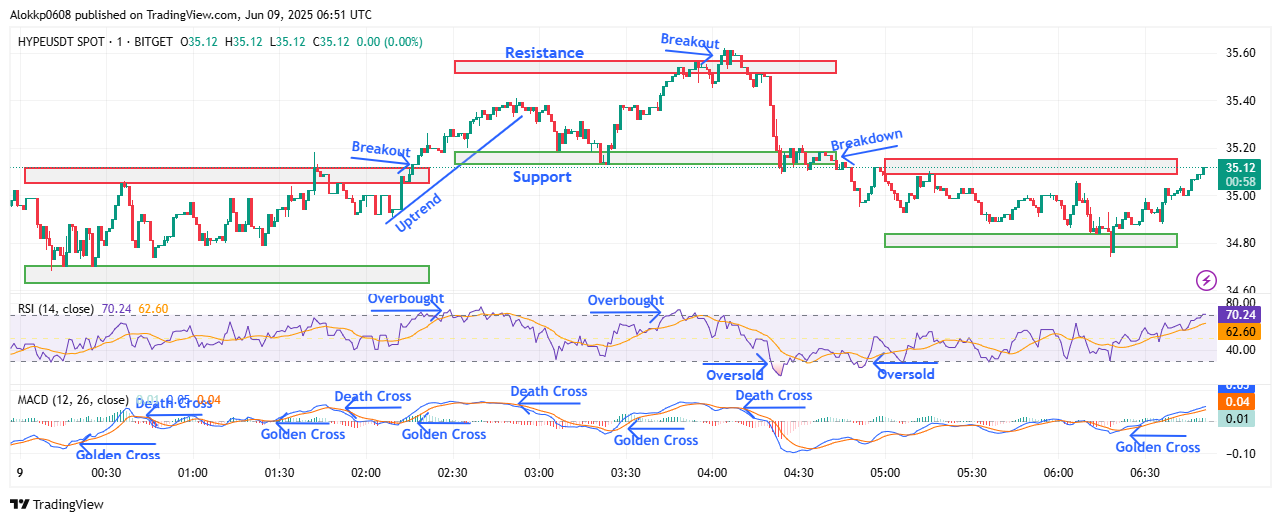
HYPE/USDT M-1 Analyzed by Alokkp0608, published on June 9th, 2025
Between 01:40 and 03:00 UTC, HYPE price shifted into a clearer uptrend, forming HHs and HLs. By 02:11 UTC, the price climbed steadily into an ascending channel and broke through the $35.10 resistance again at 02:16 UTC, this time with confirmation. RSI re-entered overbought territory while MACD showed a golden cross just before the rally, aligning with rising momentum. The breakout extended to a session high of $35.41 by 02:52 UTC. A new support was established at $35.18, with the price briefly dipping to test it at 03:23 UTC before bouncing upward. This leg marked the most directional move so far.
Consolidation and Failed Retest Above $35.55
Between 03:25 and 04:10 UTC, HYPE price action showed another sharp rally, forming an HL at $35.23 and challenging the $35.55 resistance. A brief breakout at 04:04 UTC pushed the price to a new HH, but the breakout lacked volume strength. By 04:09 UTC, MACD flashed a death cross while RSI began falling from overbought. Selling pressure followed quickly, reversing the gains. This marked a failed breakout, trapping late buyers. A strong rejection at $35.55 sent prices back down into the prior range, setting a new LH. The zone from $35.50 to $35.55 emerged as a key resistance band.
Between 04:10 and 06:00 UTC, the structure broke down further. A HYPE breakdown below $35.18 support occurred by 04:43 UTC, leading to a quick drop toward $34.85. The new lower support zone, around $34.85–$34.88, was held as prices printed a series of HLs. Despite multiple bounce attempts, resistance near $35.15 proved firm. The MACD saw multiple small death crosses while RSI hovered just above oversold levels twice. Momentum was clearly fading during this stretch. The chart printed a tight range with no fresh HHs, suggesting sellers were in control but not aggressive enough to force deeper lows.
Rebound Attempt Sets Tone For Morning Session
From 06:00 to 06:50 UTC, the HYPE price began climbing again after basing out around $34.88. A golden cross on MACD occurred at 06:18 UTC, just as the price began forming HLs and pushing upward in a new short-term uptrend. RSI climbed steadily toward 70 without yet entering overbought. Price reclaimed the $35.00 level, and as of the final candle at 06:50 UTC, it was attempting to break above $35.15 resistance again. This area has now been tested multiple times, suggesting a potential breakout attempt may follow if volume increases. Support remains solid at nearly $34.85, which acted as a springboard.
HYPE Faces Crucial Retest at $35.15 as Momentum Rebuilds
Momentum has turned mildly bullish again in the short term, with the Hyperliquid token attempting to reclaim the $35.15 resistance. Immediate support rests near $34.85, with a broader structure forming between this zone and $35.55 above. A clean breakout above $35.15 with follow-through could open the door back toward $35.40+. However, failure here risks another rotation down toward $34.88. MACD’s recent golden cross supports upward bias, but RSI is nearing overbought, hinting at possible short-term exhaustion. Traders should watch for strength or rejection near $35.15 in the next leg.
Hyperliquid (HYPE) Price Analysis of June 23rd, 2025
The HYPE price action today shows volatile swings between support and resistance levels, with multiple trend shifts. Price started in a choppy range between $35.23 and $36.10 until around 02:34 UTC. During this phase, it created both higher highs (HH) and lower lows (LL), showing indecisiveness. RSI briefly entered overbought near 01:55 UTC, and MACD had alternating golden and death crosses, suggesting no firm directional bias. Price rejected near the $36.00 mark multiple times, affirming strong resistance. Support formed firmly near $35.23, with wick rejections indicating buyer interest.
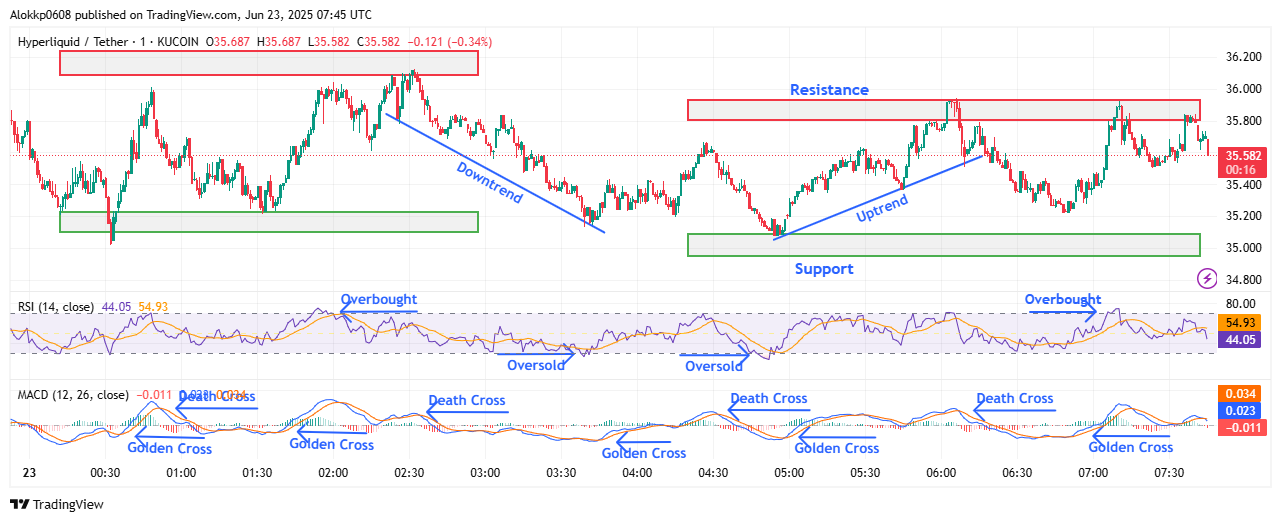
HYPE/USDT M-1 Analyzed by Alokkp0608, published on June 23rd, 2025
From 02:34 UTC to 03:40 UTC, the HYPE price dropped into a clean downtrend, forming consecutive lower highs and lower lows. This bearish stretch saw HYPE fall from $35.94 to a low of $35.155. RSI dipped into oversold territory near 03:30 UTC, signaling potential exhaustion in selling. Around the same time, a MACD death cross added further weight to the bearish momentum. However, the selling slowed as it neared the earlier support zone around $35.15–$35.23, indicating this level continues to be a strong defensive base for bulls.
Trend Reversal and Bullish Recovery Attempts
Between 03:43 UTC and 04:31 UTC, the Hyperliquid token shifted sharply into a bullish recovery. A golden cross appeared on the MACD around 03:43 UTC, and RSI snapped upward from oversold levels. This move created a quick higher low at $35.155 and rallied to $35.66, suggesting a near-term trend reversal. However, a death cross followed at 04:31 UTC, just as the price got rejected again below $35.70, hinting the upside might still be capped. This rejection also created a lower high (LH), making the rebound vulnerable to another downside test.
From 04:31 UTC to 06:02 UTC, the HYPE price bounced again from $35.09 (a slightly deeper SL) and entered a cleaner uptrend. The structure formed a new higher low and then surged toward $35.80, completing a full retest of the local RL. The RSI entered overbought again during this run, and MACD printed another golden cross near 04:57 UTC. Despite the bullish signals, rejection came swiftly again near $35.80, forming another LH and suggesting persistent selling pressure at this RL zone. Price failed to break past this ceiling decisively.
Rejection at Key Resistance Zone Near $35.80
From 06:02 UTC until the chart’s end, HYPE made another two attempts to break $35.80 but failed both times. The first attempt was at 06:02 UTC, and the second at 07:09 UTC, both failing near the same resistance, reinforcing that $35.80–$36.10 remains a firm ceiling. RSI touched the overbought boundary once again before rolling over. MACD also reflected hesitation, showing a golden cross followed quickly by flattening lines. Price action during this window remained choppy and indecisive, suggesting traders are unsure whether bulls can follow through.
HYPE Momentum Slows as Resistance Holds Firm at $35.80
Hyperliquid token’s latest price action shows fading bullish strength as it repeatedly fails to push above $35.80. While support at $35.09–$35.23 held firm and triggered multiple rebounds, momentum is neutral to slightly bearish in the short term. The current support zone remains at $35.09–$35.23, while resistance stands between $35.80 and $36.10. MACD’s latest golden cross has yet to deliver a follow-through, and RSI has backed off from overbought. If bulls can’t push through $35.80 soon, the price may retest the support zone again. Today’s action up to 07:45 UTC reflects a tight battle between short-term bulls and firm overhead resistance.


