

Are you watching the latest move in ICP Token? Does this breakout have more room to run? After spending hours in a tight range between $5.22 and $5.26, the Internet Computer price has finally started climbing to $5.35 with rising momentum. Traders are now eyeing key resistance levels as indicators show early signs of strength. Bulls are holding the edge with the RSI cooling below overbought and the MACD showing a golden cross. If you’re tracking the next move in ICP price, let’s break down the full 24-hour price action and see what’s next.
Internet Computer (ICP) Price Analysis of May 27, 2025
The ICP price analysis shows a shift from bearish pressure to strong bullish momentum, with clear phases of recovery and breakout. ICP Price started the day around $5.30 but quickly fell into a downward channel, where sellers dominated the early session. Between 00:00 and 01:30 UTC, the ICP Token dropped below $5.15, triggering multiple oversold signals on the RSI and a death cross on the MACD. This was a sign of weakening sentiment as traders booked profits. By around 01:40 UTC, the ICP Token found support under $5.10. From there, a slow and steady recovery began. A golden cross appeared on the MACD, and RSI climbed out of the oversold zone. Buyers stepped in, pushing the price gradually back above $5.20 by 03:00 UTC.

Chart 1- ICP/USDT M1 Chart, Analysed By Anushri Varshney, Published on TradingView, May 27, 2025
As momentum strengthened, the RSI entered the overbought zone for the first time during the uptrend. MACD confirmed bullish control with another golden cross around 03:15 UTC. The ICP Price climbed to around $5.27 before stalling. The price was in a sideways trading range from 03:30 to 04:30 UTC, between $5.22 and $5.26. In the fit of that range, RSI cooled off, and a death cross formed on the MACD around 04:00 UTC, suggesting a pause in momentum.
ICP Breaks Above $5.30 but Faces Key Resistance at $5.35
Between 05:00 and 06:00 UTC, the Internet Computer token showed renewed strength. A golden cross formed, and the price broke out of the range into a new upward channel. This ICP Breakout sent the token price up over $5.30 and peaked around $5.35, at around 0600 UTC. Resistance key levels reside at $5.35, and support is located at $5.22. If we get a strong close above the $5.35 price point, we could see another ICP breakout towards levels near $5.40. But if bulls lose steam, a retest of $5.22 is likely.
ICP Price Maintains Bullish Structure After Clean Breakout
The ICP Token has shown strong technical recovery in the past 24 hours, with clear trend shifts and confirmation from RSI and MACD indicators. The initial decline was absorbed near $5.10, followed by a steady climb backed by multiple golden crosses. The recent ICP breakout above $5.30 confirms buyer interest and a short-term bullish structure. RSI is still below the overbought zone, and MACD remains on a positive crossover, which favors potential bullish momentum, but $5.35 should still be observed as a resistance level. If this level is breached, the ICP price could aim for $5.40 or higher. On the downside, support at $5.22 will be key to holding the gains.
Internet Computer (ICP) Price Analysis of June 2, 2025
The price action of ICP highlights a clear turn in market momentum, starting with a sideways period of action. The market then attempted to break out, before a very sharp pullback, and subsequent recovery within an upward channel. The session started with the ICP token traded sideways, from midnight until approximately 01:00 UTC, moving in a tight range for a couple of hours. The RSI was drifting around 50, and the MACD was flat, both features confirming a low level of momentum.
Around 01:15 UTC, a clear ICP breakout occurred, with the price spiking to $4.88. In any case, this movement did not last long. At 01:30 UTC, the price turned around and entered a downward channel, which lasted until 03:45 UTC. The ICP Price made lower highs and lower lows, eventually hitting a session low near $4.80. During this period, the RSI dropped into oversold territory multiple times, and MACD printed several death crosses, signaling strong bearish momentum.
ICP Price Climbs from $4.80 to $4.95 Before Cooling to $4.85
Between 04:00 and 05:00 UTC, the ICP token entered a new range-bound phase between $4.82 and $4.84 and demonstrated some recovery without much direction. The RSI stayed below 50, while MACD continued to flicker between golden and death crosses, reflecting market uncertainty.

Chart 2- ICP/USDT M1 Chart, Analysed By Anushri Varshney, Published on TradingView, June 2, 2025
After 05:15 UTC, the price briefly dipped again to $4.80, forming a short downtrend, but this was quickly followed by a stronger reversal. From 05:45 UTC onward, the ICP price began climbing inside an upward channel, with the price reaching a peak at $4.95 by 07:00 UTC. This bullish push was backed by multiple golden crosses on the MACD and RSI rising above 70, signaling an overbought condition and potential pause. Post 07:30 UTC, ICP saw a mild pullback, cooling off near $4.90. At the time of writing, the price is around $4.85, stabilizing after its strong recovery.
ICP Token Remains Cautious Amid Mixed Signals
The current outlook for the ICP token remains neutral to slightly bullish, with price action showing signs of slowing momentum after a volatile session. The recent ICP breakout and upward channel suggest bullish interest, but the failure to hold above $4.95 resistance points to lingering selling pressure. Indicators like the MACD are flattening out, and RSI has pulled back from overbought levels, indicating a possible cooldown phase ahead.
For traders, the $4.80 support remains a key level; holding above it could maintain the structure for another leg higher. However, a shift back to the previous trading range or even a deeper correction can’t be ruled out. On the flip side, reclaiming $4.95 and pushing above it with volume could confirm a renewed breakout attempt. Until then, ICP Price may continue to consolidate as the market waits for a clearer direction.
Internet Computer (ICP) Price Analysis for June 6, 2025
The ICP price analysis shows a well-structured market pattern that started with a sideways movement, transitioned into a strong uptrend, and finally settled into consolidation after a breakout failed to sustain momentum. The session opened with ICP trading inside a tight trading range between $4.88 and $4.91, showing low volatility and very little price movement by 01:45 UTC.
Around 01:50 UTC, the ICP trend began to shift. Buyers stepped in and pushed the price upward, breaking out of the range. From 02:00 to 03:00 UTC, ICP formed a clear uptrend, climbing steadily and breaking above $4.93. A MACD golden cross printed just before 02:30 UTC, confirming bullish momentum, while RSI touched overbought territory for the first time near 02:40 UTC, showing strong buyer pressure.
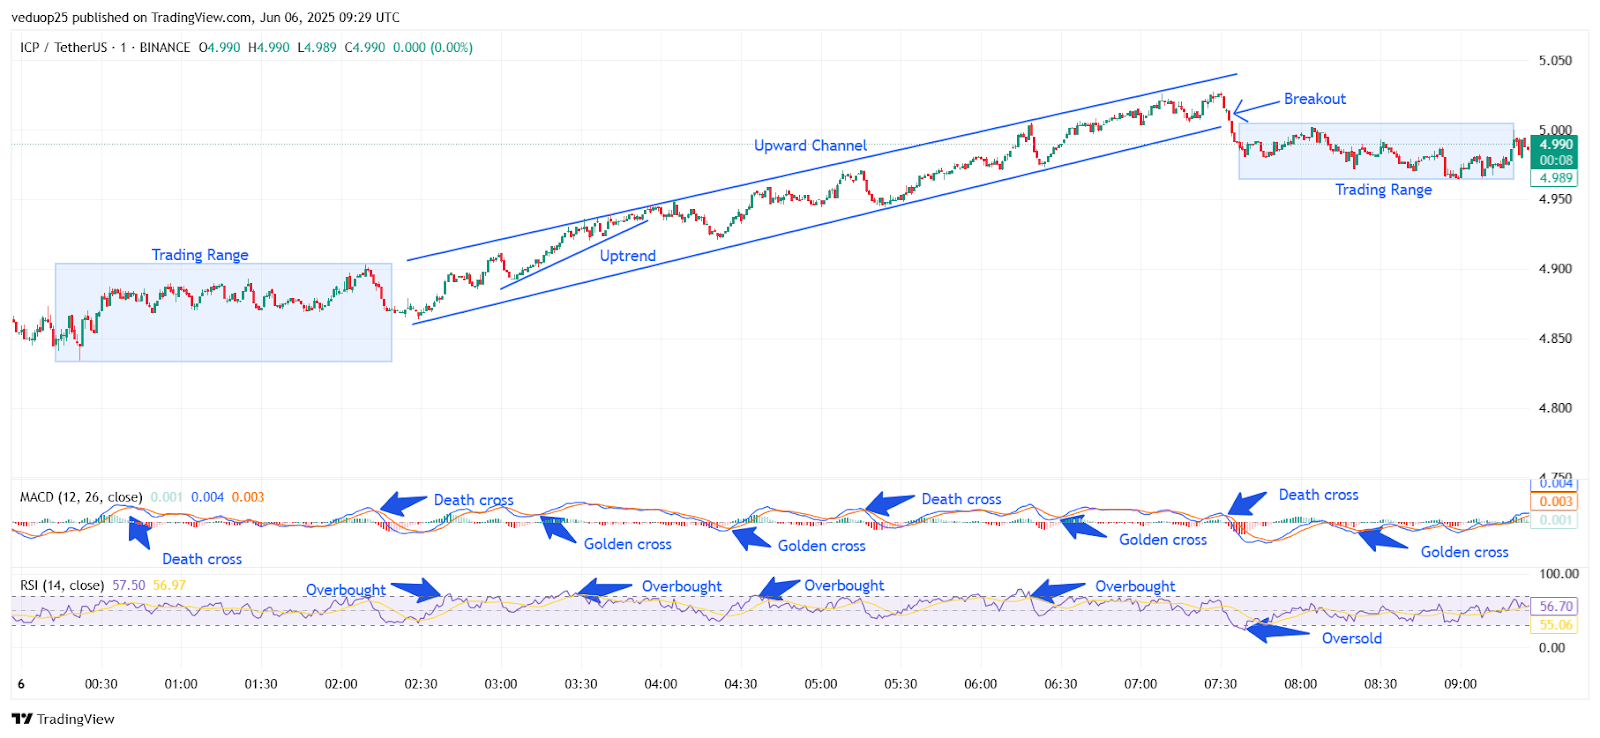
Chart 3- ICP/USDT M1 Chart, Analysed By Anushri Varshney, Published on TradingView, June 6, 2025
From 03:00 to 05:45 UTC, the uptrend turned into a full upward channel, with ICP price moving smoothly between support and resistance lines. Price steadily rose from $4.94 to a peak of around $5.04, marking the high of the day. During this stretch, multiple RSI overbought readings were seen, and another MACD golden cross reinforced the strength of the ICP trend. Despite minor pullbacks, buyers maintained control for nearly two hours.
ICP Price Falls Below $5.00 After Hitting $5.04 High
However, at around 05:50 UTC, the trend began to fade. A MACD death cross occurred, and ICP failed to make new highs. The price began to retreat and slipped out of the channel by 06:10 UTC, signaling exhaustion in bullish momentum. This marked the beginning of a cool-off phase. From 06:15 UTC to 09:00 UTC, ICP again moved sideways, creating a second trading range between $4.96 and $5.00. Momentum indicators reflected this shift.
RSI dropped from overbought levels and briefly touched the oversold zone near 08:00 UTC, while MACD flipped between minor golden and death crosses without strong follow-through. The ICP price settled at $4.99, locking most of its earlier gains. Although the ICP breakout above $5.00 was not sustained, the broader ICP trend remains bullish due to higher lows and continued interest from buyers during dips. If momentum returns, another ICP breakout above $5.04 could set up the next move.
ICP Price Eyes For Next Breakout
The overall price action for ICP today reveals a healthy market structure backed by clear momentum shifts. After a quiet start within a tight trading range, the ICP price broke out and rallied inside a strong upward channel, signaling renewed buying interest. The multiple golden crosses and overbought RSI readings confirmed the bullish strength until exhaustion set in near the $5.04 mark. Despite the failure to hold above that resistance, the correction that followed was controlled, with no sharp sell-off.
The ICP trend remains positive, with the price managing to hold support above $4.95 through the final hours of the session. The current consolidation phase hints at a potential setup for another leg higher if momentum revives. With strong technical levels now clearly defined, traders will be watching closely for a decisive ICP breakout above $5.04 to confirm a continuation of the broader uptrend heading into the next session.
ICP Price Analysis For June 12, 2025
The ICP price analysis shows a choppy structure marked by repeated downward channels, brief rebounds, and strong resistance near $6.00. The day started with a sharp correction. By 00:30 UTC, the ICP price dropped fast from $6.16 to $5.95, forming a steep downward channel. RSI hit oversold, and MACD gave a golden cross, hinting at a minor reversal ahead. Between 00:45 and 03:15 UTC, the chart moved into a sideways ICP trend, forming a narrow trading range between $5.95 and $6.05.
This range showed three quick golden crosses on the MACD but lacked real momentum. A short-lived death cross at 03:15 UTC signaled fading bullish energy. A new downward move began at 03:45 UTC. The price slipped again from $6.05 to $5.88 by 04:30 UTC, breaking out of the range into another bearish leg. RSI touched deep oversold, while MACD flipped bullish with a clean golden cross near 04:45 UTC.
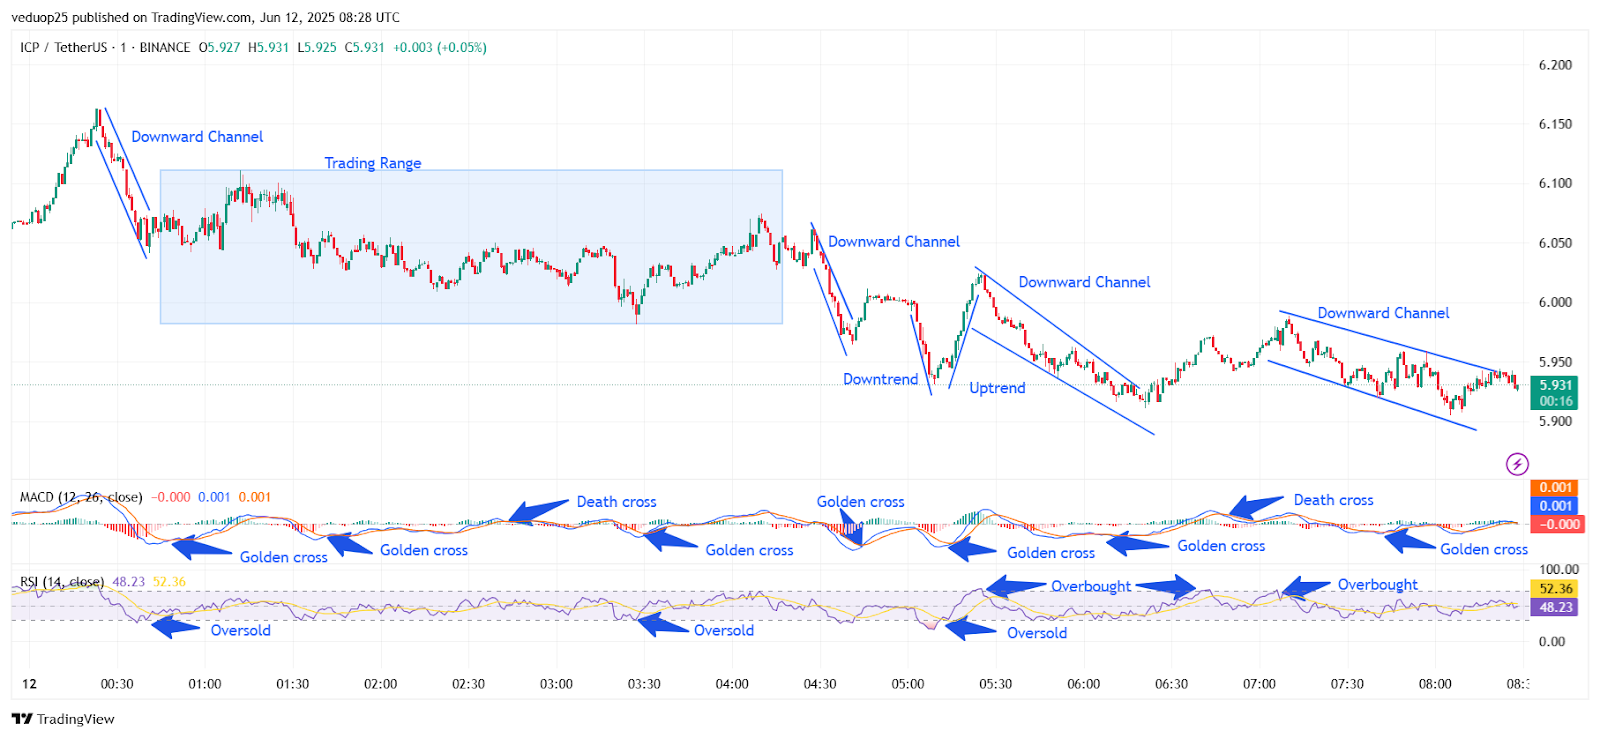
Chart 4- ICP/USDT M1 Chart, Analysed By Anushri Varshney, Published on TradingView, June 12, 2025
From 04:45 to 05:15 UTC, the price climbed back up to $6.02. This was the strongest upward leg of the session, but it faded quickly. By 05:30 UTC, another downward channel took shape. The ICP price declined gradually from $6.02 to $5.91 by 06:15 UTC. RSI dipped below 30 again, and MACD gave two golden crosses but with limited follow-through.
ICP Breakout Fails at $6.00 as Downtrend Resumes
Between 06:30 and 07:00 UTC, bulls made another comeback. The chart showed a small ICP breakout as the price spiked to $6.00. RSI briefly hit overbought, and MACD remained flat after an earlier golden cross. But this breakout failed to continue. At 07:15 UTC, a fresh death cross on MACD dragged the price back below $6.00. From 07:30 to 08:15 UTC, the final downward channel formed. Price fell from $6.00 to $5.91 again, creating lower highs. The session ended with a mild bounce, closing near $5.93.
The ICP trend remains weak with multiple downward channels and short recoveries. Every ICP breakout attempt failed near $6.00, showing strong resistance. RSI kept flipping between oversold and overbought, while MACD signals remained choppy. If the ICP price fails to break above $6.00 soon, further downside pressure could return. Bulls must flip that level into support to shift momentum upward.
ICP Trend Faces Resistance Becomes Key Level
The current ICP trend shows consistent weakness despite multiple intraday recovery attempts. The price spent most of the day inside downward channels and short-lived upswings, but none of the ICP breakout attempts managed to hold above the $6.00 resistance. RSI frequently touched both oversold and overbought levels, reflecting indecision. MACD produced several golden crosses, but most lacked strength or follow-through. The ICP price is now trading near $5.93, slightly off the session lows, but still within a bearish short-term structure.
If bulls fail to reclaim $6.00 in the next session, further downside to $5.85 remains likely. However, a strong push above $6.00 with volume could flip the ICP trend in favor of buyers and trigger a fresh breakout. For now, caution dominates, and momentum favors sellers unless a clear reversal develops. Traders should closely watch MACD and RSI for early cues on the next move.


