
Are you contemplating an investment in INJ and seeking a well-rounded, data-driven perspective before making your next move? This INJ price-analysis report is set up for you with extensive coverage of the current price movements, key support resistance levels, and the momentum indicators. Whichever way you’re looking, be it to open a new position or to adjust the current one, the following interpretation should give you a well-founded basis for confidently stepping into the market. Get acquainted with the technicalities and dismantle prospects on price direction for Injective and the possible implications that an INJ breakout will have on your perspective.
INJ Price Analysis Of May 3, 2025
Injective has shown significant price fluctuations over the past trading session. The coin opened trading above $9.85 and quickly climbed inside an upward channel, peaking around $10.70 and then subsequently reversing. After that, a downward channel was formed, which led the INJ Price to move lower. The MACD flashed a death cross around 02:55 UTC, marking the descent into the downward trend. Previously, the RSI had touched overbought territory, thus confirming the chances of a pullback.

Chart 1-INJ/USDT M5 Chart, Analysed By Anushri Varshney, Published on TradingView, May 3, 2025
The Injective Price retraced towards $10, after which it consolidated. From 06:00 UTC, a broad range was established between the $10.60 resistance and the $9.80 support. Many golden crosses formed around 08:10 and 14:30 UTC, suggesting temporary bullish attempts, but all were capped at maximum ranges. Meanwhile, the RSI oscillated around neutral zones which indicates indecisiveness of momentum. The INJ Breakout attempt has not sustained above the resistance.
Injective Struggles Below $10.40 as Bearish Pressure Mounts
Between 15:00 and 21:00 UTC, bearish sentiment resumed. Another death cross was indicated at 17:45 UTC. The RSI also noted brief overbought periods followed by dips in oversold values at 20:50 UTC. In essence, each bounce failed to cross above $10.40 signifying that it gave an unfinished bullish assertiveness and a bolstering bearish drag. The Injective Price fell back close to the mark of $9.88, temporarily finding the level of support there.
INJ Trades Sideways After Support Retest Today
Today, the Injective Price hovered around $9.88 after retesting a key support zone. The INJ chart showed repeated RSI oversold signals between 03:00 and 08:00 UTC, indicating weak bullish attempts. A golden cross was formed at 08:30 UTC, which moved the INJ a bit up; however, it was feeble. The MACD remained flat, confirming weak momentum. The price remains subdued below $10 with no breakouts. An INJ breakout is contingent upon reclaiming the $10.40 level. Until then, prices will mostly move sideways. The RSI recovered a bit but remains neutral. The Injective price could continue to oscillate between the $9.80 support and the $10.40 resistance for the short term unless supported by good volume and momentum.
Injective Fails to Reclaim Momentum – Is a Deeper Pullback Coming?
As of now, the Injective Price looks weak from a technical perspective. The price stood mildly near the $9.88 support level for hours and made several unsuccessful attempts to secure an uptrend above $10.40. The transient golden crosses and the oversold levels on the RSI indicated a minor recovery. MACD is showing a sideways movement with RSI fluctuating within the neutral to oversold zones. In the absence of a clear break and sustain above $10.40 by the INJ Price, the chances for upside seem limited. If the current support level fails, chances are good for downwards towards $9.70 or even lower. For now, any INJ Breakout would require strong volume and a concrete thrust beyond resistance. Until then, the coin could remain range-bound with bears being favored. Traders are advised to be cautious, as the midterm outlook remains bearish. A confirmed bullish revival will only be possible if INJ prints higher lows from here and convincingly breaks out of the current trading range.
Injective (INJ) Price Analysis For May 7, 2025
INJ started the day under pressure. From the $9.40 zone, sellers pushed the pair lower inside a steady downward channel, forming lower highs through the early morning. MACD flashed a death cross, and RSI dropped into oversold, signaling that selling might be stretched. This price drop slowed near $8.82, where INJ Coin found support. A bounce from the lows led to a breakout from the channel, but instead of running, the price moved sideways. From 13:00 to 20:00 UTC, the Injective Price stayed between $9.00 and $9.30. This trading range showed a temporary balance between buyers and sellers. MACD flipped back and forth with little direction. RSI hovered near neutral.
The momentum shifted around 20:30 UTC, and INJ finally pushed above $9.47, breaking out of the range and building an upward channel. This breakout came with a MACD golden cross and a push in RSI above 50. Buyers regained control, but caution is needed. RSI is near overbought levels. Price moved steadily from $9.30 to $9.40 through the night, printing higher highs with each move. A quick pullback hit around 03:00 UTC, but support held near the lower channel line. MACD dipped briefly, and RSI touched oversold again, a strong signal that bulls were still in the limits.

Chart 2-INJ/USDT M5 Chart, Analysed By Anushri Varshney, Published on TradingView, May 7, 2025
Around 09:00 UTC, INJ Coin is trading near $9.66, testing the previous resistance. RSI is now near 76, showing overbought conditions; the upside might slow without a breather. Still, the structure looks clean. The Injective price remains inside the upward channel, and each pullback fails to breach the trading level. If $9.70 breaks, the next psychological target is $10. On the flip side, failure to break resistance may lead to a retest of $9.30 or the lower trendline.
INJ Reclaims Momentum After Overnight Breakout
Today, INJ Price is trading near $9.66 after a clean breakout from the $9.30 range. Overnight, Injective Price formed an upward channel, recovering from a sharp dip to $8.82. MACD has flipped bullish again, and RSI is overbought at 76, showing strong momentum. INJ Coin now faces resistance at $9.47. A breakout above this level could trigger a push toward $10. However, overbought conditions may lead to a short-term pullback. The support level is at $9.40, holding the bulls in control as long as the price holds within the rising channel.
Bulls Take Charge as INJ Approaches Resistance
Injective showed a strong shift in momentum after reclaiming support at $8.82 and breaking out of both a downward channel and a sideways range. The current upward channel is holding well, with steadily higher lows and clean follow-through on breakouts. INJ Coin now trades near $9.66, just below the $9.70 resistance level that has capped price action in the past. RSI is sitting around 76, indicating that the rally may need a breather soon. Still, MACD remains positive, and the trend structure supports more upside.
If injective price breaks above $9.70 with volume, we could see a fast move toward $10. On the downside, $9.40 and $9.30 remain solid support zones. The market will remain bullish until the INJ price stays above those levels. Traders may want to watch for a breakout above resistance or a dip to re-enter the market.
Injective (INJ) Price Analysis For May 14, 2025
The INJ Price analysis over the last 24 hours shows a complete trend cycle with clear movements between selling pressure, recovery, and tight-range consolidation. INJ Coin started the session around $13.70 and dropped sharply between 01:00 and 05:00 UTC. The price moved inside a downward channel, falling toward $13.00. During this phase, RSI reached oversold territory, and a golden cross appeared on the MACD near 05:15 UTC, signaling the beginning of recovery.
From 05:15 to 08:30 UTC, Injective began to move within an upward channel. Buyers gradually entered the market, pushing the price to $13.50. Between 08:30 and 12:00 UTC, INJ Price traded sideways, forming a tight range. A MACD death cross developed around 11:45 UTC, and the price dropped slightly to $13.30 before stabilizing. The downtrend didn’t last long. A fresh uptrend began near 13:00 UTC as INJ bounced from $13.30. Buyers gained control, and by 16:30 UTC, the price had cleared the $14.00 mark.
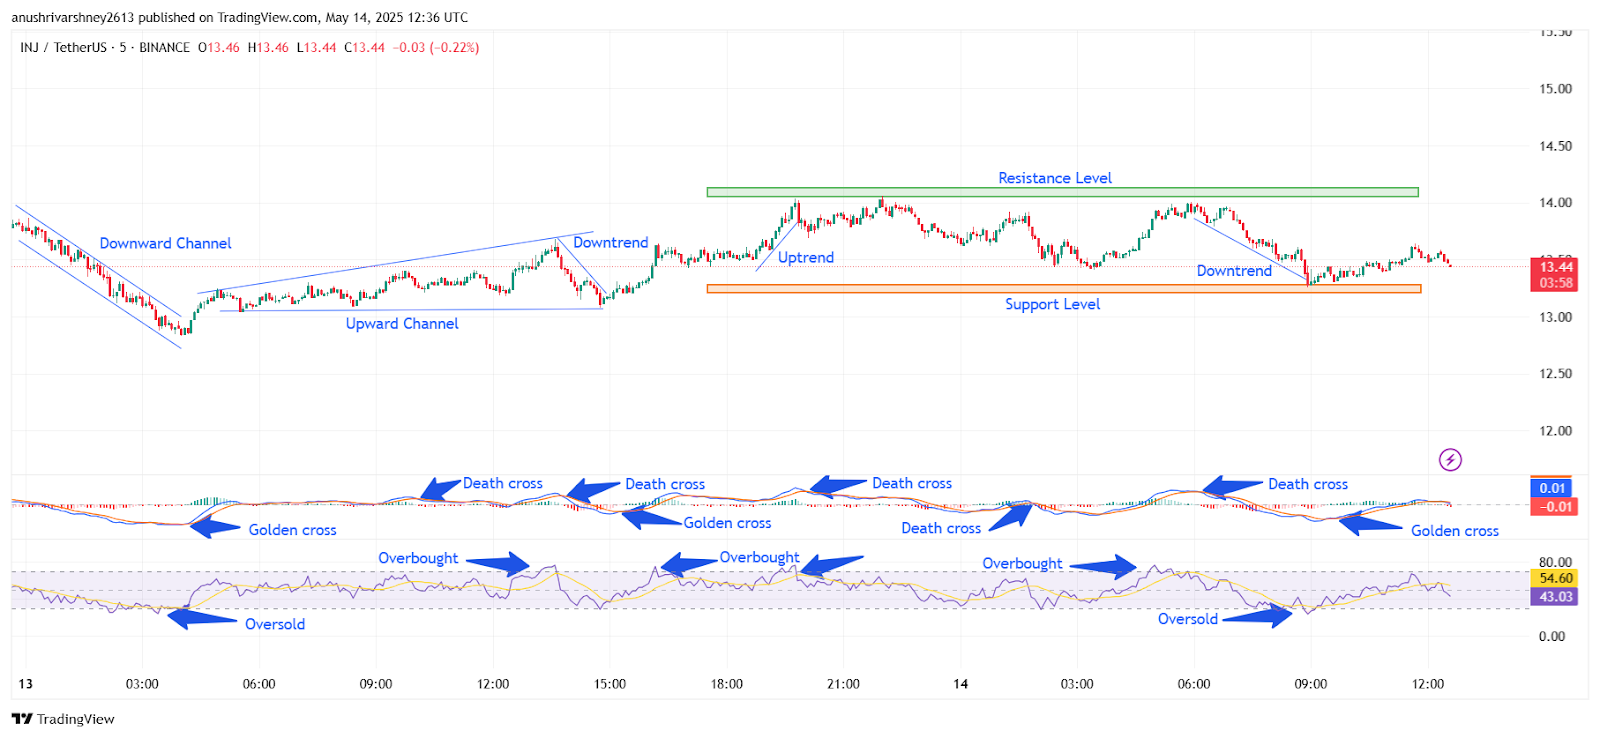
Chart 3- INJ/USDT M5 Chart, Analysed By Anushri Varshney, Published on TradingView, May 14, 2025
RSI touched the overbought zone near 17:00 UTC, and a golden cross appeared on the MACD, indicating bullish momentum. From 18:00 to 22:00 UTC, the Injective Price traded close to $14.40 resistance. A downtrend formed after 22:00 UTC, confirmed by a death cross on the MACD near 22:30 UTC. Price reversed lower, and RSI began to cool down from overbought levels. Between 23:00 UTC and 05:30 UTC, the INJ Price declined steadily, testing key support at $13.25. RSI moved back into oversold territory. The zone held firm, and a slight recovery followed.
INJ Price Stays Range-Bound as Bulls Struggle Near $13.60
The INJ Price traded within a narrow range today, showing limited momentum after yesterday’s decline. Starting near $13.40, the Injective Price briefly climbed to $13.60 around 06:00 UTC but faced resistance. Sellers pushed it back below $13.50 by mid-morning. The RSI stayed flat between 45 and 55 most of the day, signaling weak momentum. A minor golden cross appeared on the MACD near 08:30 UTC but lacked follow-through. From 10:00 UTC onward, the INJ Coin moved sideways between $13.40 and $13.50, failing to build trend strength. No breakout attempts occurred, and volume remained low.
INJ Holds Support, But Momentum Remains Weak
The Injective Price continues to hover near its lower range, with no strong signs of reversal yet. Support near $13.25 remains a key level, having held firm through recent pullbacks. Despite small bullish signals like golden crosses, the INJ Coin has struggled to generate upside momentum. Today’s price action reflects uncertainty, as buyers remain cautious and sellers are not aggressive. The RSI staying neutral and the MACD showing weak signals suggest consolidation. Unless price breaks above $13.60 with strong volume, the INJ Price may continue moving sideways. Traders will likely wait for a clear push beyond the current range before acting. Looking ahead, a decisive break above $13.60 could shift short-term momentum. If not, continued stagnation around the $13.25 level may lead to further consolidation or even a breakdown.
Injective (INJ) Price Analysis For June 17, 2025
The INJ price analysis highlighted a mix of clean breakouts, minor recoveries, and bearish exhaustion by the end of the session. The day started with a steep drop. Between 00:00 and 00:15 UTC, the INJ Coin broke into a sharp downward channel. Price fell from $11.38 to $11.18. RSI moved into oversold, and no strong buying pressure was seen. From 00:15 to 00:45 UTC, a quick recovery began. The Injective Price reversed inside a clean upward channel and pushed back to $11.48.
RSI climbed above 70, and MACD gave two golden crosses, confirming strong buyer momentum. But this move didn’t hold for long. At 01:00 UTC, a fresh downward channel began. Price slipped slowly from $11.48 to $11.28 over the next 90 minutes. The RSI hovered below 50, and a death cross appeared on the MACD around 01:45 UTC. The trend stayed weak until 02:30 UTC.
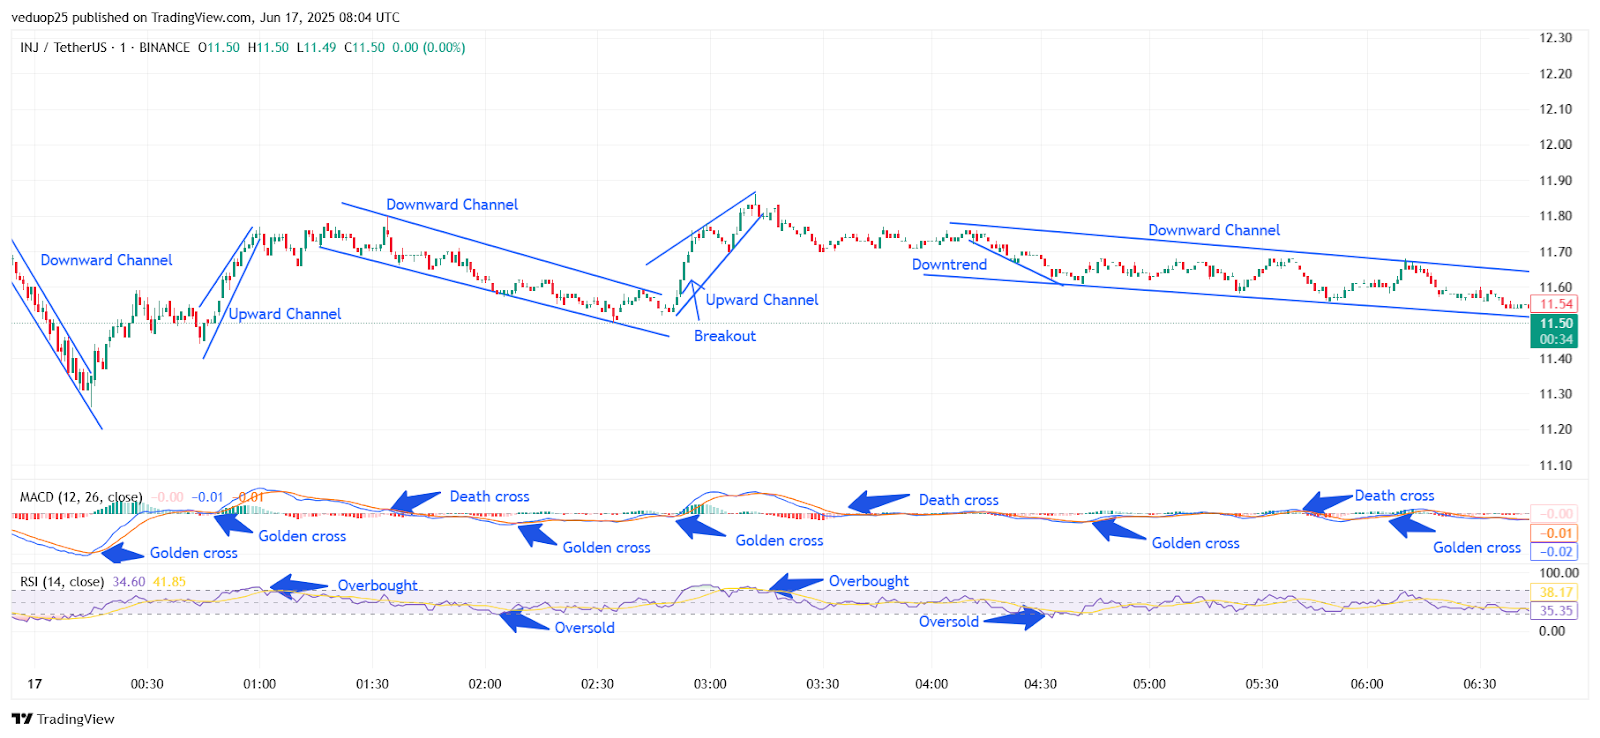
Chart 4- INJ/USDT M1 Chart, Analysed By Anushri Varshney, Published on TradingView, June 17, 2025
By 02:30 UTC, a clear INJ breakout formed. Price surged from $11.28 to $11.65 inside a steep rising channel. This was the strongest leg of the day. RSI touched overbought again, and MACD flashed golden crosses confirming new bullish control. But once again, the breakout lost strength quickly.
INJ Coin Slides Back as Bullish Momentum Fades Below Resistance
From 03:15 to 04:15 UTC, price action turned flat. INJ coin hovered around $11.58 without a clear trend. At 04:15 UTC, a new downtrend started. The price dropped to $11.46 by 04:45 UTC, with RSI slipping back near being oversold. MACD showed another death cross as momentum faded. Between 05:00 and 06:30 UTC, the Injective Price moved inside a wide downward channel. Prices ranged between $11.50 and $11.66 but failed to break resistance.
RSI stayed below 40 for most of this stretch, while MACD printed minor golden and death crosses with no direction. As the session neared its end, bearish signs returned. By 06:45 UTC, the INJ Price dropped back to $11.50. RSI held weak, and MACD turned flat. Sellers kept control as no strong reversal formed. Until price escapes the downward channel clearly, the short-term Injective Price outlook remains weak.
Injective Price Stalls After Multiple Breakouts
The trading session of INJ Coin was marked by multiple breakout attempts that failed to hold. Early bullish momentum pushed the Injective Price from oversold zones back toward $11.65, but each rally faced rejection at key resistance levels. The RSI repeatedly touched overbought, only to fall below 40 soon after. MACD also showed inconsistent signals—golden crosses followed by quick death crosses, highlighting indecision in the trend.
At the end of the session, the INJ price returned to $11.50 and has found support in a downward-leveraging price channel, indicating seller pressure is evident. Although there are temporary gains on the INJ, the bulls were not able to create sustained upward momentum above $11.60. The bears held the upper hand as there is no sign of trend continuation until the price breaks $11.60 with volume. The structure is uncertain, and traders should watch for a clean break above $11.70 to confirm a bullish conviction. At the moment, INJ Coin is bearish in the short term, and upside pressure is fading.


