

Are you thinking about where JASMY might head next after that sharp move? This JASMY price analysis walks you through the recent chart action and the signals hiding in the indicators. Whether you’re holding through the dip or just scouting for an entry point, we break it down using real technical clues like RSI and MACD. Let’s look at what the price did over the past 24 hours and what that could mean for the short-term outlook ahead.
JASMY Price Analysis of May 5th, 2025
The JASMY price action over the last 24 hours shows a complex mix of short-term trends, including a broad sideways structure followed by a sharp sell-off. During the first few hours (12:12–15:12 UTC), Jasmycoin price attempted to rebound from prior lows but failed to break the $0.01595 mark cleanly. Between 15:12 and 18:12 UTC, a more decisive uptrend formed, breaking above $0.01600 and reaching $0.01614 by 18:30 UTC. MACD showed a bullish crossover in this stretch, and RSI neared overbought territory, indicating rising momentum, though not sustained long enough to set a trend.

Chart 1 – JASMY/USDT M5 Chart, Analyzed by Alokkp0608, published on May 5th, 2025.
Between 18:12 and 21:12 UTC, after testing resistance around $0.01614, JASMY reversed sharply. Sellers stepped in near the $0.01620 rejection zone, a key resistance level previously confirmed by earlier price peaks. RSI fell quickly from overbought conditions, confirming exhaustion. MACD turned sideways and then produced a death cross shortly after 20:30 UTC, signaling weakening bullish momentum. Price slipped into a choppy range between $0.01575 and $0.01600 by the end of this segment, unable to regain strength for another breakout.
Shifting Momentum and Failed Breakouts
From 21:12 UTC on May 4 to 00:12 UTC on May 5, the asset stayed confined within a sideways path before collapsing into a steep downtrend that dominated the 00:12–03:12 UTC interval. Price bottomed at $0.01550 after hitting a support level that held steady through multiple prior dips. RSI entered oversold territory and remained there briefly, while the MACD registered a death cross just before the decline. The structure turned bearish but showed signs of resilience as buyers defended the $0.01550 zone with multiple wick rejections around 01:45 UTC.
The bounce came between 03:12 and 06:12 UTC, with JASMY price climbing back to $0.01600 by 05:55 UTC. This sharp rally occurred with RSI rebounding from oversold to mid-range, and MACD flashing a golden cross, though weak volume suggested the move lacked strong conviction. The price met resistance near the earlier rejection zone, forming a potential double-top structure. Despite the recovery, this zone proved difficult to breach again, and downward pressure soon returned in the next price phase.
Breakdown and Bearish Extension
From 06:12 UTC until the chart’s end at 12:12 UTC, Jasmycoin price entered another downtrend, sliding from $0.01595 to below the key support of $0.01550. This marked a bearish breakdown as the price moved outside the previously respected range. RSI once again entered oversold territory around 11:30 UTC, while MACD flipped into a bearish crossover, confirming a deepening of downside momentum. The price pierced below $0.01550 briefly, which may turn into a lower resistance if follow-through selling continues into the next session. Bears have clearly taken control in this stretch.
Trend Weakens as Support Cracks
JASMY price appears to be entering a short-term bearish phase as it breaks beneath the important $0.01550 support level. Momentum has shifted decisively to the downside, confirmed by a bearish MACD crossover and RSI repeatedly dipping into oversold territory without a strong recovery. If the price fails to reclaim $0.01560–$0.01575 quickly, it risks falling toward $0.01520 or lower. A push back above $0.01600 could invalidate this bearish setup and reopen the door for range-bound action. For now, caution prevails as downward pressure dominates, and bulls need a strong catalyst to reverse sentiment.
JASMY Price Analysis of May 9th, 2025
The JASMY price action over the last 24 hours shows a gradual yet decisive bullish trend, beginning with a breakout above the key $0.0168 level by 15:20 UTC. This upward momentum initiated a steady climb inside a well-defined ascending channel, marked by higher lows and consistent buying pressure. During the late hours of May 8, Jasmycoin price action respected both channel boundaries and continued to build toward a critical resistance zone. RSI entered overbought territory twice before midnight, signaling buyer enthusiasm, while MACD confirmed this direction with a golden cross near 21:00 UTC. This bullish alignment laid the groundwork for a strong push into the resistance zone by early May 9.

Chart 2- JASMY/USDT M5 Chart, Analyzed by Alokkp0608, published on May 9th, 2025.
As May 9 began, bullish control remained firm. The JASMY price gradually advanced toward the $0.0187 resistance level, confirming the uptrend structure. The channel support around $0.0176 continued to hold through each test, establishing a clear upward trajectory. Between 00:00 and 06:00 UTC, RSI hovered near or above overbought readings multiple times, coinciding with MACD’s bullish stance and signal line alignment. A golden cross shortly before 03:00 UTC further fueled upward pressure. This combination of technical confirmation and consistent volume buildup made the resistance breakout attempt at 07:15 highly plausible. Momentum was clearly in favor of the bulls at this stage.
Failed Breakout Sparks Short-Term Reversal
The JASMY breakout above $0.0187 around 07:15 UTC briefly lifted prices to a peak of $0.0193. However, this move turned into a fake breakout as the price failed to hold above resistance. A sharp rejection followed, dragging the price back to $0.0181 by 09:25 UTC. RSI, which had been in overbought territory, swiftly declined, reflecting the cooling momentum. MACD also printed a bearish death cross near 09:15 UTC, signaling weakening buying strength. The failed JASMY breakout indicated that the resistance near $0.0187 remains structurally intact, and bulls lacked the volume strength to sustain movement above that level.
Despite the rejection, buyers quickly re-entered. From the dip near $0.0181, the price began to recover modestly. Between 09:30 and 11:30 UTC, JASMY formed higher lows once again, suggesting renewed but cautious bullish activity. RSI recovered above the midline, signaling stabilization after the sharp correction. The MACD histogram also began to shift from red to green, hinting at a potential momentum turnaround. Price hovered around $0.0186–$0.0187, testing the resistance zone again but without clear conviction. Overall, momentum has slowed, but buyers are still active at higher support levels near $0.0181.
Consolidation Near Resistance After Breakout Retest
In the most recent 3-hour stretch, JASMY price showed signs of consolidating below its key resistance. After recovering from the $0.0181 dip, the price stabilized near $0.0187. No clear JASMY breakout or breakdown occurred in this interval, and volatility dropped noticeably. RSI hovered slightly above neutral without overbought signals, indicating a balance between bulls and bears. MACD lines converged again, showing no clear trend dominance, but with a slight bullish bias. This quiet phase reflects market indecision after earlier volatility and may precede a breakout or renewed correction, depending on incoming volume and broader sentiment.
JASMY Bulls Eye Another Breakout But Face Resistance Hurdle
The recent Jasmycoin price action points to a bullish setup that failed to sustain above resistance but remains structurally intact. Momentum is still leaning bullish, though fading after the fake breakout. Support at $0.0181 remains key for short-term buyers, while $0.0187 acts as immediate resistance. A clean break above $0.0193 could trigger a new wave toward $0.0198 or higher, but failure to reclaim $0.0187 convincingly may lead to a pullback. RSI reflects partial recovery from overbought levels, and MACD suggests a potential bullish crossover. The next sessions will likely decide whether consolidation turns into another breakout or deeper retracement.
JASMY Price Analysis of May 24th, 2025
The JASMY price action today, from the start of trading to 12:15 UTC, shows an early rally out of the support zone at $0.01740, where the price formed a strong higher low (HL) around 02:00 UTC. This set off a bullish run that broke above the resistance level of $0.01775 by 03:18 UTC. A rising channel formed between 02:00 and 04:20 UTC, with the price reaching a short-term high near $0.01795. RSI entered the overbought region around 03:40 UTC, confirming momentum behind the push. The MACD also triggered a golden cross at 02:04 UTC, supporting a bullish bias during this surge.
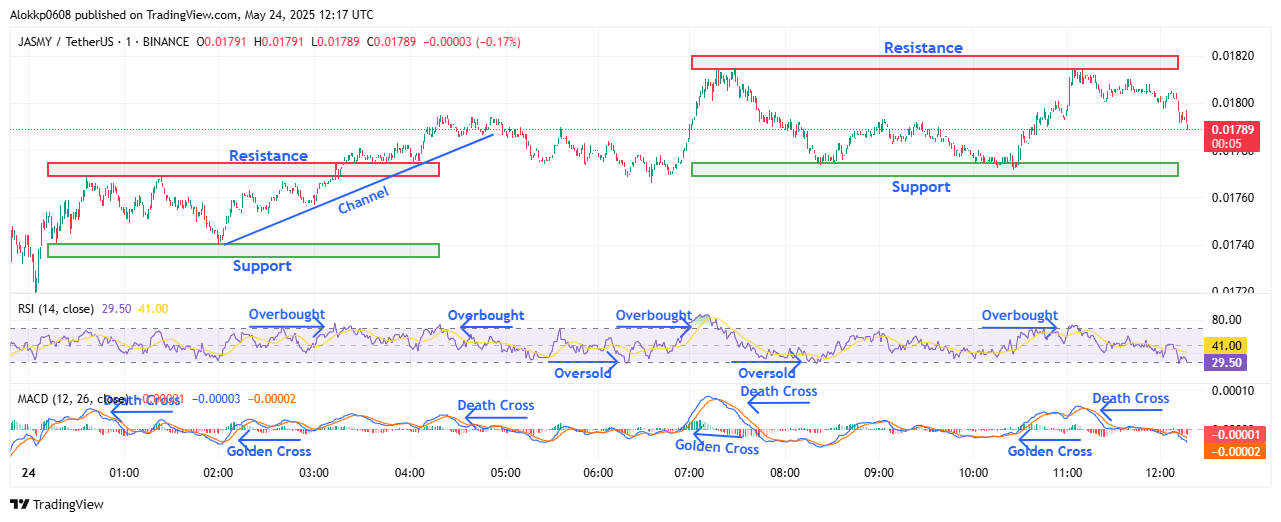
JASMY/USDT M-1 Chart, Analyzed by Alokkp0608, published on May 24th, 2025.
Following the initial rally, JASMY price entered a sideways phase between 04:20 and 06:30 UTC, hovering just below $0.01790. The structure held steady with minor fluctuations, but momentum started to fade. A death cross on the MACD at 04:25 UTC signaled weakening strength. RSI stayed neutral but bounced off the midline twice, suggesting consolidation rather than breakdown. However, by 06:30 UTC, the price dipped toward $0.01766, marking a lower low (LL) from earlier. This pullback was brief, followed by a renewed push upward triggered by a MACD golden cross at 06:48 UTC.
Buyers Step In at Key Support, Retest Upper Resistance
From 06:30 to 08:20 UTC, JASMY price quickly reversed and surged toward a new high of $0.01815 by 07:20 UTC, marking a higher high (HH). This move was sharp and faced immediate resistance at that level, where the price was rejected. RSI once again entered overbought territory, reinforcing that this was an overheated test of resistance. A death cross on MACD at 07:17 UTC confirmed loss of bullish momentum just as the price began to drop. Notably, the previous JASMY resistance of $0.01775 acted as new support, with the price testing it as a support level around 08:20 UTC.
Between 08:20 and 10:28 UTC, the JAMSY price hovered tightly above $0.01775, forming a support zone between $0.01770 and $0.01775. This consolidation period formed higher lows, indicating mild bullish accumulation. RSI remained mostly neutral in this period, while MACD stayed flat until a golden cross occurred at 10:28 UTC. This triggered a moderate rally, pushing the price again toward the upper resistance zone at $0.01815. The move was not as strong as the earlier rally, with RSI only briefly touching overbought around 11:00 UTC, signaling less conviction.
Rejection at $0.01815 Halts Rally Attempt
From 11:00 to 12:15 UTC, JASMY price once again faced rejection at the $0.01815 resistance line, forming a clear double top around this level. Price action rolled over slightly, forming a lower high (LH) and slipping to $0.01789 by the close. The MACD showed a fresh death cross just before the decline, and RSI fell from overbought to neutral in tandem. This signals weakening bullish pressure and a lack of follow-through above resistance. The latest price action sets $0.01815 as a strong resistance level to overcome in the next session. Support remains well-defined in the $0.01770–$0.01775 zone.
JASMY Momentum Fades as Resistance Holds at $0.01815
Jasmycoin price ends today’s session with momentum cooling after a second rejection at the $0.01815 resistance. The short-term outlook is neutral-to-bearish unless bulls reclaim that level with volume. Immediate support lies in the $0.01770–$0.01775 zone, followed by $0.01740 as the next key support if a breakdown occurs. JAMSY Resistance is firm at $0.01815, with interim resistance at $0.01795. MACD’s most recent death cross hints at fading momentum, while RSI has dropped from overbought to neutral. If RSI continues lower and price breaches support, further downside toward $0.01740 is likely. Bulls need a fresh MACD crossover and volume above $0.01815 to regain control.
JASMY Price Analysis of June 12th, 2025
The JASMY price action today shows a sharp early drop followed by volatile sideways movement within a tightening range. Price opened near the $0.01464 level and immediately entered a strong downtrend. By 00:59 UTC, a MACD death cross aligned with a breakdown through the $0.01435 support. The move accelerated, confirming lower lows (LLs) and lower highs (LHs) as JASMY fell toward the $0.01400 zone. A temporary bounce at 01:42 UTC was rejected near $0.01450, forming another LH. RSI dipped into oversold territory around this time, but momentum failed to reverse, keeping bears in control.
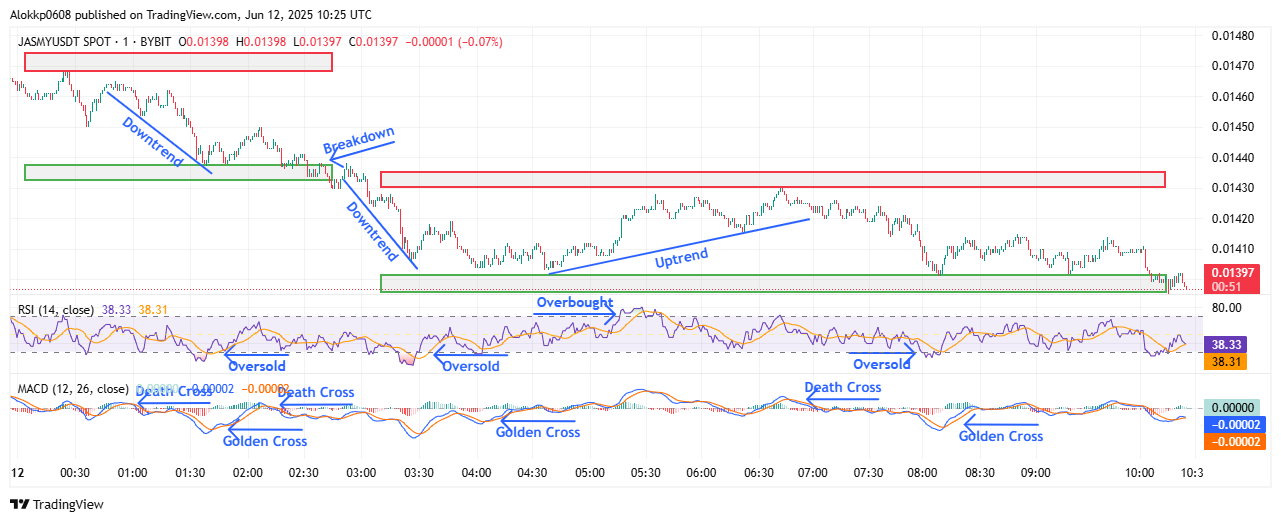
JASMY/USDT M-1 Chart, Analyzed by Alokkp0608, published on TradingView, June 12th, 2025.
Between 02:00 UTC and 04:00 UTC, the Jasmycoin price continued in a downward channel, eventually bottoming at $0.01404 by 04:00 UTC. This area aligned with a newly established support level at $0.01400, where bullish pressure began to build. The MACD golden cross at 04:04 UTC and RSI rebounding from oversold hinted at short-term bullish reversal potential. From there, prices started to shift upward, forming a clear higher low (HL) and entering an early uptrend structure by 04:40 UTC. Still, buyers remained cautious, facing strong resistance near the $0.01430 level, the earlier breakdown point.
JASMY Breakout Attempt Meets Resistance
From 04:40 UTC to 06:45 UTC, JASMY price made an earnest attempt at reclaiming lost ground. The uptrend strengthened with a series of higher highs and higher lows, and MACD confirmed the trend with a sustained bullish crossover. RSI briefly entered the overbought zone near 05:30 UTC as price tested the $0.01430 resistance zone. However, this level proved resilient, rejecting price advances at multiple attempts. By 06:43 UTC, bearish pressure returned, coinciding with a MACD death cross at 06:48 UTC. This marked a key pivot, suggesting fading bullish momentum and the start of another leg down.
Between 06:50 UTC and 08:10 UTC, the JASMY price action lost its upward momentum and returned to test the $0.01400 support. The structure printed another LH around $0.01415, indicating renewed bearish strength. RSI cooled off toward neutral while MACD rolled over, confirming downside bias. But the support held, once again, buyers defended the $0.01400 level. At 08:11 UTC, a golden cross on MACD helped launch a short-lived rally, but this move lacked follow-through. Resistance at $0.01415–$0.01420 capped upside attempts, forming a choppy sideways range.
JASMY Final Rejection From $0.01415 Level
From 08:15 UTC to the close at 10:24 UTC, JASMY drifted lower again after another rejection from the $0.01415 area. The price failed to make higher highs and instead kept printing minor LHs, turning the structure into a tightening bearish bias. MACD flattened while the RSI hovered in the lower 40s range, showing a lack of strength. By 10:00 UTC, JASMY retested the $0.01400 support zone once more, and though a full breakdown didn’t occur, the price continued sliding, ending at $0.01397. This final dip confirms seller control, though $0.01400 remains a key line of defense for now.
Bearish Momentum Testing Key Support Around $0.01400
Jasmycoin price looks fragile going into the next session, with bearish momentum continuing to pressure the $0.01400–$0.01404 support zone. A breakdown below this area could open the door to a sharper move toward $0.01380. Short-term projection leans bearish unless bulls reclaim the $0.01415–$0.01430 resistance zone. Momentum is fading after multiple rejections at lower highs, and price remains below breakdown levels. Current structure supports the following levels: support at $0.01400 and $0.01380, resistance at $0.01415 and $0.01430. RSI is stuck near neutral but closer to oversold, while MACD is indecisive, showing weak crossover attempts. Any recovery needs a clear shift in both indicators and price structure.


