

Are you watching the JTO Price hover indecisively between key levels with no clear breakout? After yesterday’s failed recovery and today’s muted bounce, Jito Price continues to trade inside a tight range, reflecting a lack of strong momentum. Despite multiple RSI and MACD signals flashing throughout the chart, the JTO Network hasn’t confirmed any direction. With support at $2.00 holding and resistance near $2.30 still untouched, traders are left waiting for a trigger. Today’s narrow moves reflect hesitation, with buyers unable to reclaim control. Let’s discover is JTO is poised for its next breakout or breakdown.
JTO Price Analysis of May 11, 2025
The JTO Price analysis over the last 24 hours shows a full swing of volatility, with sharp drops, a short recovery, and a return to the same support zone. Jito Price faced rejection early in the day, tried to climb in an upward channel, but eventually broke down and settled in a narrow range. The day began with a strong selloff just after 00:00 UTC. A quick JTO breakout attempt toward $2.30 was met with heavy resistance. The price sharply reversed and dropped below $2.10 by 01:30 UTC. From 03:00 UTC to 08:00 UTC, Jito moved sideways, forming a base near the $2.00 support. Around 08:30 UTC, the RSI touched oversold levels, and JTO began to stabilize.

Chart 1- JTO/USDT M5 Chart, Analysed By Anushri Varshney, Published on TradingView, May 11, 2025
Between 09:00 UTC and 14:00 UTC, the JTO Network formed an upward channel, moving from $2.02 to a peak near $2.18. A MACD golden cross around midnight UTC confirmed growing bullish momentum, supported by steady RSI improvement. By 15:00 UTC, the RSI crossed into the overbought zone, and the price reached the top of the channel. Around 17:00 UTC, a sharp reversal broke the channel’s support line.
The RSI dropped from overbought conditions, and a MACD death cross, followed by 18:00 UTC, triggered another wave of selling. Jito Price fell back toward $2.03, undoing much of the day’s gains. From 19:00 to 23:00 UTC, the JTO Price remained under pressure. The RSI touched oversold again by 21:00 UTC, and the price briefly dipped below $2.00 before recovering slightly. Another MACD golden cross near 23:30 UTC hinted at a possible bounce.
JTO Price Holds Steady Near $2.07 After Failed Recovery Attempt
The prices traded sideways for most of today, failing to push beyond $2.10 despite a brief recovery attempt during early Asian hours. Jito Price bounced from the $2.00 support around 06:00 UTC after showing RSI oversold signals, but momentum remained weak. A MACD golden cross sparked a minor uptick, yet resistance near $2.10 capped further gains. The price is now consolidating around $2.07. No major trend shift occurred, and the network continues to range between $2.00 and $2.30, with traders watching for a decisive breakout in either direction.
JTO Network Awaits Directional Break as Momentum Stalls
Jito Price continues to hover near the midpoint of its established range, with $2.00 acting as strong support and $2.30 holding as overhead resistance. Today’s price action reflected low volatility and reduced momentum, as buyers failed to extend the bounce beyond $2.10. The MACD showed a golden cross earlier in the day, but follow-through was limited. RSI recovered from oversold territory but now trends sideways, indicating a lack of strength on either side. JTO remains caught in a tight band with no clear trend. For bulls, a breakout above $2.30 remains the key trigger to reignite momentum, while a clean breakdown below $2.00 would confirm further weakness. Until then, the JTO ecosystem is likely to see choppy moves within the current range.
Jito (JTO) Price Analysis For May 17, 2025
The JTO Price analysis over the last 24 hours shows a calm start, a sharp breakdown midday, and a heavy downtrend through the evening. The session began at $1.91, trading inside a tight range between $1.91 and $1.93. This sideways movement lasted from 00:00 to 10:30 UTC. Momentum was weak during this time, and the MACD gave multiple golden crosses, but the Jito Price showed no clear direction. RSI stayed flat near 50. Around 10:45 UTC, the JTO Network token started showing early signs of weakness. Price began drifting lower from the top of the range. By 11:30 UTC, the range broke down, and JTO entered a steep downtrend. A clear downward channel formed as the price dropped from $1.91 to $1.84 by 17:00 UTC.
During this slide, the MACD gave two strong death crosses, confirming bearish pressure. RSI also dipped sharply, moving close to oversold levels around 18:00 UTC. From 17:00 to 20:00 UTC, the Jito Price remained under pressure. Every bounce attempt got rejected near the upper boundary of the channel. Sellers controlled momentum throughout this phase. By 20:30 UTC, RSI touched the oversold zone, and price made a new low at $1.82.

Chart 2- JTO/USDT M5 Chart, Analysed By Anushri Varshney, Published on TradingView, May 17, 2025
After hitting $1.82, the Jito Price attempted a minor recovery from 21:00 to 23:00 UTC. However, the bounce remained weak and limited below $1.85. A brief golden cross appeared on the MACD around 22:15 UTC, but it lacked volume and confirmation. By the end of the day at 23:59 UTC, the JTO Price settled near $1.83, closing deep in the red.
JTO Price Holds Between $1.86 and $1.90 After Breaking Above $1.83
The JTO Price today shows consolidation after a sharp overnight breakout. Following yesterday’s downtrend, the Jito Price reclaimed strength early around 00:00 UTC, breaking above the downward channel near $1.83. This triggered an uptrend toward $1.89 by 02:30 UTC. A golden cross on the MACD confirmed bullish momentum. However, after the peak, JTO entered a tight trading range between $1.86 and $1.89. RSI stayed neutral, and the MACD flipped into a mild death cross by 06:00 UTC. As of now, the JTO Network token is holding near $1.868, showing signs of stability. Buyers are defending the breakout, but a move above $1.90 is needed to confirm further upside.
JTO Price Outlook Remains Cautious Amid Mixed Signals
The recent JTO Price action highlights a market in flux, with the JTO Network token facing ongoing challenges after a notable downtrend. Despite hitting oversold conditions and attempts at recovery, sellers maintained control through much of the day, keeping pressure on price levels. The late bounce showed limited strength, indicating buyers have yet to decisively regain momentum. However, the breakout from the downward channel overnight suggests potential stabilization, as the Jito Price currently holds above key support near $1.86. Technical indicators remain mixed—while the MACD briefly signaled bullish momentum, it quickly softened, and the RSI hovers near neutral. Moving forward, a sustained rise above $1.90 will be critical for confirming a bullish reversal and renewed confidence in the Jito Network token. Until then, traders should approach the Jito Price with caution, watching closely for clear directional cues.
Jito (JTO) Price Analysis For June 8, 2025
The JTO price analysis shows a complete shift in momentum—from a bullish start to a choppy mid-session and finally a sharp decline. The day began with Jito Price moving inside an upward channel, gradually climbing from around $1.812 at 00:00 UTC to a session high of $1.860 by 01:45 UTC. During this phase, RSI briefly touched overbought near 70, and MACD printed two early golden crosses, confirming rising momentum in JTO Network.
After 02:00 UTC, the upside slowed, and JTO entered a broad trading range between $1.835 and $1.860. Price stayed inside this zone for nearly four hours. Between 02:30 and 05:30 UTC, MACD flipped multiple times, showing mixed momentum, while RSI hovered between 45 and 60.
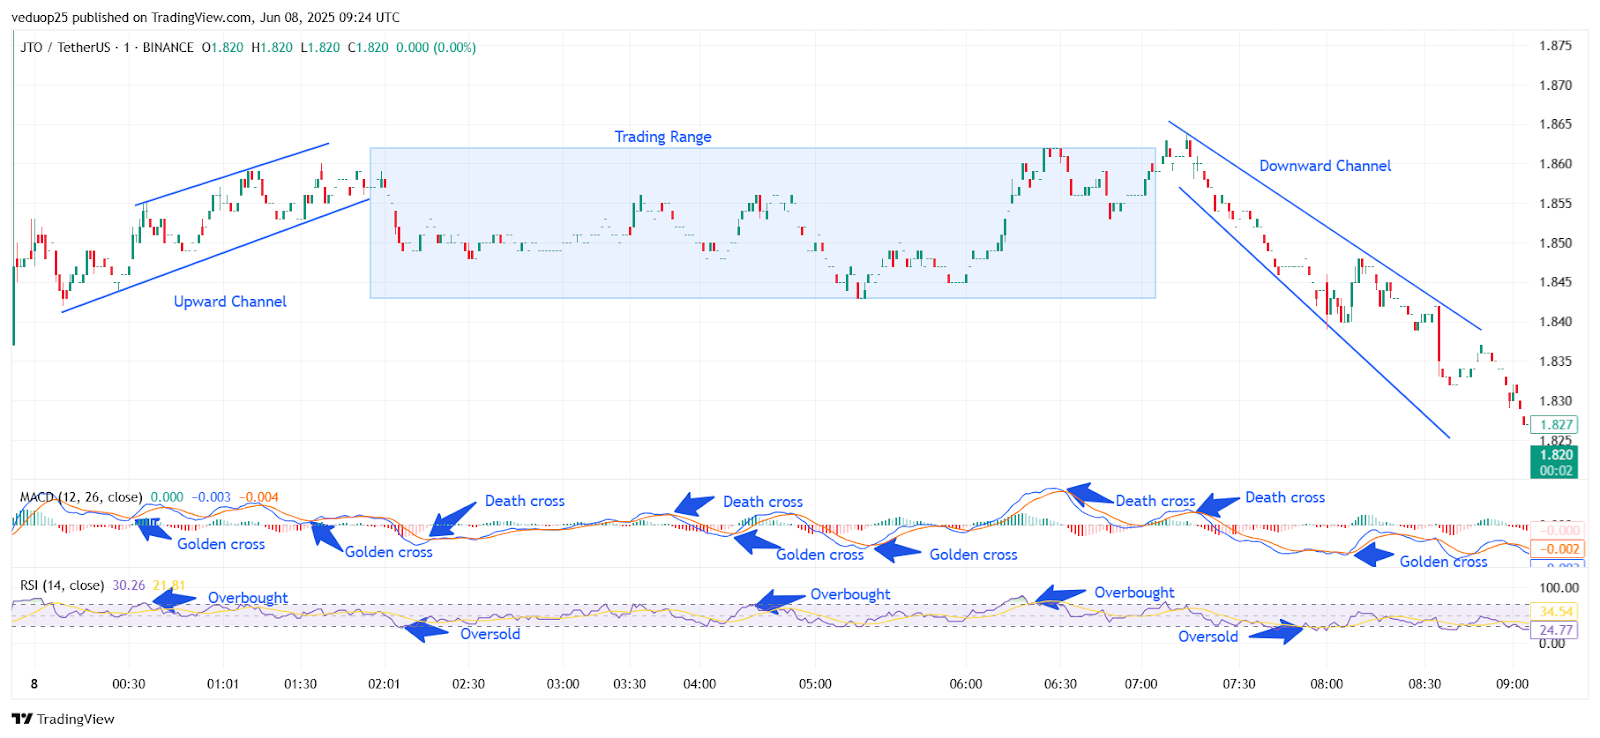
Chart 3- JTO/USDT M1 Chart, Analysed By Anushri Varshney, Published on TradingView, June 8, 2025
At around 06:00 UTC, JTO attempted a quick bounce above $1.860, but it was short-lived. By 06:30 UTC, a fresh MACD death cross signaled the beginning of a breakdown. From 06:45 UTC onward, the JTO Price began sliding into a clean downward channel, confirming a new bearish phase.
JTO Price Hits $1.820 Low as Bearish Pressure Holds Below $1.840
Between 07:00 and 09:00 UTC, Jito Price continued its drop, making lower highs and lower lows. MACD stayed bearish with back-to-back death crosses, while RSI dropped steadily, falling into oversold territory multiple times, hitting as low as 24. By 08:50 UTC, JTO Network had reached an intraday low near $1.820, with weak signs of a bounce. A minor golden cross appeared in the MACD right before the session closed, hinting at a possible pause in selling.
As of the last candle at 09:00 UTC, the JTO Price holds just above $1.827 but remains inside the descending channel. RSI sits around 34, suggesting the coin is still under bearish pressure. For bulls to regain strength, the price needs to break above the $1.840 resistance and exit the channel.
JTO Network Struggles to Rebound Amid Bearish Momentum
The overall trend for JTO Price remains tilted to the downside following a failed breakout attempt and a breakdown into a descending channel. Despite early gains during the upward channel phase, the momentum quickly shifted as the price entered a consolidation zone and eventually reversed. From 07:00 UTC onward, strong bearish pressure dominated the session, with Jito Price falling steadily and RSI touching deeply oversold levels. Even though a minor MACD golden cross formed just before the close, it lacked strong follow-through, suggesting hesitation among buyers. Traders hesitated to push in either direction, and volume faded, adding to the indecision.
Unless bulls push above the $1.840 resistance and break out of the falling channel, JTO Network could remain under pressure. Traders should watch for an RSI recovery above 40 and a stronger bullish volume to confirm any real reversal. For now, the bears have the upper hand, and JTO may retest lower supports if momentum doesn’t shift soon.
Jito (JTO) Price Analysis For June 11, 2025
The JTO Price analysis shows a full cycle of downward pressure, breakout moves, and tight-range trading. The session started at 00:00 UTC with a steep fall. Jito Price declined from around $2.32 to $2.22 by 02:15 UTC inside a well-defined downward channel. RSI dropped below 30 briefly near 01:45 UTC, confirming an oversold zone. Back-to-back golden crosses on MACD between 01:30 and 02:00 UTC hinted at a reversal, which played out soon after.
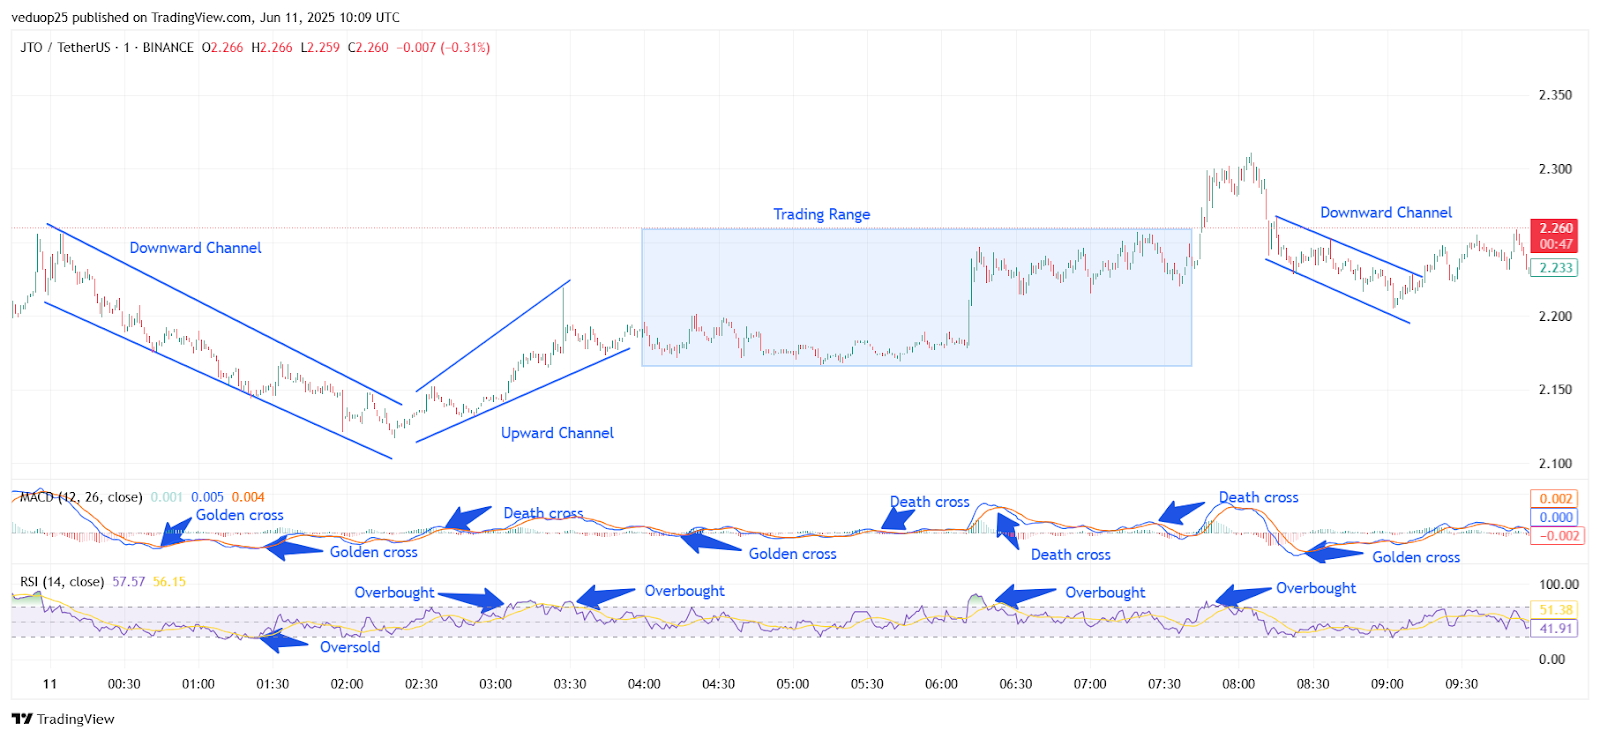
Chart 4- JTO/USDT M1 Chart, Analysed By Anushri Varshney, Published on TradingView, June 11, 2025
Between 02:15 and 03:15 UTC, the price rebounded within an upward channel. JTO Price moved from $2.22 to $2.28, recovering nearly all losses. RSI stayed above 65 during this run, touching the overbought zone around 02:45 UTC. MACD printed another golden cross near 02:30 UTC, backing the bullish momentum. However, a death cross appeared soon after at 03:15 UTC, signaling a cooling phase. Between 03:15 and 06:15 UTC, Jito Price shifted into a flat trading range between $2.26 and $2.29. The move was slow and lacked substantial volume. MACD stayed flat for most of this phase with one golden cross near 04:45 UTC and a mild death cross by 06:00 UTC. RSI hovered near 55–60, indicating a balanced strength between buyers and sellers.
Breakout to Pullback: JTO Price Faces Resistance Near $2.33
At 06:15 UTC, JTO Network saw a sharp breakout. The price surged quickly from $2.28 to $2.33 by 06:45 UTC. RSI hit overbought levels again, and MACD flipped bullish with a clean golden cross. However, the breakout lost steam fast. A sudden death cross on the MACD at 07:30 UTC pulled the price back into a correction. Between 07:45 and 09:15 UTC, JTO Price entered another downward channel. Price slid from $2.31 to $2.22 with steadily lower highs.
RSI fell to 42, and MACD showed three back-to-back death crosses during this drop. Sentiment turned weak, but no major breakdown followed. From 09:15 to 10:00 UTC, the coin tried to recover. Jito Price rebounded from $2.22 to $2.26. A golden cross on MACD supported the bounce, but RSI stayed neutral near 51, showing hesitation near resistance.
JTO Price Holds Range After Failed Breakout
The JTO price ended the session with mixed signals after testing both support and resistance zones. The early downward channel brought strong selling, but Jito Price recovered quickly through a clean upward channel. Momentum from the JTO Network faded during the mid-session as the coin got stuck in a narrow trading range. Although a breakout above $2.30 looked promising, it failed to hold beyond $2.33, leading to a fresh drop into another downward pattern. Indicators like RSI and MACD aligned well with each move, especially during the breakout and retracement phases.
By the end of the session, JTO price was trading near $2.26, close to its mid-range level. Support remains firm at $2.22, while $2.33 is still the resistance to beat. Unless bulls reclaim higher ground, Jito price may continue oscillating in this wide band. A clear breakout on either side will likely decide the next trend for the JTO Network.
Jito (JTO) Price Analysis For June 13, 2025
The JTO price analysis shows a volatile session with two major trend shifts, first a steep fall, then a strong rebound inside an upward channel. By 01:30 UTC, the JTO price fell sharply, forming a clean downward channel. During this phase, the RSI dropped into oversold territory multiple times, hitting as low as 22. Meanwhile, the MACD stayed bearish with no bullish crossover signals. The price slid from nearly $1.97 to a low of around $1.80. This was the first sign of major selling pressure gripping the Jito price market early in the session.
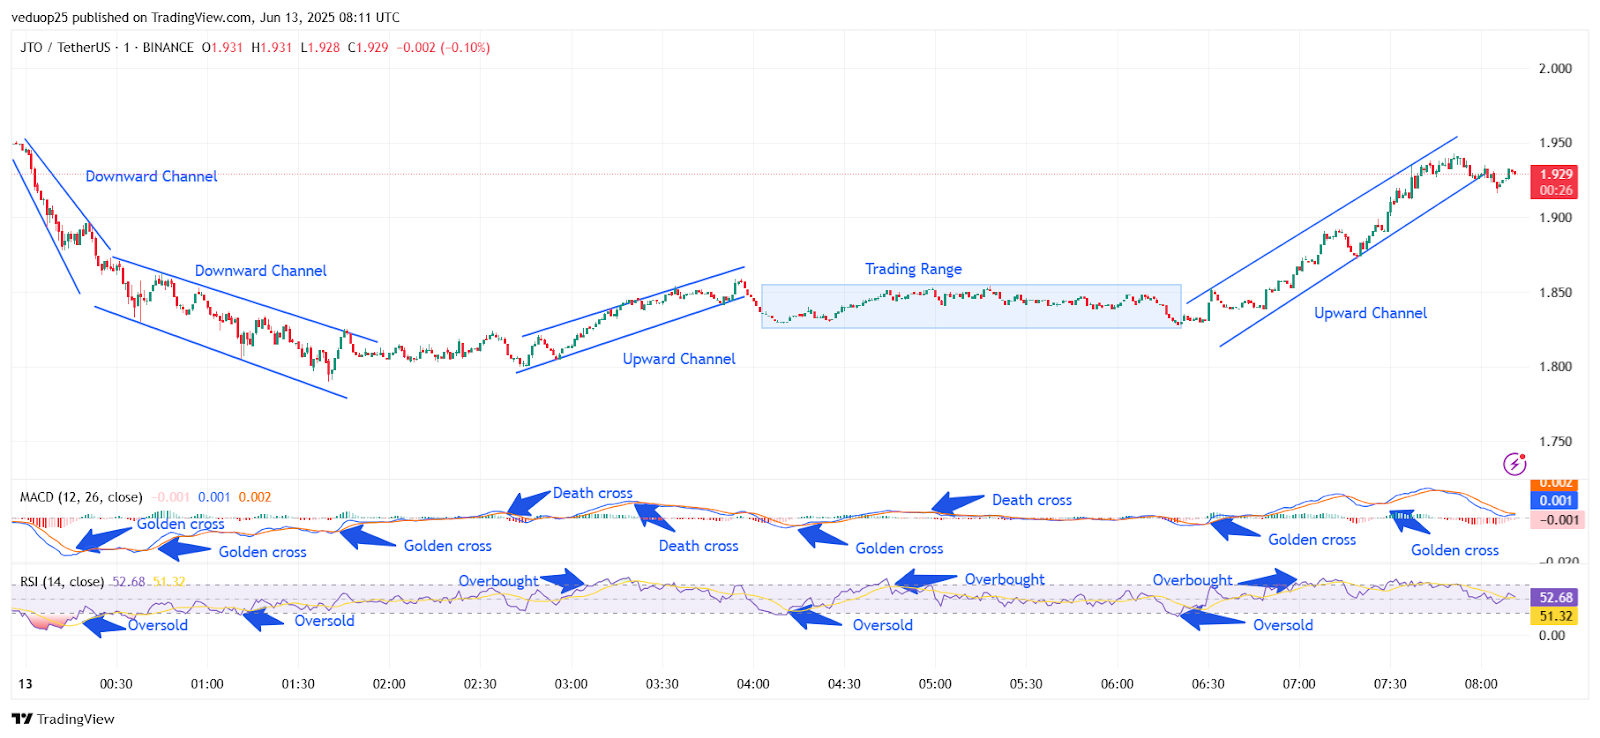
Chart 5- JTO/USDT M1 Chart, Analysed By Anushri Varshney, Published on TradingView, June 13, 2025
Between 01:30 and 02:30 UTC, signs of recovery began to show. The RSI finally began to lift out of oversold conditions, and the MACD printed its first golden cross, a sign of early momentum shifting. This move initiated a gradual breakout from the lower channel. From 02:30 to 03:45 UTC, the JTO network entered a strong upward channel. The price bounced steadily from $1.82 to nearly $1.89. However, around 03:45 UTC, a death cross appeared on the MACD, showing a loss of strength in the rally.
JTO Price Surges to $1.95 After Range Breakout, Faces Resistance at $1.96
By 04:00 UTC, the price started moving sideways inside a tight trading range between $1.84 and $1.86. This phase lasted until about 06:15 UTC. RSI hovered in the 55–65 zone, indicating neutral momentum, while the MACD showed multiple death crosses and golden crosses, reflecting indecision and reduced volume. Even when the RSI hit overbought near 05:15 UTC, the Jito price failed to break out.
Momentum returned after 06:15 UTC. A golden cross on the MACD and an RSI bounce near 35 triggered another upward channel. The JTO price surged from $1.85 to $1.95, with steady gains lasting until 07:45 UTC. The MACD stayed bullish throughout this move, and RSI briefly hit overbought again before cooling. By 08:00 UTC, the JTO price settled near $1.93, moving slightly sideways. RSI cooled to around 52, and the MACD began to flatten, hinting at fading momentum as the day ended.
JTO Price Remains Bullish but Faces Short-Term Exhaustion
The JTO price closed the last 24 hours on a strong note after recovering sharply from early losses. Despite the initial drop into the $1.80 range, the JTO network found solid buying support that helped the price climb back into an upward channel. With multiple golden crosses on the MACD and RSI pushing into overbought zones, momentum favored the Bulls in the second half of the session. However, signs of short-term exhaustion are starting to show as RSI cools and MACD begins to flatten.
The Jito price needs to hold above $1.90 to maintain its bullish structure. A break below this level could send the price back into the $1.85 support zone. On the upside, the $1.96 and $2.00 levels remain key targets. Overall, the trend looks positive, but traders should watch for cooling signals before expecting another leg up in the JTO network.


