
Are you tracking Jupiter (JUP) and wondering where it might be headed next? You’re in the right place. The JUP token has seen its fair share of volatility since launch, with sharp moves and sudden shifts in momentum. After a shaky start to the year, sentiment remains mixed, and recent price action has kept traders watching closely. The coin has seen an approximately 47% drop since the beginning of the year, falling from $0.8+ levels. With that in mind, let’s take a closer look at the current chart and see what technical indicators suggest for the days ahead.
Jupiter (JUP) Price Analysis for May 4, 2025
The Jupiter price opened the day strong near the $0.465 mark, but quickly faced selling pressure. A sharp downtrend began just after midnight, with the JUP price sliding from $0.460 to $0.454 by 01:40 UTC. MACD confirmed the bearish trend with a clear death cross, while RSI dipped below the midline. From 02:00 to 04:20 UTC, a slight upward trend formed, marked by a golden cross on the MACD and the RSI surge. However, this momentum was short-lived as another downtrend took over. The JUP price fell again, bottoming at $0.438 around 11:50 UTC. Consecutive death crosses reinforced the decline, and RSI dropped close to the oversold region.

Chart 1: analyzed by raodevansh18, published on TradingView, May 4, 2025
A sideways trading range formed between 05:30 and 07:00 UTC, holding the Jupiter price between $0.442 and $0.446. While MACD lines briefly converged, no breakout followed. A fresh downtrend ensued around 15:30 UTC, pushing JUP price down to $0.429 by 17:20 UTC. During this slide, RSI entered oversold territory multiple times, and MACD continued forming death crosses. By 18:55 UTC, a mild recovery began. RSI rose above 50, and a golden cross on MACD pointed to some bullish action. The Jupiter price hit $0.4245 at 11:00 UTC. However, the price still remained under pressure, unable to reclaim higher resistance zones.
Jupiter Makes Weak Attempts at Reversal, Relinquishes Support Today
On May 4, JUP price continued its bearish structure early on. It hovered between $0.425 and $0.432 until 08:00 UTC, forming another narrow trading range. However, by 08:00 UTC, a sharp dip saw the Jupiter price break below $0.425. The RSI again hit oversold levels, and MACD issued another death cross, dragging the token to an intraday low of $0.420 by 09:20 UTC. Some price stability followed, and at the time of writing, JUP price has risen modestly to $0.4245. A recent golden cross on MACD and RSI near 50 indicates the possibility of a short-term JUP breakout, but price remains under the key resistance band near $0.430.
Indicators Suggest Further Downturn Risk for Jupiter
Both RSI and MACD have been active throughout the session, showing repeated instances of weakness. The MACD has spent most of the day below the signal line, while RSI has touched oversold zones at least four times. However, the most recent MACD golden cross and RSI push above 50 signal mild optimism. If buying pressure holds, the Jupiter price could make another test toward $0.430–$0.435 in the next few hours. If momentum fails again, another leg downward toward $0.418 may be possible.
In the short term, Jupiter price remains exposed to bearish sentiment. Despite minor bullish reversals, the market has been unable to mount a sustained JUP breakout. Traders may want to watch the $0.420–$0.418 support range closely. Further downside from here could open up a steeper fall. On the upside, a confirmed close above $0.435 could lead to a breakout test near $0.445. For now, the JUP price lacks volume and conviction, and the bears still appear to hold the upper hand.
Jupiter (JUP) Price Analysis for May 18
After facing considerable resistance at the $0.5090 level in the previous sessions, Jupiter declined remarkably to eventually find support at $0.4690. Today, however, it has shown promise since then. The Jupiter price opened the session at $0.4940 on May 17 under pressure, forming a steep downward trend that saw the price fall sharply toward the temporary support at $0.4792 by 1:40 UTC. This decline was reinforced by multiple death crosses on the MACD, indicating strong bearish momentum.
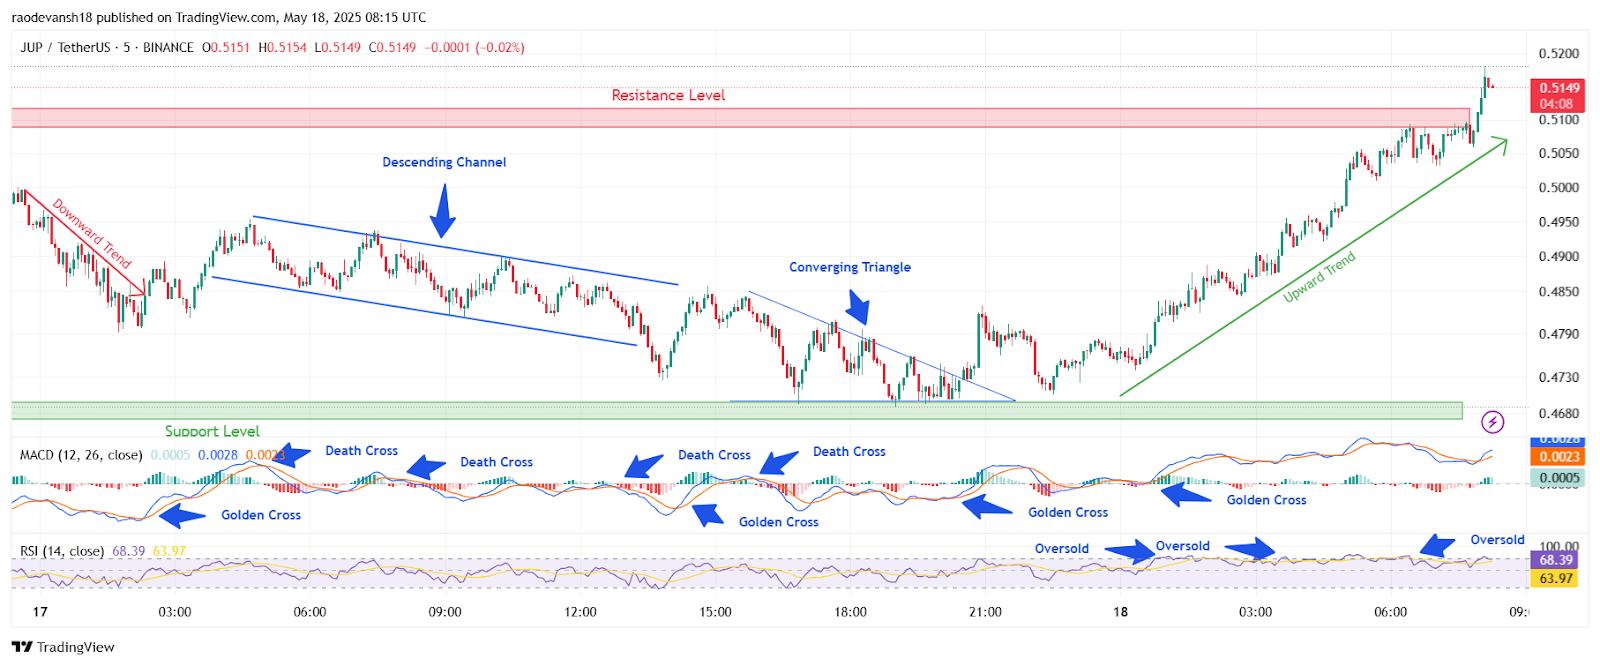
JUP/USDT, M-5 Chart, analyzed by raodevansh18, published on TradingView, May 18, 2025
Simultaneously, the RSI trended downward but remained above the oversold level initially, showing sustained selling interest. After the initial fall, the JUP price slightly reversed to $0.4950 by 4:40 UTC. The Jupiter token entered a descending channel, trading within parallel declining boundaries. This channel represented a controlled pullback rather than a full-on breakdown. Throughout the channel, the MACD continued to flash mixed signals with alternating golden and death crosses, while RSI hovered around the midline range, indicating indecision.
As the Jupiter price approached the lower support region around $0.47 by evening, a shift began to take shape. Price action started compressing into a converging triangle, a pattern that often precedes breakout moves. Meanwhile, RSI briefly dipped into oversold territory, signaling that sellers may be losing strength. The MACD confirmed this with a golden cross just as the JUP price broke out of the triangle. This early momentum shift hinted at the possibility of a positive Jupiter breakout, which eventually materialized after the price broke above the triangle’s upper resistance line.
Jupiter Breakout Confirmed as Price Rallies Above Resistance
The most significant development occurred when the JUP price decisively rallied above the $0.509 resistance zone, backed by a steep upward trendline. This marked a Jupiter breakout on May 18, as the price surged past prior highs and entered a strong bullish phase. The MACD histogram flipped positive while the signal line separation widened, further validating the bullish momentum.
Also, the RSI surged to near-overbought territory, suggesting strong buying pressure. This breakout move pushed the Jupiter price to $0.5194 by 8:20 UTC on May 18 , surpassing key resistance levels that had previously rejected bullish attempts. The breakout was clean and aggressive, with minimal retracement, adding to the breakout’s credibility.
JUP Price Outlook: Is There More Room to Rally?
Now that a Jupiter breakout has taken place, the key question is whether the move can be sustained. The price is currently consolidating just above the previous resistance, which has now flipped into support. A continued hold above $0.510 could open the door for further gains toward $0.525 and potentially $0.540.
However, traders should be cautious of a short-term pullback. The RSI is nearing the overbought zone, and the MACD is at elevated levels, suggesting the current uptrend may need a cooldown before the next leg up. Still, as long as the JUP price stays above the trendline and previous resistance, the outlook remains bullish.
Jupiter Price Shows Strength After Technical Breakout
The overall structure of the chart shows a clear Jupiter breakout from a descending pattern and converging triangle, followed by a solid rally. Both MACD and RSI support this move, and the breakout past resistance confirms renewed bullish sentiment. As long as momentum holds and the Jupiter price remains above $0.510, the path of least resistance remains to the upside.


