

If you want to invest in or buy Jupiter and wonder what the right price to start accumulating the Jupiter coin is, then you are at the right place. As we go through the analysis, we will determine different patterns and how Jupiter reacts to them. We will also see support and resistance, which is a good area for any instrument to buy or sell. Without any further delay, let’s dive into the Jupiter price analysis and explore different opportunities arising from it.
Jupiter (JUP) Price Analysis of May 27, 2025
The Jupiter price action began with a downside breakout from a converging triangle, setting the session low. Following the low, the JUP price showed signs of recovery through a series of upside breakouts supported by golden MACD crossovers. Despite several short-lived rallies, repeated overbought RSI readings signaled vulnerability. A series of failed downside breakouts and erratic channel formations reflected heightened indecision and a lack of sustained momentum, highlighting a volatile session defined by swings and failed follow-throughs.

Chart 1: JUP/USDT M1 Chart, Analysed by vallijat007, published on TradingView, May 27, 2025
The Jupiter price formed a converging triangle pattern, which broke out to the downside at 04:55 UTC, supported by a death crossover of MACD, pushing the price down and marking the low for the day at $0.5930. After marking the low, the price formed a range. The range broke out to the upside at 05:35 UTC, supported by a golden crossover of MACD, and another range followed. The second range again broke out to the upside at 05:48 UTC, supported by a golden crossover of MACD. Price spiked to the upside and formed an upward-moving channel.
Jupiter Coin Volatile Near $0.6500 High Amid Mixed Signals and Swings
In the meantime, at 06:10 UTC, RSI moved above the level of 70, indicating overbought market conditions, suggesting a reversal or at least a pullback. The upward-moving channel broke out to the downside at 06:53 UTC, supported by a death crossover of MACD, but the downside breakout soon failed, and the JUP price rose again, forming another range. The range broke out to the downside at 07:52 UTC, supported by a death crossover of MACD, but the breakout failed, and the Jupiter price reversed to the upside, forming a new range.
The second range broke out to the downside at 08:34 UTC, supported by a death crossover of MACD, leading to a converging triangle pattern. The converging triangle pattern broke out to the downside at 09:05 UTC, supported by a death crossover of MACD, and formed a downward-moving channel. In the meantime, at 09:20 UTC, RSI dropped below the level of 30, indicating oversold market conditions, suggesting a reversal or at least a pullback.
The downward-moving channel broke out to the upside at 09:24 UTC, supported by a golden crossover of MACD, forming an upward-moving channel. The channel broke out to the upside again at 09:54 UTC, supported by another golden crossover of MACD, and formed another upward-moving channel. In the meantime, at 10:00 UTC, RSI moved above the level of 70, indicating overbought market conditions, suggesting a reversal or at least a pullback. The second upward-moving channel broke out to the downside at 10:59 UTC, supported by a death crossover of MACD.
Jupiter Struggles for Direction Amid Choppy Breakouts
Jupiter coin’s trading session has been marked by back-and-forth volatility, where both bullish and bearish breakouts failed to lock in a clear trend. The Jupiter price currently hovers near overbought territory after multiple golden MACD crossovers but lacks strong conviction. If the recent downside breakout sustains, a retest of the session low could follow. Conversely, a recovery above recent highs may spark momentum toward new levels. Until a decisive move is confirmed, traders should remain cautious and focus on key support and resistance areas, as Jupiter coin continues to exhibit erratic, range-bound behavior.
Jupiter (JUP) Price Analysis June 12, 2025
Jupiter price demonstrated a highly volatile trading pattern shaped by several key technical structures and momentum shifts. The day began with a breakdown from a converging triangle pattern, which tested support at $0.4850. Despite multiple golden and death crossovers of MACD, the market failed to hold trend direction, resulting in a sequence of expanding triangles, channels, and ranges. The Jupiter price peaked at $0.5096 before pulling back under pressure, while RSI oscillations signaled both overbought and oversold conditions. The session ended near the low of $0.4541, underscoring the day’s sharp volatility and indecisive sentiment. Jupiter price is currently trading at $0.4600.
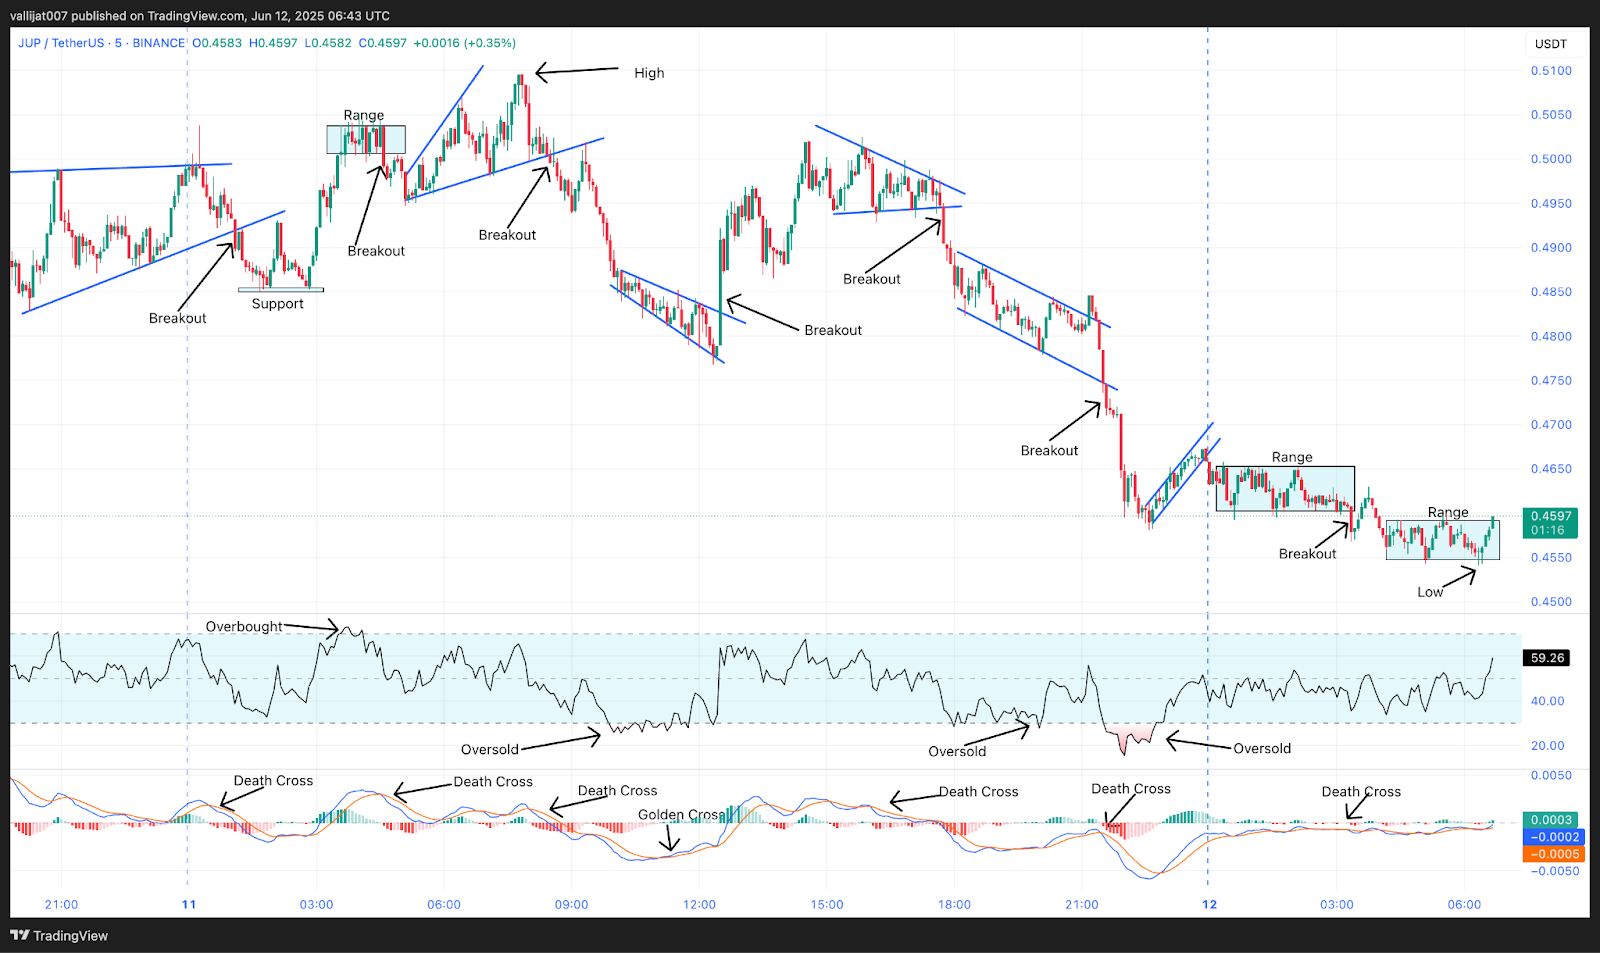
Chart 2: JUP/USDT M5 Chart, Analysed by vallijat007, published on TradingView, June 12, 2025
Jupiter price formed a converging triangle pattern. The pattern broke out to the downside at 01:05 UTC, supported by a death crossover of MACD, and established a support area at the level of $0.4850. As the Jupiter trend was unable to break below the support area, it rose to the upside and developed a range. At 03:45 UTC, RSI moved above the level of 70, indicating overbought market conditions and suggesting a reversal or at least a pullback.
Channel Formation Follows Death Crossover at 08:30 UTC
The range broke to the downside at 04:35 UTC, supported by a death crossover of MACD, but the breakout failed, and Jupiter trend rose, developing into an expanding triangle pattern. The expanding triangle pattern marked the high for the day at $0.5096. It broke out to the downside at 08:30 UTC, supported by a death crossover of MACD, and formed a downward-moving channel. The channel broke out to the upside at 12:30 UTC, supported by a golden crossover of MACD, and formed a converging triangle pattern.
Converging Triangle Breakdown at 17:45 UTC Leads to Channel Formation
Supported by a death crossover of MACD, the converging triangle pattern broke out to the downside at 17:45 UTC and shaped another downward-moving channel. At 20:00 UTC, RSI fell below the 30 level, pointing to oversold market circumstances and implying a turnaround or at least a slight rise in the price. Supported by a MACD death crossover, the downward-moving channel broke out to the downside at 21:35 UTC; an upward-moving channel followed.
The upward-moving channel broke out to the downside at 00:00 UTC on 12 June 2025, supported by a death crossover of MACD, and formed a range. The range broke out to the downside at 03:20 UTC, supported by a death crossover of MACD, and another range formed. This second range marked the low for the day at $0.4541. If the range breaks to the upside, the price may rise to the level of $0.5000. If it breaks to the downside, the JUP price may drop to the level of $0.4000.
$0.4541 Low Sets Bearish Tone as JUP Price Remains Range-Bound
Jupiter price closed the day near its lowest price point, reinforcing a bearish market structure. Although early upward momentum pushed the price to a session high of $0.5096, the rally lacked staying power, and a series of failed breakouts followed. RSI dropped below 30 late in the session, indicating oversold conditions, but no meaningful rebound materialized. If the current range breaks upward, a retest of the $0.5000 zone is possible. However, if bearish pressure continues, the price could fall further toward $0.4000. Traders should remain cautious, as JUP currently shows no sustained trend and reacts sharply to technical triggers.


