

Are you tracking the KAIA price and wondering if now is the right time to consider the KAIA coin for your portfolio? You’re in the right place. This article examines the recent developments in the price of KAIA to identify future market trends. Both stable price moments and sudden KAIA price surges have occurred while investors keep a close eye on a possible KAIA break. The current price movements of KAIA maintain a tight range between essential support and resistance boundaries and technical indicators such as MACD and RSI support changes in market trends. The latest KAIA chart analysis requires us to investigate technical signals that could affect the market in the near future.
KAIA Price Analysis Of May 4, 2025
The price movement of KAIA Coin followed specific boundaries while trading between 03:00 UTC and 21:00 UTC. Throughout this interval, the price maintained stable movement between support and resistance markers as the trading limits became clear in the chart design. During this period the KAIA price stabilized at the same level as sellers equaled buyers because it remained in the blue-shaded box. Market movements throughout this time interval were not vigorous enough to break out of the price range and volatility remained minimal.
The MACD indicator generated a death cross at 03:00 UTC which indicated short-term negative market trends. The RSI reported an oversold situation shortly after showing a decline in selling activity across the KAIA network. Both MACD and RSI indicators reached their respective top and bottom levels by 06:00 UTC. The lower range boundary received defense support from buying activities which halted the sellers’ brief dominance. The pattern ran its course multiple times within this UTC period extending from 09:00 UTC through 18:00 UTC. Golden crosses and death crosses on MACD occurred in alternation to show brief period momentum shifts.
KAIA’s Intraday Price Movement and Technical Signals
Oversold RSI signalings at 09:00 UTC, 15:00 UTC, and 18:00 UTC triggered three price bounce events each time. Multiple price rebounds happened one after the other and grew progressively weaker suggesting diminishing bullish force in the market. The KAIA price maintained a position above the support level during this period yet failed to exhibit notable price gains which suggested a need for caution. Between 21:00 UTC until the end of the session selling pressure intensified which pushed the KAIA toward its support level with increasing frequency. A second death cross occurred on the MACD at 03:00 UTC on the subsequent day which further indicated negative market trends. The Relative Strength Index crossed oversold territory and the price nonetheless showed no substantial bounce-back.

Chart 1- KAIA/USDT M5 Chart, Analysed By Anushri Varshney, Published on TradingView, May 4, 2025
The KAIA Coin showed resistance against the support line at $0.1148 by 09:00 UTC because buying pressure failed to stop the price from falling. Failure of the support levels will likely trigger a KAIA breakout which could enhance the downward price movement. The price can re enter its established trading areas if bears experience significant upward momentum but maintaining bearish indications continues to dominate the market. The forthcoming price movement of KAIA should be observed through 3-hour periods since a decisive move outside the current range will establish the trend direction.
KAIA’s Make-or-Break Levels: Will Range Finally Break?
The current position of the KAIA price positions is very close to its fundamental support at $0.1148. The KAIA coin continues to experience a declining market trend since it has failed to penetrate its trading boundaries and supports resistance more often. The bearish trend continues according to MACD death cross patterns combined with multiple RSI oversold signals. A failure at the current support level could push KAIA to break out downward and continue their downward trend. Now that the price has recovered strongly it may bring in new purchasers to help build market sentiment. The ongoing KAIA observation plays a crucial role since upcoming market sessions hold the potential to shape its future short-term trajectory. Bears maintain control in the market while traders need to witness distinct upward or downward movements to determine market future directions.
KAIA Price Analysis For May 24, 2025
The KAIA price shows a structured flow of range-bound zones, trend shifts, and a key KAIA breakout that shifted the market tone before a pullback. Price opened near $0.1155 and began the day with a strong uptrend. By 00:25 UTC, KAIA coin pushed higher from $0.1155 to $0.1168, showing strong bullish intent. This move was backed by a golden cross on the MACD and a rising RSI near overbought. After the rally, the price entered a narrow trading range between $0.1166 and $0.1171 from 00:30 to 01:45 UTC. Momentum cooled, and RSI dipped slightly while the price stayed flat.
A new uptrend started at 01:50 UTC as bulls attempted another leg higher. KAIA price moved from $0.1166 to $0.1173 by 02:30 UTC. Another golden cross confirmed the strength. But from 02:30 to 04:15 UTC, the price entered another tight consolidation range. The RSI dipped into oversold briefly at 03:00 UTC but recovered without a clear breakout.
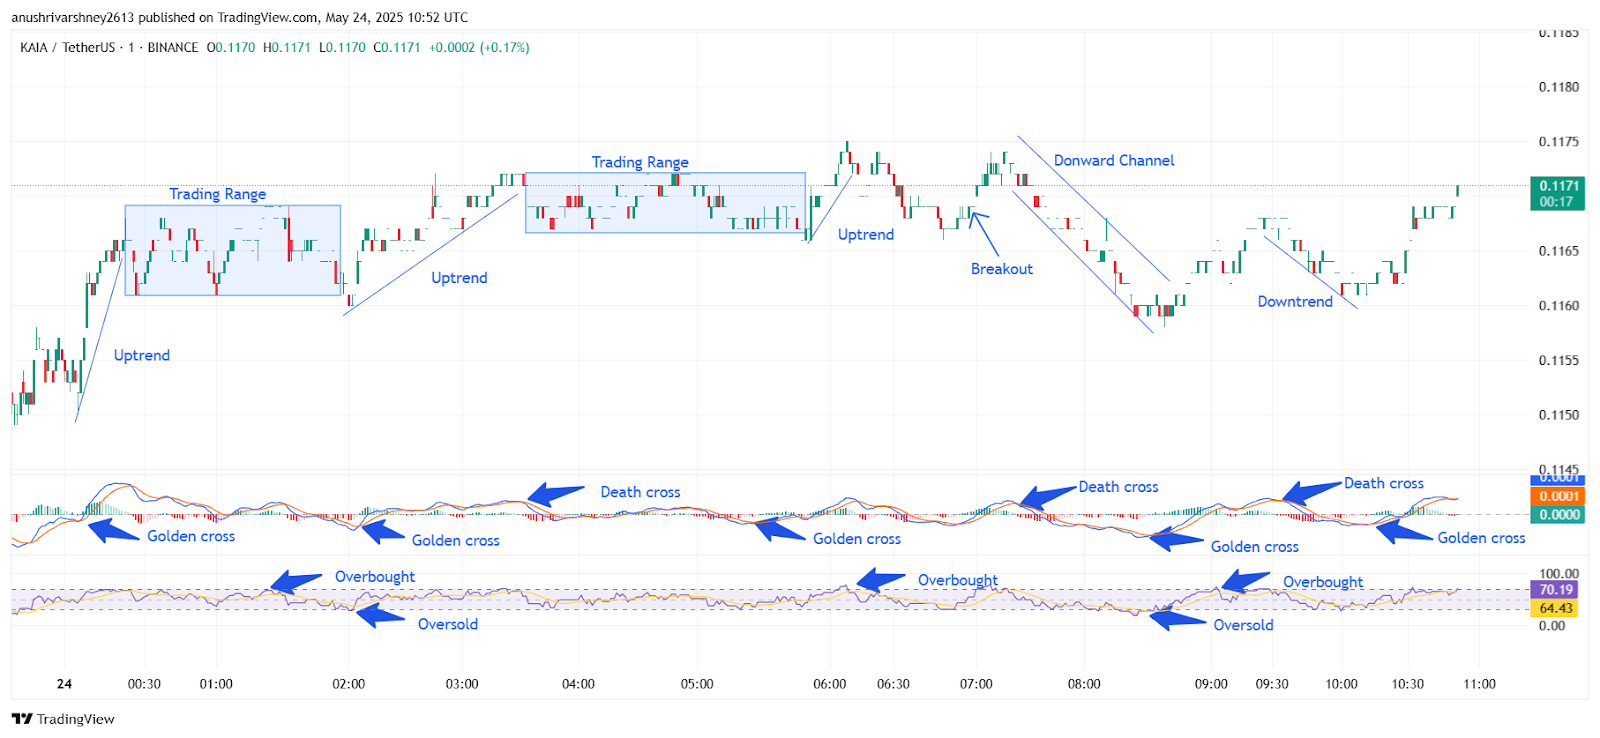
Chart 2- KAIA/USDT M1 Chart, Analysed By Anushri Varshney, Published on TradingView, May 24, 2025
At 04:30 UTC, the KAIA price picked up again, forming a new uptrend that pushed the price from $0.1165 to $0.1175 by 05:40 UTC. RSI returned to overbought levels while MACD showed mild bullish bias. This was followed by a short KAIA breakout around 05:45 UTC, spiking the price slightly higher, but the move lacked strength. From 06:00 UTC, a clean downward channel formed as the price fell from $0.1174 to $0.1160 by 08:00 UTC. A death cross on the MACD at 07:30 UTC confirmed the weakening structure. RSI also dipped to oversold near 08:10 UTC, marking the session low.
KAIA Coin Recovers 1.12% After Hitting $0.1158 Low
By 08:30 UTC, bulls attempted recovery, but another small downtrend followed from 09:15 to 09:45 UTC, dropping the price to $0.1158. A golden cross formed again near 10:00 UTC. RSI moved out of oversold. Buyers used this as an entry point. From 10:15 UTC onward, KAIA’s price rebounded, forming higher lows and pushing back to $0.1171 by the final candle. This small recovery was supported by another golden cross and a rising RSI toward 70.
The trend stayed neutral to slightly bullish, with repeated trading ranges, minor breakouts, and quick reversals. Despite multiple death crosses, buyers stepped in each time the RSI dipped near oversold, showing solid intraday support. KAIA coin managed to close flat for the day, hinting at a potential breakout setup if momentum builds.
KAIA Price Holds Ground After Choppy Sessions
The KAIA price held steady by the end of May 24 despite a mix of sideways ranges, failed rallies, and sharp intraday shifts. While multiple KAIA breakouts occurred, none led to a strong continuation. The price faced rejection near $0.1175 but found solid intraday support around $0.1160. RSI and MACD gave mixed signals throughout the day, with golden crosses followed by quick death crosses, highlighting uncertainty. However, the final rebound from oversold territory and a closing price near $0.1171 suggests buyers are still active.
The overall structure remains range-bound, but the repeated recovery attempts hint that the KAIA coin might be gearing up for a stronger move. If bulls can hold support above $0.1160 and push above the $0.1175 resistance, the next KAIA breakout could have more strength behind it. Until then, the price action may stay volatile with short-term trading ranges dominating.
KAIA Price Analysis For June 1, 2025
The KAIA price analysis exhibits a sequence of structured movements defined by multiple channel formations, sharp oscillator shifts, and alternating momentum shifts. The market opened within a tight trading range, holding near the $0.1041 level before breaking downwards at around 01:20 UTC. This breakdown triggered a downward channel, with the price consistently making lower highs and lower lows. Around 02:00 UTC, the RSI dropped into the oversold zone, signaling buyer exhaustion. Simultaneously, a MACD golden cross formed, and soon after, the price reversed upwards. This marked the start of a sharp recovery phase.
Between 02:30 and 03:45 UTC, KAIA traded within a newly formed upward channel. Momentum strengthened after a second golden cross, while the RSI moved back above 50 and eventually pushed into the overbought region near 05:00 UTC. This bullish leg was strong, but resistance near $0.1070 capped the rally. By 06:00 UTC, the MACD showed another golden cross, but its histogram started to weaken, warning of slowing upside momentum.
KAIA Price Hovers Flat Near $0.1041
The uptrend failed to sustain as the price began forming lower highs again. A death cross on the MACD around 06:45 UTC confirmed the shift, and KAIA entered another downward channel from approximately 07:00 UTC onward. This downtrend saw multiple lower highs and was supported by consistent RSI weakening. The RSI dipped back into oversold territory twice at 07:30 UTC and again near 09:45 UTC, signaling strong bearish pressure.
Despite this, price volatility began to compress post-10:00 UTC. MACD showed a final golden cross, and RSI climbed back above 50. However, price action failed to break out of the lower boundary of the channel, leaving KAIA trading near $0.1041 into the final candle.

Chart 3- KAIA/USDT M1 Chart, Analysed By Anushri Varshney, Published on TradingView, June 1, 2025
Throughout the day, the KAIA price respected technical signals from both RSI and MACD, with well-aligned oscillator moves during every major leg. The combination of repeated channel formations, multiple MACD crossovers, and RSI oscillations between overbought and oversold zones made this session highly technical.
KAIA Coin Awaits Breakout Confirmation Above Key Resistance
The overall structure suggests that KAIA Coin is still in a consolidation phase, despite showing both bullish and bearish moves. While the early push above $0.1065 hinted at strength, the failure to break above $0.1070 capped the upside. The downward channel that followed erased most gains, and although the price bounced off the $0.1034 support level, it still lacks strong momentum. MACD golden crosses and RSI recoveries point to buying interest, but not enough volume supported a decisive KAIA Breakout.
The $0.1041 level continues to act as a magnetic midpoint for price, with the market rotating around it. For now, the KAIA Price remains range-bound between $0.1034 and $0.1070. A clean breakout above $0.1070 with volume confirmation could signal the next move. Until then, short-term traders should watch for clear breaks from current patterns before making aggressive moves.
KAIA Price Analysis For June 6, 2025
The KAIA price analysis shows a steady rise through multiple bullish phases, backed by consistent RSI signals and MACD golden crosses. The day began with the KAIA Coin trading around $0.1010, following a sharp recovery from earlier lows. This set the stage for a clean uptrend formation around 00:15 UTC, marking the start of a strong upward channel. Between 00:30 and 01:45 UTC, the KAIA Price moved higher within this channel, supported by back-to-back MACD golden crosses and an RSI surge from oversold to 70+, signaling fresh buying interest. The price climbed steadily toward the $0.1045 zone, which acted as short-term resistance during this upward move.
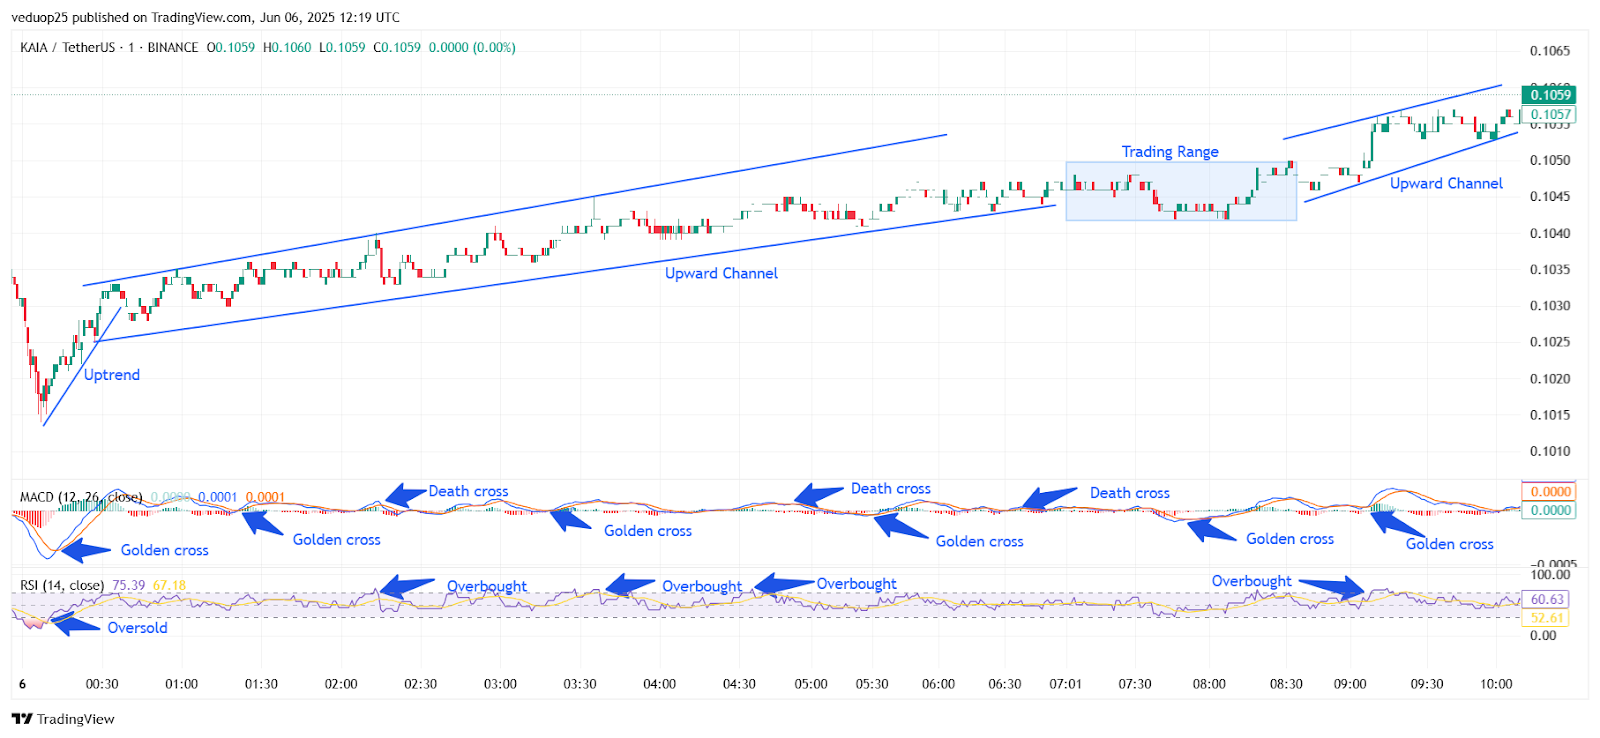
Chart 4- KAIA/USDT M1 Chart, Analysed By Anushri Varshney, Published on TradingView, June 6, 2025
From 01:45 UTC to 03:15 UTC, the pace of the uptrend cooled slightly. Although the price held within the channel, MACD started to flatten with a minor death cross at 03:00 UTC, indicating weakening momentum. Still, the RSI remained near the overbought zone, keeping bullish sentiment intact.
KAIA Breaks Above $0.1050 After Range-Bound Phase
By 03:30 UTC, KAIA entered a sideways trading range between $0.1045 and $0.1050. This phase lasted until 06:15 UTC. During this consolidation, RSI hovered between 65–75, while the MACD displayed a mix of golden and death crosses, showing indecision in the market. Despite that, the support held well, preventing any sharp dip. A fresh KAIA breakout came just after 06:15 UTC. The coin broke above $0.1050, marking the start of a second upward channel. This breakout was supported by another MACD golden cross and an RSI bounce back to the overbought zone, reaching 75.39 by 07:15 UTC.
The price surged to test the $0.1060 resistance by 08:45 UTC. Following 10:15 UTC, price action remained stable with minor fluctuations around $0.1055, holding above key support into the close of the session. The overall trend showed strength with multiple golden crosses, two clean upward channels, and well-respected support levels throughout the session.
KAIA Coin Holds Bullish Structure With Support and Breakout Strength
The overall performance of the KAIA Coin confirms a healthy uptrend supported by consistent technical signals. The price managed to climb steadily through two distinct upward channels, pausing only briefly in a narrow trading range. The repeated MACD golden crosses throughout the session, along with RSI entering the overbought zone multiple times, highlighted strong buyer interest and ongoing bullish sentiment. Even during consolidation phases, the KAIA Price respected key support at $0.1045, showing no signs of weakness.
The breakout above $0.1050 was particularly important, pushing the price toward the $0.1060 resistance level with solid volume and momentum. Although the RSI is now cooling, the structure remains intact and leans bullish. If the price holds above $0.1055, another KAIA breakout could be on the table. Traders should watch for a MACD crossover or RSI push above 70 again for a potential continuation toward $0.1070 or higher.
KAIA Price Analysis For June 12, 2025
The KAIA price analysis shows a day full of quick moves followed by a long phase of consolidation. Price opened with weakness and slipped into a steep downward channel by 00:45 UTC. During this fall, the KAIA Coin dropped from near $0.1740 to around $0.1685. RSI hit the oversold zone, and MACD confirmed a golden cross at the bottom, hinting at a possible reversal.
From 00:50 to 02:00 UTC, the KAIA price began climbing steadily. A clean uptrend formed and shifted into an upward channel. During this move, the price recovered from $0.169 to $0.174. RSI crossed into the overbought zone near 01:40 UTC, and MACD flipped bullish before giving a death cross signal by 02:15 UTC. By 02:30 UTC, selling pressure returned. The KAIA Coin entered another downward channel and gave up recent gains. The drop continued until 03:15 UTC, where RSI again hit oversold. MACD also showed a golden cross at the end of this move, sparking a minor bounce.
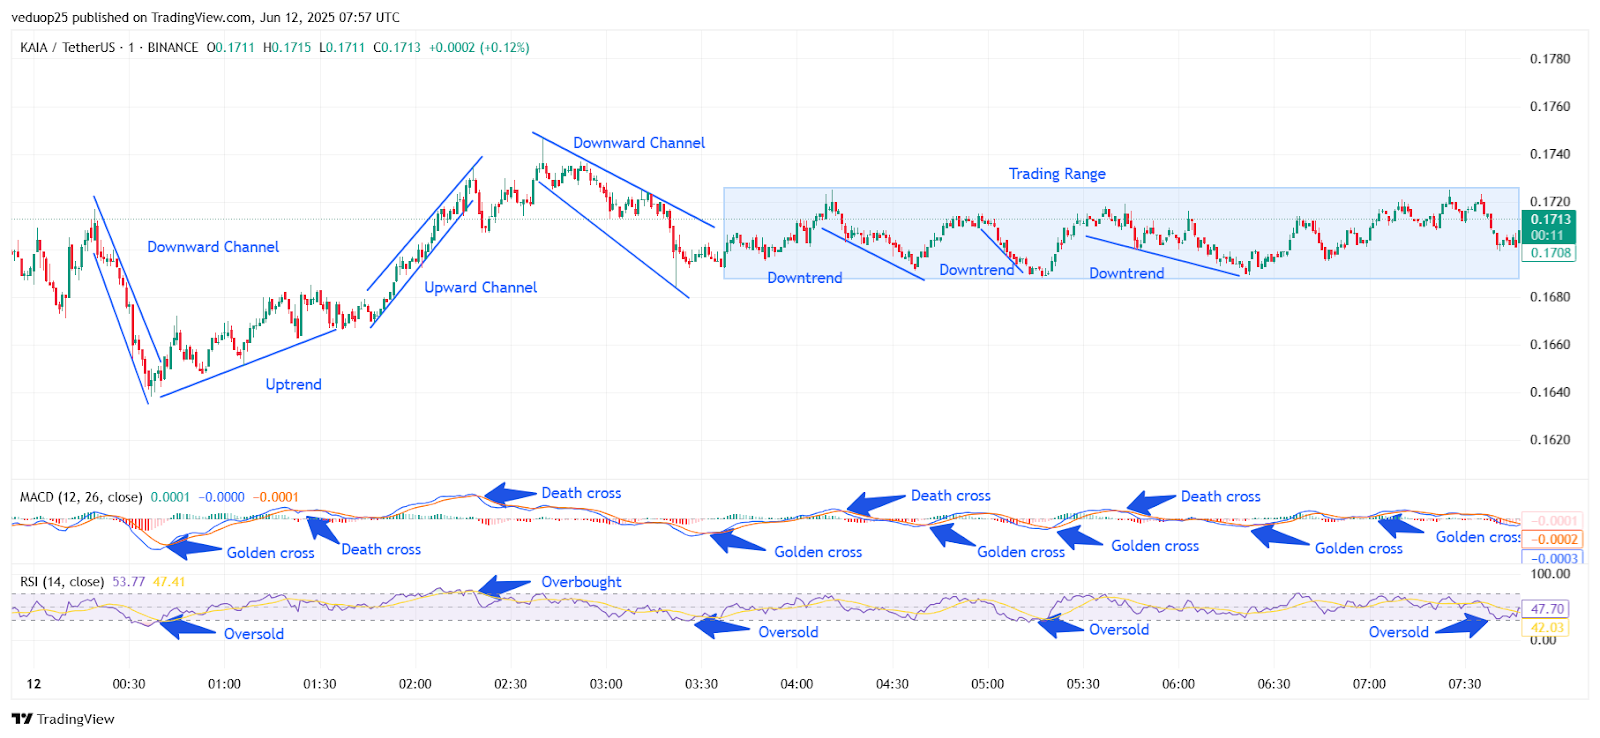
Chart 5- KAIA/USDT M1 Chart, Analysed By Anushri Varshney, Published on TradingView, June 12, 2025
Between 03:30 and 04:15 UTC, the price attempted to recover but faced weak volume. The rebound was short-lived and turned into another quick downtrend by 04:30 UTC. MACD crossed bearish again, and the RSI dropped below 40. Despite a small bounce at 04:45, overall momentum remained weak.
KAIA Stuck in Tight Range as Breakouts Fade Below $0.1720
From 05:00 UTC onward, KAIA price moved into a clear sideways range between $0.1708 and $0.1720. This trading range lasted for nearly three hours. Within this box, the chart showed multiple short-lived KAIA breakouts. Each spike was followed by a pullback, creating three minor downtrends between 05:15 and 07:00 UTC.
MACD gave back-to-back golden crosses and death crosses during this period, but the price stayed mostly flat. RSI hovered in the mid-zone, with occasional dips into oversold near 05:30, 06:00, and 07:30 UTC. Buyers attempted to lift the price above $0.1720 a few times, but each push lacked strength. By 07:45 UTC, the KAIA Coin traded around $0.1713 with no clear momentum. MACD remained neutral, and RSI stayed below 50, showing indecision.
KAIA Coin Awaits Breakout After Range-Bound Action
The movement in KAIA Coin reflects a market caught between short-term volatility and broader indecision. Early breakouts and sharp channel formations gave traders a burst of action, especially with clear signals from RSI and MACD. But the second half of the session was dominated by a tight consolidation range between $0.1708 and $0.1720. Repeated KAIA Breakout attempts within this range lacked volume and follow-through. Despite several golden and death crosses flashing on the MACD, the price remained flat. RSI also failed to move out of neutral zones, confirming the loss of momentum.
As of now, the KAIA Price is holding around $0.1713 with no strong direction. A decisive move above $0.1720 or a drop below $0.1708 could break the deadlock. Until then, KAIA Coin may continue to trade sideways. Traders should watch for volume spikes and clean indicator signals to confirm the next move.


