

Are you tracking Kaspa’s price action and wondering what’s next after recent volatility? The Kaspa price has experienced sharp swings today, moving between key support at $0.10650 and resistance near $0.10800. After an early session breakout, the momentum faded, leading to mixed signals from MACD and RSI indicators. Now, KAS is consolidating in a narrow range, waiting for a clear breakout or breakdown. Let’s dive into the detailed price analysis to understand the current market structure and what traders should watch closely in the coming hours.
Kaspa (KAS) Price Analysis For May 25, 2025
The Kaspa price analysis shows a volatile but structured movement as KAS struggled to maintain momentum after a breakout early in the session. Price action kicked off with a strong drop inside a downward channel around 00:00 UTC, dipping toward $0.10550. This bearish slide triggered a MACD death cross and sent RSI into oversold territory, signaling selling pressure in the market.
By 01:00 UTC, the KAS price found short-term support and shifted into a sideways trading range between $0.10600 and $0.10690. A small KAS breakout attempt pushed price briefly higher but failed to sustain, and a quick downtrend followed. This pullback was mild, with RSI hovering around 40 and MACD crossing back into a golden cross just before 01:30 UTC.

Chart 1- KAS/USDT M1 Chart, Analysed By Anushri Varshney, Published on TradingView, May 25, 2025
From 02:00 UTC onward, Kaspa price bounced back into strength, forming an upward channel that carried the price from $0.10670 to $0.10840. This bullish leg came with consistent green candles, supported by a clear MACD golden cross and an RSI spike into the overbought zone near 70. This move confirmed bullish momentum and marked the most significant push of the day.
KAS Price Consolidates Below Resistance
However, after topping out near 03:15 UTC, KAS began retracing inside another downward channel, falling back toward $0.10620 by 04:00 UTC. RSI cooled off from the overbought region, dipping near 30 again, while MACD posted another death cross, showing that the bullish wave was losing steam.
From 04:30 UTC through the rest of the session, the Kaspa price entered consolidation, holding between $0.10650 and $0.10800 in a broad trading range. Momentum signals stayed mixed during this period, with multiple MACD crossovers and RSI floating in a neutral zone between 40–50. Buyers and sellers seemed to reach a temporary balance.
As of the final hours of today, KAS price trades around $0.10726, with no clear direction but strong support near $0.10650 and short-term resistance at $0.10800. The market awaits a decisive KAS breakout above resistance or a breakdown below support to confirm the next move.
KAS Price Awaits Breakout Confirmation After Volatility
The KAS price is currently stuck in a tight range after a day full of swings, and traders are watching closely for the next breakout. After testing both support and resistance zones multiple times, the Kaspa price seems to be stabilizing around $0.107. While short-term indicators like MACD and RSI have flipped frequently, they now suggest a pause in momentum. A clean KAS breakout above $0.10800 could open the door to fresh highs, especially if supported by volume and bullish crossover signals. On the downside, a break below $0.10650 may trigger renewed selling.
Overall, the Kaspa price is at a decision point, and the next 12–24 hours will be key. For now, traders should keep an eye on the current range, wait for confirmation, and watch how KAS reacts near those key levels before making strong directional bets. Patience may be the best play in this phase.
Kaspa (KAS) Price Analysis For May 31, 2025
The Kaspa price analysis shows a volatile structure with repeated swings, failed breakouts, and indecision from buyers and sellers. The session opened near $0.08420 and moved lower almost immediately. By 01:00 UTC, the KAS price fell sharply from $0.08420 to $0.08100. RSI dipped into oversold territory, and a golden cross formed on the MACD, signaling short-term support. Between 01:00 and 01:45 UTC, Kaspa moved sideways within a narrow trading range between $0.08100 and $0.08250. A brief KAS breakout was seen at 01:50 UTC as the price pushed above the range high.

Chart 2- KAS/USDT M1 Chart, Analysed By Anushri Varshney, Published on TradingView, May 31, 2025
By 02:00 UTC, KAS reversed into a downward channel. Selling pressure pulled the price back to $0.08120 by 02:40 UTC. A death cross on the MACD and a fresh RSI dip confirmed the weakness. Buyers returned near the lower support, and from 02:45 to 04:30 UTC, the Kaspa price climbed inside an upward channel. RSI hit overbought multiple times, and two golden crosses formed, lifting KAS to a local high of $0.08560. After 04:30 UTC, KAS failed to break above resistance and lost momentum. The price began to fade slowly and entered another sideways range from 05:00 to 06:45 UTC, stuck between $0.08180 and $0.08360.
KAS Price Stalls Below $0.084 After Failed Breakout Attempts
At 07:00 UTC, KAS made one last push upward. A golden cross and RSI reading above 59 hinted at strength, but the price only reached $0.08360 before getting rejected again. By 08:00 UTC, KAS remained inside the range, showing hesitation near resistance.
From 08:00 to 12:00 UTC, the KAS price stayed mostly neutral. Attempts to break $0.08350 failed as the MACD remained neutral and RSI hovered just under 60. Between 12:00 and 18:00 UTC, sellers slightly pushed the price back to $0.08210, but no strong trend followed. RSI moved near oversold at times, but support held. The market showed no clear direction, ending the session near $0.08350.
KAS Price Stuck in Range as Momentum Fades
The Kaspa price closed the session with no strong trend, despite early signs of bullish activity. A single KAS breakout above the $0.08250 resistance failed to hold, leading the price into a downward channel before recovering in an upward move. Still, that recovery was short-lived. The market slipped into a sideways structure for most of the second half of the day.
Indicators reflected this indecision clearly; MACD showed multiple golden crosses and death crosses, while RSI moved between overbought and oversold zones but failed to support any lasting direction. Price action between $0.08180 and $0.08360 acted as a key range, with sellers rejecting moves above $0.08360 several times. Until the Kaspa price breaks above $0.08400 or below $0.08150 with volume, the KAS price is likely to stay rangebound. Bulls need a clean breakout to shift the neutral outlook back to bullish.
Kaspa (KAS) Price Analysis For June 3, 2025
The KAS price analysis over the last 24 hours shows a day filled with back-and-forth action as bulls tried to push above the $0.0908 mark but were eventually rejected, leading to a downward shift in momentum. Early in the session, the Kaspa price was trading inside a clean upward channel, building strength from the $0.0890 zone. Buyers stayed in control until around 01:45 UTC, when KAS broke above the channel briefly and touched a high near $0.0908.

Chart 3- KAS/USDT M1 Chart, Analysed By Anushri Varshney, Published on TradingView, June 3, 2025
This KAS breakout was supported by a golden cross on the MACD and an overbought signal on the RSI, suggesting strong momentum at the time. Shortly after 02:00 UTC, the price reversed, and Kaspa entered a descending channel. Between 02:30 UTC and 05:00 UTC, the price dropped toward the $0.0890 region, while RSI dipped into oversold territory around 03:00 UTC. During this stretch, the MACD printed a series of golden crosses, but none were strong enough to change the trend. The Kaspa price remained under pressure, showing no real signs of recovery.
KAS Price Hits $0.0880 Low Then Recovers to $0.0890
A temporary relief rally kicked in around 05:00 UTC as KAS broke out of the downward channel and entered a sideways trading range between $0.0892 and $0.0902. This phase lasted until nearly 06:00 UTC. RSI hovered near neutral, and the MACD turned flat, showing that momentum had stalled on both sides. Bulls made a couple of attempts to reclaim $0.0905 but failed, and a fresh downtrend started soon after.
By 06:30 UTC, the Kaspa price had entered a sharper descending channel. MACD printed two death crosses during this drop, and RSI hit multiple overbought rejections before finally plunging into oversold territory again near 07:30 UTC. The lowest price of the day came around $0.0880.
A golden cross formed on the MACD just after 08:00 UTC, while RSI climbed from oversold to 64.30. Buyers pushed the price back near $0.0890, showing signs of strength after the extended dip. Support sits at $0.0880, with resistance at $0.0900 and $0.0908. The next move will likely depend on whether momentum indicators stay in favor of bulls heading into the next session.
Kaspa Price Rebounds From $0.0880 Low Eyes KAS Breakout Above $0.0900
The Kaspa price has shown clear signs of recovery after dipping to $0.0880 earlier in the session. Despite facing rejection from the $0.0908 level, bulls managed to regain control in the final hours, with the RSI rising and a golden cross forming on the MACD. This suggests that momentum is slowly tilting back in favor of buyers. A confirmed KAS breakout above $0.0900 could open the door for a retest of $0.0908 and possibly higher, but failure to hold above $0.0888 may bring back bearish pressure.
As of now, the KAS price is caught between a key support and resistance zone. Traders should watch for volume confirmation and trend continuation before entering. If bullish momentum continues, the Kaspa price could soon make another attempt at breaking its earlier high. However, caution is advised if the price slides back into the lower channel range below $0.0885.
Kaspa (KAS) Price Analysis For June 8, 2025
The KAS price analysis shows a structured but bearish trading session. The Kaspa price moved inside three major channels—one upward and two downward—while momentum indicators confirmed consistent selling pressure. Despite multiple attempts to bounce, no strong KAS breakout was confirmed. The day opened at around $0.0848. At 01:30 UTC, the price stayed neutral with no real direction. MACD lines hovered near zero, and RSI dipped briefly into the oversold zone near 00:45 UTC. This was followed by a slow shift in momentum.
From 01:30 to 02:15 UTC, the Kaspa price moved into a clean upward channel. It climbed from $0.0847 to $0.0887 in less than an hour. RSI peaked near 70, while MACD printed a golden cross at 02:00 UTC. By 02:15 UTC, the trend flipped. A wide downward channel formed and pulled the KAS price from $0.0887 to $0.0860 by 04:00 UTC.
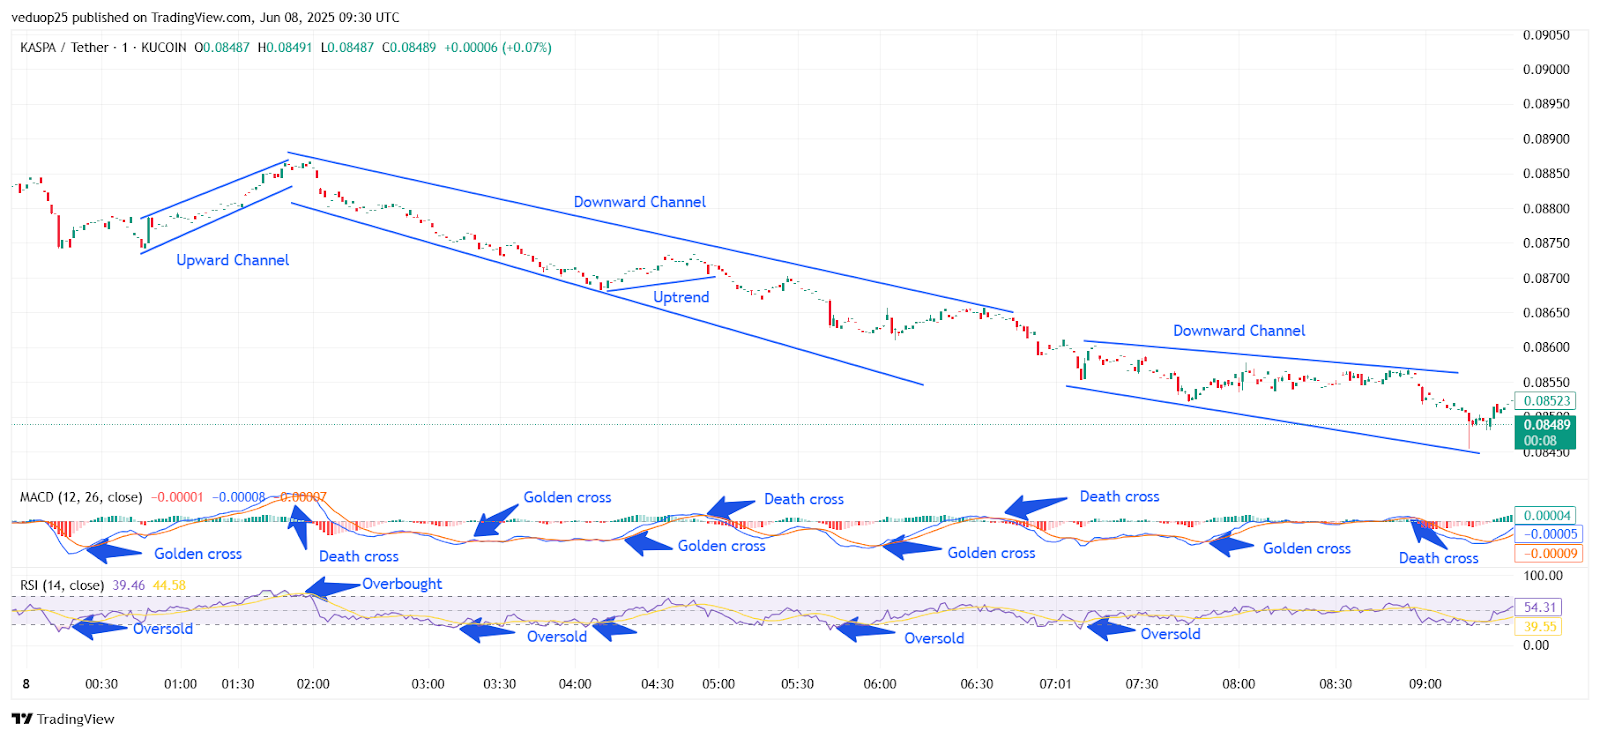
Chart 4- KAS/USDT M1 Chart, Analysed By Anushri Varshney, Published on TradingView, June 8, 2025
MACD gave a death cross at 02:45 UTC, and RSI dropped below 40. Selling pressure dominated this stretch. Between 04:00 and 05:00 UTC, a mild recovery took place. KAS moved inside a small uptrend, reaching $0.0869. MACD flashed a golden cross again around 04:30 UTC, and RSI briefly touched 60. However, this bounce lacked momentum and was rejected near resistance.
KAS Price Slips to $0.0843 Amid Bearish Channels and Weak Recovery Attempts
From 05:00 to 07:00 UTC, a second downward channel began. Price dropped steadily from $0.0869 to $0.0853. MACD printed two death crosses—one near 05:15 UTC and another close to 06:15 UTC. RSI entered the oversold zone more than once, showing strong bearish control.
The final major move came from 07:00 to 09:00 UTC. A fresh downward channel pulled the KAS price to a low of $0.0843. Multiple golden and death crosses appeared, but RSI remained stuck under 40, showing no signs of strength. In the final 30 minutes, the KAS price managed a small push upward from $0.0843 to $0.0849. But this move was too weak to be called a confirmed KAS breakout.
Kaspa Price Still Under Bearish Pressure Despite Minor Bounces
The overall momentum for the KAS price on June 8 stayed tilted toward the downside. While the Kaspa price attempted a brief recovery during the early and mid-session hours, all upward movements failed to hold. The KAS breakout near 02:00 UTC was quickly sold into, and the price entered two strong downward channels afterward. MACD repeatedly showed death crosses, and RSI entered oversold territory multiple times, both confirming the lack of bullish strength.
Even the final upward move near 09:00 UTC lacked volume and conviction, keeping the price capped under $0.0850. Until bulls push KAS above the $0.0855 level and sustain it, the short-term structure will remain bearish. For now, Kaspa traders should remain cautious, with support sitting near $0.0840 and resistance near $0.0855. A strong KAS breakout above the latter could change the trend.


