

Are you closely tracking the KAVA Price and wondering if now is the right moment to buy or accumulate the KAVA Token? You’re in the right place. The recent KAVA price movements will receive a thorough analysis to understand what technical indicators predict for market participants. During past strong KAVA price phases, the market experienced defined downward movement but traders regularly made unsuccessful KAVA breakout attempts against increasing regression. Movements of volatility persist alongside conflicting momentum signals therefore traders should know the positions of key support and resistance points. An examination of the KAVA chart will reveal technical insight into upcoming movements based on its current data.
KAVA Price Analysis For May 4, 2025
The KAVA started its session with bearish sentiment because a descending price channel formed and guided the price movement from beginning to end. The MACD indicator registered a golden cross exactly when the RSI reached its oversold zone at 03:00 UTC. Market signals from this combined technical analysis pattern usually indicate a brief market correction that may generate some relief. The market started to sell off shortly after a death cross emerged in the MACD near 06:00 UTC. This period observed price movement limited to the declining channel because sellers continuously held and protected the upper trendline from any significant price movement.

Chart 1- KAVA/USDT M5 Chart, Analysed By Anushri Varshney, Published on TradingView, May 4, 2025
The session demonstrated consistent adherence to the downward channel characteristics by KAVA. During UTC hours 09:00 to 10:00, the MACD generated yet another golden cross together with RSI reaching the overbought area yet briefly showing a possible bullish trend. The price attempt to break through resistance at the channel failed rapidly leading the market to its previous course. During this period KAVA experienced multiple brief activation phases which quickly encountered strong sell-offs at the upper limit of the channel thus demonstrating weak support for buying pressure. The price exhibited a choppy movement which intensified because MACD and RSI generated conflicting buy and sell indications that failed to create an apparent directional trend.
KAVA Stuck Between $0.4130 Support and $0.4400 Resistance
Multiple RSI readings within the oversold zone around 09:30 and 11:00 UTC engaged the essential support area of $0.4130–$0.4150 to restrain the downward market movements. Golden crosses on the MACD emerged during each defense attempt at this support zone therefore creating limited upward movements. The price rebounded against each upper channel trendline which stopped any substantial upward movement from happening. Technical market analysis strengthened these support and resistance areas through repetitive testing attempts because the price could not breach them making these points highly important during widespread market indecisiveness. Market participants kept a lookout for clear directional trading signals before making any firm decisions.
The market session concluded at 11:41 UTC while KAVA maintained its position in the descending channel zone as the latest MACD golden cross pointed toward another resistance test attempt. The price movement emerged neutral and bearish throughout this period because traders kept holding between predefined support levels and resistance regions. KAVA price needs to break through the $0.4400 resistance before any tradable direction emerges and traders will experience continued price volatility inside the $0.4130–$0.4400 price zone. A clear movement above resistance elevation or a downfall below the support level would create a new directional trend for the KAVA token.
Will a Breakout Decide the Next Trend?
The KAVA technical outlook shows equal chances between additional consolidation and a price escalation. The trading conditions will stay unpredictable because the KAVA Price stays trapped inside its established downward trading zone. The several golden crosses combined with oversold RSI readings near $0.4130–$0.4150 support indicate buying interest at lower levels although failure to break through the $0.4380–$0.4400 resistance area shows continuous selling pressure remains. If KAVA breakout occurs decisively out of the resistance zone and channel, it will provide a robust indication for approaching $0.4500 along with additional higher levels. A successful violation below the primary support might quicken the selling force which would lead the KAVA Token toward fresh all-time lows.
KAVA Price Analysis For May 23, 2025
The KAVA price analysis over the last 24 hours shows a clear mix of trading ranges, trend shifts, and channel breakdowns. The day opened near $0.418, holding a tight range into the early morning. By 03:45 UTC, the KAVA token stayed mostly flat, forming a mild uptrend within a sideways zone. Two golden crosses appeared on the MACD around 00:30 and 02:15 UTC, while RSI showed oversold conditions early on. The price slowly climbed toward $0.432 by 03:30 UTC.
At 03:45 UTC, KAVA broke out of the range but to the downside. A strong bearish move followed, taking the price into a steady downtrend. A death cross confirmed this momentum at 04:20 UTC. The KAVA price dipped to $0.424 by 05:00 UTC. A short golden cross and an oversold RSI reading at 05:15 hinted at a brief recovery. The price moved back toward $0.429 by 05:45 UTC but remained inside a falling structure.
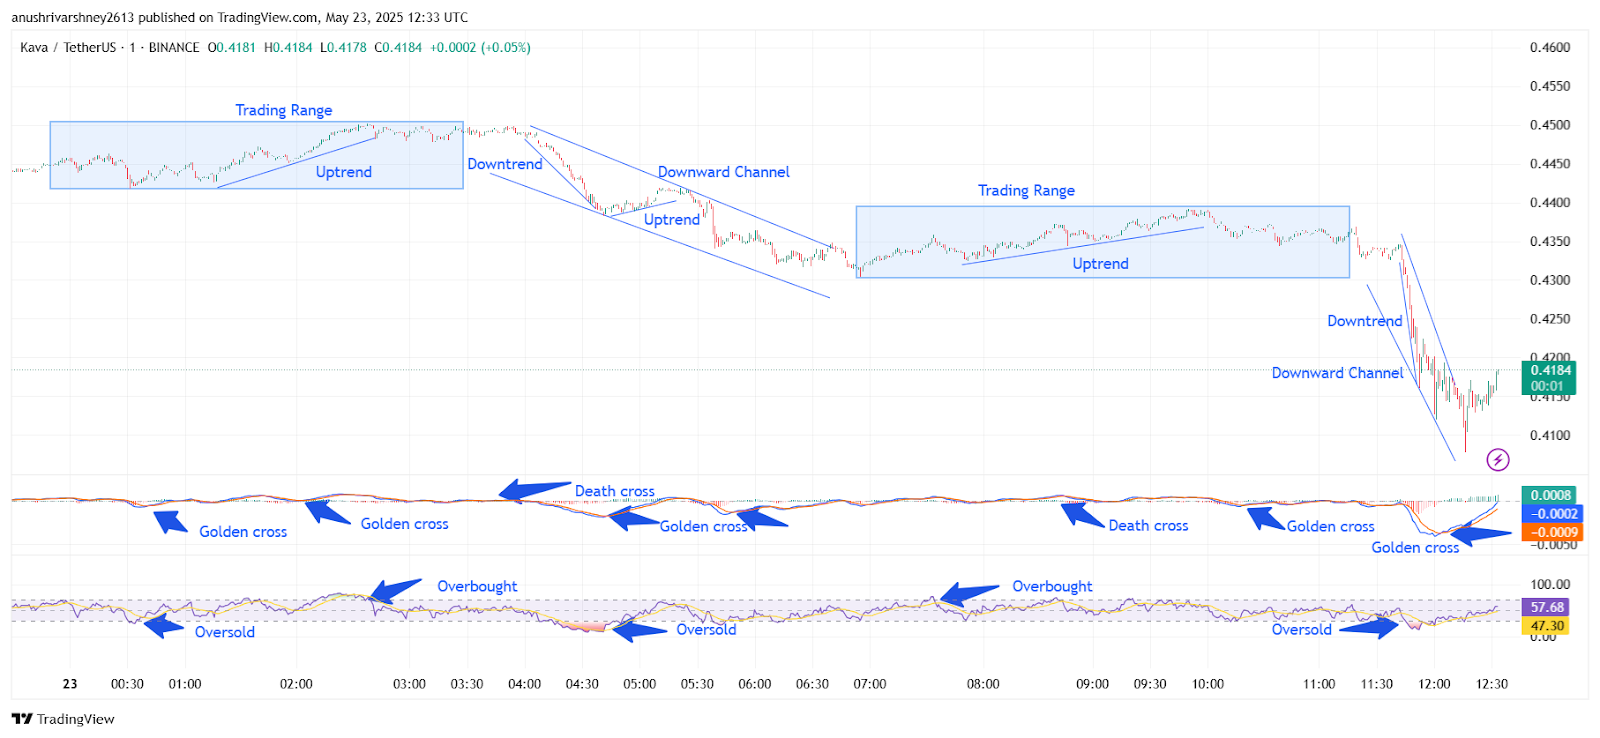
Chart 2- KAVA/USDT M1 Chart, Analysed By Anushri Varshney, Published on TradingView, May 23, 2025
From 05:45 to 07:00 UTC, the KAVA token formed a downward channel. Buyers failed to reclaim momentum even with a golden cross at 06:10 UTC. The price slowly dropped with lower and lower highs, eventually bottoming near $0.422. A shift came after 07:15 UTC as KAVA began forming another trading range. From 07:30 to 10:00 UTC, the price started to move gradually higher during this period sideways while also being supported by an uptrend from $0.423 to $0.439. The RSI topped overbought levels at 08:20 UTC and 09:30 UTC. This signaled bullish exhaustion, and a death cross appeared at 10:00 UTC.
KAVA Drops from $0.437 to $0.411, Recovers Near $0.418
By 10:15 UTC, the KAVA price entered a sharper downtrend. The price dropped from $0.437 to $0.411 in a strong downward channel. RSI fell to oversold at 11:30 UTC and again at 12:15 UTC, confirming panic selling. A golden cross formed at 12:20 UTC, and it is reasonable to expect support. Between 12:30 and 14:00 UTC, KAVA showed signs of stabilization. Buyers pushed the price back to $0.418. It moved sideways for hours, forming a base near $0.419.
The next push came at 16:45 UTC when the KAVA price spiked briefly to $0.426 before falling again. This short-lived KAVA breakout lacked strength and quickly reversed. From 17:00 UTC until the final candlestick at 18:00 UTC, the price hovered between $0.417 and $0.419. KAVA closed near $0.418 after a volatile day of fake breakouts, trend swings, and short-term recoveries.
KAVA Price Struggles to Hold Ground After Sharp Swings
The KAVA token ended the day with high volatility but little real progress. Despite multiple golden crosses and short uptrends, the KAVA price failed to maintain any breakout. Two separate trading ranges were seen, both leading to steep breakdowns. The most substantial drop occurred after 10:15 UTC, when the price collapsed from $0.437 to $0.411 inside a clear downward channel. Oversold RSI levels and a late golden cross triggered a weak recovery. But even that faded by evening. The brief KAVA breakout at 16:45 UTC couldn’t hold above $0.426 and was quickly sold. Price action is stuck below resistance, with no clear momentum from buyers or sellers. Traders should watch for a confirmed close above $0.426 or below $0.410 to spot the next move.
KAVA Price Analysis For June 13, 2025
The KAVA price analysis highlights sharp swings, breakout moves, and tight ranges across key intraday sessions. The KAVA price traded between $0.3950 and $0.4350, with clean trends and reactions to MACD crossovers and RSI signals. The day started with a quick uptrend. Between 00:15 and 00:45 UTC, the KAVA token jumped from $0.3970 to $0.4070. RSI hit the oversold zone just before the rally, while MACD gave a golden cross. The momentum stayed strong into the next leg. From 00:50 to 01:10 UTC, a sudden KAVA breakout pushed the price to $0.4140.
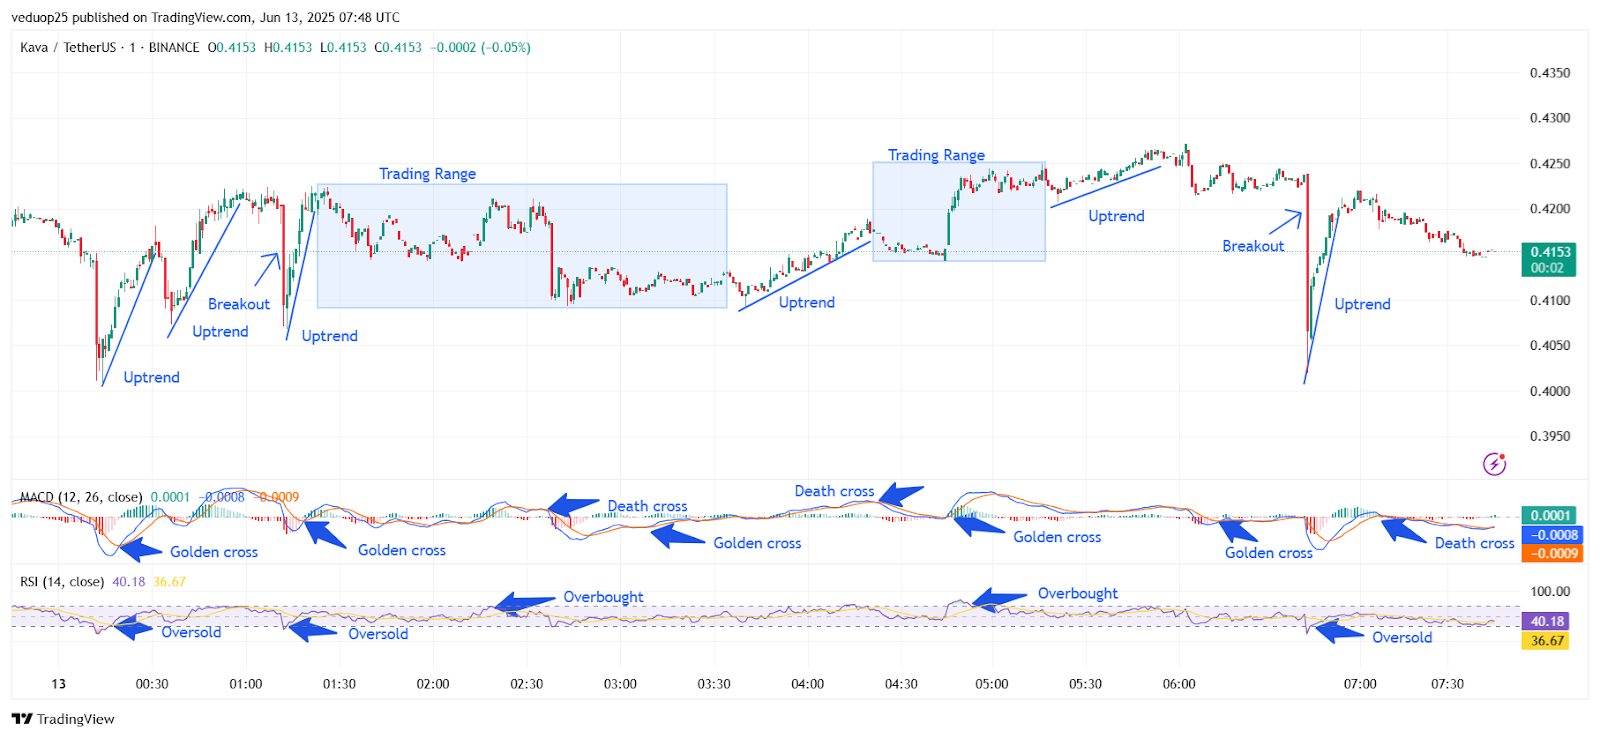
Chart 3- KAVA/USDT M1 Chart, Analysed By Anushri Varshney, Published on TradingView, June 13, 2025
However, a short pullback soon dragged the price down to $0.4060 by 01:30 UTC. Between 01:30 and 02:45 UTC, the KAVA price fluctuated within a sideways zone, ranging from $0.4060 to $0.4120. RSI hovered near neutral, and MACD flipped sideways. At 02:45 UTC, a weak drop took the price to $0.4030, but buyers stepped back in. A fresh trend began at 03:00 UTC. The KAVA token moved up from $0.4030 to $0.4180 by 04:15 UTC. The chart showed a golden cross, while RSI gradually climbed. This trend remained steady until a slight dip began.
KAVA Breakout Fades After Sharp Spike Near $0.4285
Between 04:30 and 05:00 UTC, the price entered another tight box near $0.4165 to $0.4195. RSI reached the overbought zone, and MACD gave a quick death cross. A sharp KAVA Breakout followed at 05:15 UTC. Price shot up from $0.4180 to $0.4285 within minutes. The MACD flipped bullish again, and the RSI touched overbought levels. However, this breakout failed to hold. From 05:45 to 06:15 UTC, the price reversed quickly, falling to $0.4140. At 06:30 UTC, the KAVA Price attempted one last spike to $0.4195. But by 07:00 UTC, sellers dragged it back below $0.4100.
RSI moved back toward oversold, and MACD gave a final death cross. The day ended with a small downtrend, closing near $0.4150. Overall, the KAVA token showed high intraday activity with clear levels and sharp moves. MACD gave strong entry-exit signals, while RSI confirmed overbought and oversold points. If bulls protect the $0.4100 zone, another KAVA breakout may follow. However, below this support, more downsides could unfold.
KAVA Token Struggles to Hold Breakout Gains
The KAVA token showed strong volatility with multiple breakout attempts and clean trend reversals throughout the session. The most significant KAVA breakout came at 05:15 UTC, where the price surged from $0.4180 to $0.4285. However, this move failed to sustain as selling pressure returned quickly. RSI consistently confirmed both overbought and oversold zones, while the MACD gave timely golden and death crosses, helping to track momentum shifts.
By the end of the session, the KAVA price had settled near $0.4150, with the final hours dominated by a downtrend. The $0.4100 support remains key to watch in the next session. If the Bulls manage to hold this line, the KAVA token could attempt another push higher. Conversely, if sellers gain control below $0.4100, it could trigger another wave of correction. For now, momentum remains mixed with short-term risks tilted to the downside.


