

Are you watching KAVA and wondering where the token could be headed next? Then you’re in the right place. Let’s take a closer look at the recent KAVA price performance and assess what the charts are revealing. The day began with a sharp 8.5% crash, pulling the token into lower support levels. While KAVA showed some signs of recovery shortly after, the bounce lacked strong momentum. The token faced resistance early during its climb, and the KAVA trend quickly reversed back to its earlier lows. With bearish pressure still present and recovery attempts fading, traders are watching closely to see whether this support zone can hold. Let’s dive into the technical indicators to see what’s next for the KAVA price.
KAVA (KAVA) Price Analysis for May 11, 2025
KAVA began the session with some early fluctuations, going up to $0.5050 and returning to $0.4920. At this point, a steady upward channel followed, with KAVA climbing to $0.5085, testing the resistance. This gradual rise was supported by consistent golden crosses on the MACD and neutral RSI conditions. A sudden spike followed, pushing the price to $0.4905, briefly exiting the channel. However, the RSI flashed overbought at this point, suggesting bullish exhaustion. The MACD formed a death cross shortly after, and KAVA sharply reversed.

KAVA/USDT, M-5 Chart, analyzed by raodevansh18, published on TradingView, May 11, 2025
The death cross instigated a steep drop, and the KAVA price fell rapidly to $0.4666, marking an 8.5% decline. The RSI plunged into oversold territory during this crash, indicating an aggressive bearish trend. The MACD indicator turned negative, further confirming the breakdown. Around $0.4700, KAVA found strong support, and the RSI began recovering. A golden cross soon formed on the MACD, and the bulls responded with a steady climb. A new upward channel developed, and the price gradually advanced from $0.4730 to $0.4920. The KAVA trend was supported by multiple MACD golden crosses, keeping the bullish momentum alive.
Some reversal came at 18:30 UTC, but the price continued to rise with the narrow golden cross on the MACD. As KAVA approached the $0.5035 resistance zone, the RSI once again hit overbought levels. Some fluctuations occurred, and KAVA ended the day at $0.5005.
KAVA Drops to $0.4700 Support Again on May 11
The oversold RSI hinted at potential bullish exhaustion early today. At the same time, the MACD featured a death cross, marking the weakening momentum. The price began to squeeze into a symmetrical triangle pattern before a downward KAVA breakout unfolded. The KAVA breakout led to another sharp decline, dragging the KAVA price back to $0.4700, nearly retesting the previous support. RSI fell below the midline, and the MACD showed a growing bearish gap. Yet again, bulls stepped in to support. The RSI bounced back from oversold, and another golden cross emerged on the MACD, fueling a mild recovery. KAVA has since climbed to $0.4840, forming a fresh upward trend.
KAVA Bounces Off of Support, Investors Cautiously Bullish
As of now, it appears that KAVA’s uptrend is stabilizing near the $0.4840 mark. If this stability leads to a bearish trend, then strong retests of the support level may ensue. The bulls must manage a break above $0.4900 for the trend to continue. If consistent retests occur, the $0.4700 may give in, and an extended bearish trend may start for KAVA.
KAVA (KAVA) Price Analysis for May 15, 2025
The KAVA price action in the last 24 hours has had a bearish outlook. The movements have been heavily range-bound, with KAVA occasionally falling to a lower range. This has painted a slow bearish trend on the 5-minute chart. The KAVA token started trading at a price of $0.4735 yesterday. With a death cross on the MACD indicator, the price fell sharply early on, going to $0.4630. The RSI spiked into the oversold region with this drop, and KAVA quickly mustered a sharp comeback, going up to $0.4708 by 1:10 UTC.
KAVA/USDT, M-5 chart, analyzed by raodevansh18, published on TradingView, May 15, 2025
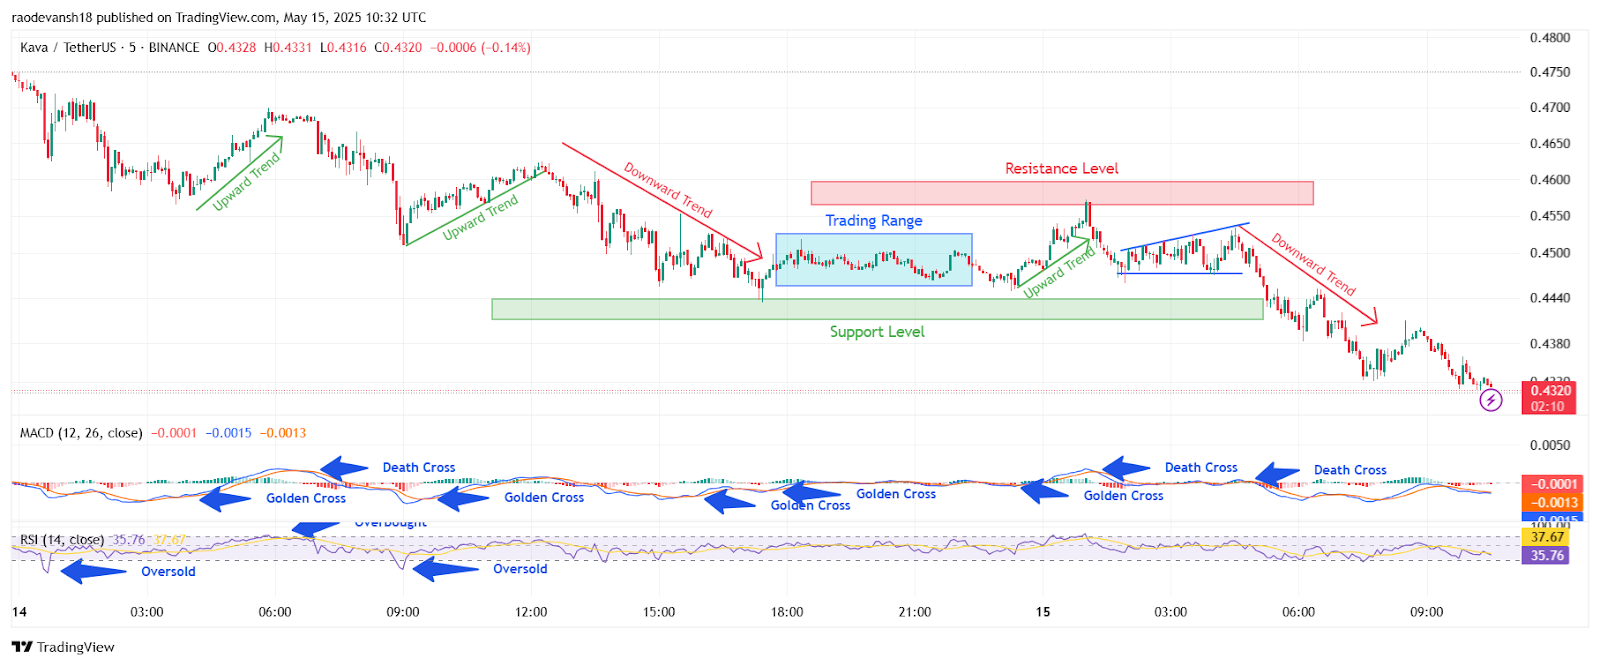
Some fluctuations occurred at that level, but the bears continued their run with the 01:50 UTC death cross. The price slumped to $0.4595 immediately, slowly trending downwards to $0.4568 by 03:40 UTC. Around the same time, the golden crossover on the MACD widened, and a stable uptrend formed, as the KAVA price rose to $0.4699 by 5:50 UTC. Again, some sideways consolidation occurred, and the bears soon gained control by 7:00 UTC. At 7:00, the price fell to $0.4637 at first, forming a downtrend right after, going to $0.4621. The price slumped again, going to $0.4509 by 9:00 UTC.
KAVA Falls to $0.4440 Support, Musters Some Bullish Strength Late
The RSI was oversold, making the conditions ripe for a bullish reversal. An uptrend did form at this point, but could only take the price to $0.4625. Soon, a bearish reversal occurred, and an extended downtrend followed. This downtrend led the price down to $0.4440 by 17:20 UTC. The RSI dipped into the oversold regions on multiple occasions, but could only validate weak, brief reversals. KAVA saw some support at this level and tried to rebound from it. However, the upward movement was capped at $0.4505. A trading range formed as neither the bulls nor the bears seemed interested enough to push a concrete directional movement.
A downward KAVA breakout from this trading range was observed, and the price slipped to $0.4450 by 23:20 UTC. A golden cross formed at this point, corroborating an uptrend that would continue on the next day. As of midnight, the KAVA price stood at $0.4478.
KAVA Faces Sharp Resistance at $0.4570, Undergoes Strong Reversal
The bullish trend from yesterday continued to push the prices up on May 15. However, the uptrend met a strong ceiling at $0.4570. The KAVA price refused to rise further, and soon, declined to $0.4462. Another trading range occurred at this point. An expanding triangle formation formed as the price touched higher highs and lower lows. While some investors expected a bullish turn, a downward KAVA breakout was observed.
This downturn led the price into a steep decline, and the price fell to $0.4332. It is worth noting that despite the considerable downtrend, the RSI has not yet definitively pushed into the oversold region. A slight reversal was seen, with the price going up to $0.4400 again, but another bearish turn has led the price down to $0.4319 as of the last update.
Bears Continue to Dominate, Can KAVA Price Find a Bottom Soon?
Despite remarkable downturns, the RSI has stayed above the 30 level. This means that the sell-off may have just begun. If that is true, dramatic falls may occur until the KAVA finds a base to rebound off of. As of now, it looks like KAVA token is poised to slump as low as $0.4200. If it finds a base above that, it will be slightly positive news for the bulls. If a break below $0.4200 occurs, the sell-off may intensify.


