

Are you thinking of investing in Chainlink’s native token LINK? The LINK price has been on a rollercoaster lately, with the market swinging between key support and resistance levels. LINK stumbled momentarily below $14.40, which led to some buying interest and a slight recovery. However, the $15.10 price action is still a significant barrier to bull momentum. The price has shown signs of indecision, so traders will watch to see if LINK can break through that price barrier. Let’s dive into what the charts tell us about the Chainlink token’s next potential moves.
Link Price Analysis of 28th April, 2025
The LINK Price opened on April 27 with bearish momentum, entering a sharp downward channel that pushed the price to a low of $14.48 around 07:10 UTC. The RSI indicator hovered around the oversold zone during this drop, while the MACD displayed consistent bearish momentum. Despite this selling pressure, the Chainlink token found temporary support above $14.40 and attempted a minor recovery. Instead, the price quickly stabilized within a sideways channel between $14.68 and $14.40, keeping it a consolidative structure up to approximately 17:00 UTC.

Chart 1, Analyzed by Alokkp0608, published on April 28th, 2025.
After the sideways phase, the LINK transitioned to an upward channel beginning near 17:20 UTC, which had increasing buying pressure. The RSI moved out of the oversold territory into a neutral range between 50 and 60, suggesting improved sentiment. MACD lines attempted minor bullish crossovers during this phase, though momentum remained moderate. LINK climbed towards $14.82 by 22:00 UTC, encountering intermediate resistance near $14.80. Failing to extend higher, the price entered another downtrend channel, signaling exhaustion in buying interest before the day’s close.
As April 28 began, the downtrend persisted, pushing LINK briefly below the critical $14.35 support level around 01:45 UTC. The RSI again approached the oversold region between 30 and 40, and the MACD showed continued bearish crossings. However, bulls quickly regained control, forming an ascending channel from 02:05 UTC. This rally helped the prices reclaim lost ground, gradually approaching the key resistance level at $15.10 for a sustained LINK breakout. Buyers demonstrated stronger momentum during this recovery, consistently keeping the price above short-term moving averages.
LINK Price Outlook – What’s Next for Chainlink?
Currently, LINK is hovering close to the $15.10 resistance mark as of 07:30 UTC, facing stiff selling pressure. A successful LINK breakout above $15.10 can create momentum to rise to $15.30 and then to $15.50. However, if resistance is at $15.10, LINK could fall back to immediate support zones around $14.80 and then $14.60. The RSI is approaching the overbought area between 65 and 70, and the MACD is printing signs of bullish exhaustion, so attentiveness is advisable. Traders should watch a potential breakout attempt to the upside at or above $15.10 to see which direction LINK’s direction subsequently moves.
LINK’s Next Move – Will the Breakout Hold?
As the LINK price is trading close to $15.10, we should be on the lookout for a potential breakout. If the bulls continue to push higher upon breaching $15.10, we may see LINK move toward its following potential levels of $15.30 and $15.50. If resistance holds, I expect LINK to pull back down into support levels around $14.80–$14.60. Exercise caution with RSI nearing overbought levels and the MACD appearing to decrease momentum. A break above $15.10 may entice traders to push; however, if we cannot break this level, we might see LINK consolidate again. Watch these key levels for the next significant move.
Chainlink Price Analysis of April 30th, 2025
The LINK price action on a 5-minute chart on April 29, 2025, opened with strong bearish sentiment. By around 01:15 UTC, the price entered a defined downtrend channel, slipping from the $15.20 zone and reaching $14.87 by 05:50 UTC. MACD showed a death cross near 03:00 UTC, which aligned with momentum fading. RSI briefly touched overbought at the start, then fell sharply toward oversold, confirming bearish pressure. After reaching the lower end of this channel, the Chainlink token attempted to recover, climbing close to the $15.20 mark again. However, renewed selling emerged, forcing the price into a very tight sideways structure between $15.10 and $14.95 until roughly 11:20 UTC.

Chart 2, Analyzed by Alokkp0608, published on April 30th, 2025.
Following the consolidation phase, LINK price re-entered a pronounced downtrend channel that extended for several hours. The price declined in phases from approximately $15.00 area to the $14.60 vicinity from approximately 11:20 UTC to approximately 17:05 UTC. MACD made several death crosses of note (after 12:00 UTC and 15:45 UTC) that further contributed to downward impulsiveness. RSI dipped into oversold territory several times, suggesting buyers were not confidently stepping in. An attempted LINK recovery began at 13:55 UTC, but momentum lacked strength, and the sideways drift from 15:30 to 17:05 UTC showed indecision without breaking above key levels.
Key Rejections and Strong Support Test
From 17:05 UTC onward, a temporary LINK recovery pushed the price to $15.00 by 19:00 UTC, though the move lacked follow-through. Failing to break the resistance range between $15.00 and $15.10 led to a renewed bearish wave. A decisive selloff resumed post-19:00 UTC, continuing the broader downtrend channel. By 23:15 UTC, LINK price had tested the critical support level at $14.50, forming a localized bottom. During this time, MACD had turned strongly negative with a death cross after a failed golden cross attempt earlier. RSI again entered oversold territory, reflecting extreme bearish sentiment near the support zone.
The April 30 trading session began with the price hovering just above the support level of $14.50. From 00:00 UTC to around 03:00 UTC, LINK price experienced short-lived up and down swings. While it managed to rise slightly toward $14.70 at times, it failed to retest the $15.00 mark, indicating weak bullish conviction. MACD showed a golden cross during this period, yet the histogram remained flat, suggesting a lack of strong momentum. RSI hovered between oversold and neutral, with buyers struggling to gain control. The price action moved within a tight range above support, reinforcing the idea of continued pressure without a decisive breakout.
Link Price Outlook – What’s Next for Chainlink Token?
The chart’s most recent portion shows LINK’s price maintaining its position just above the key support at $14.50, as of 07:45 UTC. There were a few modest attempts to push higher toward $14.65–$14.70, but sellers consistently overwhelmed those efforts. The RSI has slipped again near oversold territory, and MACD recently formed another death cross, signaling fading momentum. Despite multiple golden crosses over the last 12 hours, none held strength for long. The price remains stuck in a weak sideways structure, unable to reclaim even $14.80, making a bearish continuation more likely unless a volume-driven reversal emerges.
Bearish Continuation Threatens Key Support Zone
LINK Price remains under significant bearish pressure, and unless a clear breakout above $14.80 or ideally $15.00 occurs, the price could revisit or fall below the $14.50 support. Momentum is weak, with MACD producing frequent but unreliable golden crosses and another fresh death cross confirming seller control. RSI repeatedly hovers near oversold, hinting at potential for rebound but no follow-through so far. The $15.10–$15.20 area remains the key resistance, while $14.40–$14.50 is crucial support. If this support breaks, the Chainlink token may target $14.20 next. For now, sellers dominate, and LINK recovery chances appear slim without a strong volume surge.
Chainlink (LINK) Price Analysis of May 2, 2025
The LINK price action on a 5-minute chart over the past 24 hours began with a continuation of a strong upward trend established in the early hours of May 1. After a LINK breakout above $14.55 around 04:55 UTC, this level flipped into a key support level. Price climbed steadily within an uptrend channel, reaching as high as $15.05 by around 11:00 UTC. The move was supported by a golden cross on the MACD near 06:00 UTC and a steady climb in RSI into overbought territory multiple times, indicating strong short-term bullish momentum during this up-leg.
Chart 3- Analyzed by Alokkp0608, published on May 2nd, 2025.

Following the rejection from $15.05, Chainlink token retraced sharply to around $14.70 by 14:00 UTC, marking the start of visible short-term weakness. Despite this pullback, buyers tested the resistance zone near $15.00 from 15:00 to 21:00 UTC in multiple attempts. RSI hit overbought conditions during this range, but momentum faded with each retest. MACD turned neutral to slightly bearish, showing two minor death crosses near 18:00 UTC and again around 20:00 UTC. These signals suggested buyer exhaustion and the formation of a temporary top under the resistance ceiling.
Failed LINK Breakout Attempts Signal Bullish Fatigue
Between 21:00 UTC and the start of May 2, LINK price entered a sideways path with a downward bias, ultimately slipping below $14.80. Price hovered between the $14.70 support region and the $15.00 ceiling but showed signs of weakness in maintaining bullish structure. MACD during this time was marked by decreasing histogram strength and a lack of bullish crossovers. RSI also trended lower, mainly in the middle range without pushing to extremes, reflecting indecisive sentiment. The failure to establish new highs on repeated Resistance Level tests added to bearish pressure heading into the new trading day.
After the sideways action overnight, Chainlink token price briefly rebounded during the early hours of May 2, reaching up to $15.00 again by 03:00 UTC. However, another sharp rejection from that resistance confirmed the strength of sellers at that level. This began a descending channel toward the key $14.55 support. By 06:00 UTC, the price steadily declined under lower and lower highs. The MACD confirmed bearish momentum with another death cross, while the RSI dropped below 40, approaching oversold conditions as selling pressure intensified.
Bearish Push Toward Support as Buyers Step Back
Most recently, the Chainlink token continued sliding lower after failing to hold above $14.70. The LINK price action moved downward toward the $14.55 support zone with increasing bearish momentum. MACD remains in a bearish crossover with a widening gap, and the histogram shows negative strength building. RSI has now dipped close to oversold levels again, indicating weakening buyer interest and rising downside risk. LINK may continue probing the $14.55 level without any bullish divergence or recovery signs. A clean breakdown here could open the path to lower zones around $14.40 if no reversal emerges soon.
LINK Price Struggles to Hold Ground Under Persistent Resistance
LINK’s short-term outlook remains bearish as repeated rejections from $15.05 have weakened upside momentum. The support at $14.55 is critical; if broken, the next level to watch is $14.40. Momentum is tilted downward, with RSI nearing oversold levels and MACD in a firm bearish crossover. LINK Price behavior shows no sustained bullish pressure, and recovery attempts lack conviction. The downtrend may extend if bulls reclaim $14.70 quickly and push above $15.00, confirming a LINK breakout with volume. Short-term traders should monitor for any bullish divergence or reversal near $14.55 for possible entry.
Chainlink (LINK) Price Analysis of May 06th, 2025
The LINK price action over the last 24 hours shows an initial steep decline followed by a series of range-bound movements. After opening above $13.90, prices quickly fell into a downtrend channel, dipping below $13.70 by 08:00 UTC. Momentum weakened sharply during this stretch, with the RSI dropping toward oversold territory and MACD showing a death cross just after 08:00 UTC, confirming downward pressure. This initial descent set the tone for the rest of the session, establishing $13.67 as a key mid-day low before entering a more gradual descending structure.

Chart 4- LINK/USDT M5 Chart, Analyzed by Alokkp0608, published on May 6th, 2025.
Between 10:00 UTC and 16:00 UTC, LINK price moved inside a descending trading range, hovering between $13.84 and $13.52. This sideways-sloping behavior reflected traders’ indecision and no clear LINK market trend, with both RSI and MACD offering mixed signals. The RSI briefly entered oversold territory near 12:30 UTC, while MACD formed a golden cross shortly afterward, hinting at possible support forming near the $13.50 level. Despite short rebounds, momentum remained weak, and no strong bullish breakout was seen during this stretch. The market looked content, consolidating its earlier losses.
Bulls and Bears Wrestle Within Tight Boundaries
From 16:00 UTC through to 00:00 UTC on May 6, LINK price shifted into a broader horizontal range bounded by the resistance at $13.85 and support at $13.40. Chainlink token oscillated between these levels multiple times, with rejection near $13.80 followed by sharp pullbacks close to $13.45. This confirmed a short-term sideways path driven by intraday LINK market trend shifts rather than clear trend conviction. RSI tested oversold zones twice, and MACD continued alternating between golden and death crosses, showing frequent but weak trend shifts.
Between 00:00 UTC and 03:00 UTC, volatility spiked as LINK price once again approached support near $13.40 but failed to break lower. A brief RSI oversold condition around 01:45 UTC marked a local bottom, followed by another golden cross on the MACD around 02:00 UTC, which helped fuel a modest price recovery. The bounce, however, did not carry enough strength to break above $13.65, keeping the overall bias neutral within the defined trading range.
Consolidation Takes Over in Early May 6 Trading
In the final part of the session leading into May 6, 07:00 UTC, Chainlink token settled into a narrow sideways path just under $13.60. The price showed little inclination to test either the resistance at $13.85 or the support at $13.40, signaling trader hesitation and low volume conditions. RSI hovered near the midline without any significant peaks, while MACD flipped to a fresh death cross just after 06:00 UTC, underscoring the lack of bullish drive. This quiet, directionless behavior suggests a wait-and-see stance from both bulls and bears going into the next trading session.
LINK Price Awaits Breakout as Momentum Flattens
LINK currently trades at $13.60, maintaining a neutral tone after 24 hours of confined price swings. Momentum is indecisive: MACD shows alternating signals with a recent death cross, while RSI is hovering near 52, reflecting a lack of dominance from either side. Support remains strong near $13.40, while resistance around $13.85 continues to hold back upward attempts. A break of either boundary could trigger the next directional move. If momentum builds above $13.65 with bullish confirmation on MACD, LINK price may challenge $14.00; otherwise, downside risk toward $13.30 remains if support fails. Until then, consolidation is likely to persist.
Chainlink(LINK) Price Analysis of May 8th, 2025
The Chainlink price action over the last 24 hours exhibits a strong transition from bearish consolidation to a bullish breakout trend. Between 09:00 and 12:00 UTC, LINK moved within a declining pattern, forming a shallow downtrend channel that tested the $13.50 support level around 16:30 UTC. RSI entered oversold territory three times during this interval, signaling temporary exhaustion before each short-lived bounce. Meanwhile, MACD triggered a death cross after 12:00 UTC, confirming bearish control during the mid-day slump. However, the price did not breach the $13.40 base, indicating strong demand interest at lower levels.

Chart 5- LINK/USDT M5 Chart, Analyzed by Alokkp0608, published on May 8th, 2025.
From 18:00 to 21:00 UTC, LINK price flattened out into a sideways path, trading in a narrow range between $13.60 and $13.90. This stabilization followed the bounce off the $13.50 support and was marked by several golden crosses on the MACD, hinting at early bullish re-entry. RSI climbed steadily but remained below 60, indicating a cautious but developing shift in buying pressure. Buyers used this range-bound phase as a consolidation ground, forming the base for the eventual Chainlink rally. Volume increased modestly, suggesting accumulation activity ahead of a breakout attempt.
Bulls Reignite Momentum With LINK Breakout Surge
The bullish momentum reignited between 21:00 UTC and 00:00 UTC, as LINK broke above $14.00 and entered a clean uptrend channel. This Chainlink rally extended into the early hours of May 8, with the first major LINK breakout at 02:25 UTC above the $14.20 resistance, now a flipped support level. MACD confirmed bullish dominance via a strong golden cross before the breakout, while RSI entered the overbought zone and stayed elevated throughout the move. This breakout was a key turning point, unlocking fresh demand. Price action remained steep, and candles printed higher highs, validating trend strength and low overhead supply.
From 03:00 to 06:00 UTC, LINK price attempted a secondary breakout after a brief sideways movement near $14.60. The price initially paused after touching this resistance but resumed the climb by 07:30 UTC, triggering a fresh breakout. RSI peaked again in overbought territory during this push, and MACD showed sustained bullish strength despite minor signal-line hesitation. The price trajectory was clean and steep, aligning closely with the trendline of the uptrend channel. The $14.20–$14.25 region now acts as a strong cushion for buyers, while $14.60, though briefly a barrier, is now retested support.
Consolidation Near Resistance After Breakout
Between 06:00 and 09:00 UTC, LINK entered a consolidation phase above $14.70 after breaking the $14.60 resistance zone. RSI cooled slightly from its overbought peak, settling just below 70, while MACD showed a minor convergence between signal lines, hinting at short-term fatigue. However, neither indicator suggested a bearish reversal—more of a pause than a pullback. Price structure maintained higher lows, and no major rejection candles were printed. This suggests buyers are still in control, digesting gains before a possible continuation. As long as LINK holds above $14.60, bullish sentiment remains structurally intact.
LINK Price Strengthens Above $14.70 as Bulls Defend Gains
LINK is showing strong bullish momentum following its breakout above multiple resistance levels, most recently crossing $14.70. With RSI remaining near overbought and MACD sustaining golden crosses through the Chainlink rally, momentum appears intact, though a cooldown may be near. Key support now lies at $14.25, while the next resistance target is around $15.00. The trend remains bullish unless LINK closes below the $14.20–$14.25 region. The LINK breakout structure and indicator behavior suggest a continued climb, with price projected to test $15.20 if the current uptrend channel holds firm.
Keywords: LINK Price, Chainlink Token, LINK Breakout
Chainlink (LINK) Price Analysis of May 12, 2025
The Chainlink price action over the last 24 hours shows a transition from sideways to bullish behavior, followed by a sharp pullback. After entering a moderate uptrend channel near $16.55, LINK steadily climbed with short consolidations, using the $16.50 level as a key support throughout the early phases. By 12:45 UTC, the price rebounded from support and made a short push to $16.83. A minor rejection led to a retest of the lower channel, but buyers re-entered by 15:55 UTC and steered price movement back toward the resistance region at $17.35. This level held firm initially, but the structure suggested pressure was building.
Chart 6- LINK/USDT M5 Chart, Analyzed by Alokkp0608, published on May 12th, 2025.
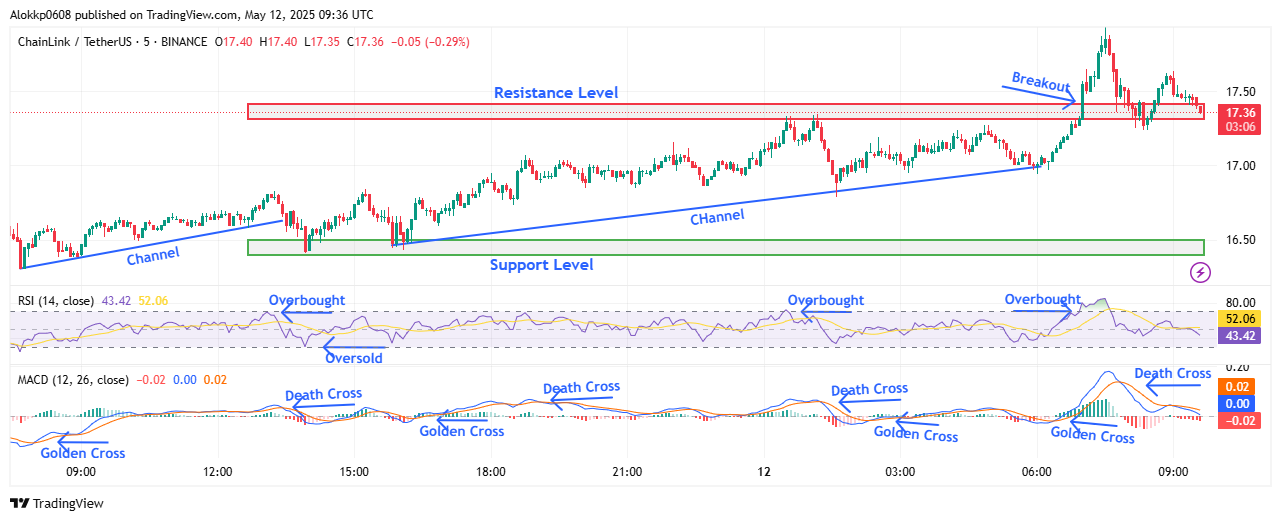
Throughout the 18:00 to 00:00 UTC period, LINK price made several tests of the $17.35 resistance level while remaining inside a gently ascending channel. Each dip saw recovery from levels just above $16.80, forming a well-defined structure with higher lows. During this range, MACD alternated between golden and death crosses, indicating indecision, while RSI showed periods of overbought activity, especially near the resistance. Despite the hesitation, the support base stayed firm, and buyers remained active in absorbing selling pressure at each minor dip before the breakout took place.
LINK Breakout Gains Fueled by Momentum Surge
During the early hours of May 12, from 03:00 to 06:00 UTC, Chainlink token saw another short dip, but then sharply broke above the $17.35 resistance around 07:00 UTC. This breakout pushed LINK toward $17.98, representing the session’s highest level. RSI spiked into overbought territory during this rapid price surge, confirming the strength of the move. The MACD also formed a strong golden cross just before the LINK breakout, with widening histogram bars showing momentum acceleration. The $17.35 zone, previously a resistance ceiling, began acting as an intraday support level as the price briefly pulled back before stabilizing above it.
Following the breakout, LINK price began to consolidate between $17.35 and $17.90 during the 06:00 to 09:00 UTC window. A short-term pullback brought the price below $17.50, but buyers returned again around 08:30 UTC to lift the pair above the former resistance. MACD, however, showed a bearish signal via a death cross after the peak, and RSI eased from overbought levels. This suggested the initial rally momentum was fading slightly, prompting price consolidation. Still, the price remained above key thresholds, keeping bullish hopes alive.
Consolidation Near Resistance After Breakout
In the most recent 3-hour period, the Chainlink token moved in a narrow range between $17.35 and $17.50. Although this represents a pullback from the breakout high near $17.98, it also shows that buyers are trying to flip $17.35 into a firm support base. The MACD now leans bearish with a visible death cross and red histogram bars, reflecting declining bullish momentum. RSI has dropped significantly from overbought territory, currently sitting in a neutral range around 43. This loss of strength suggests that unless renewed volume enters, the price could revisit lower support levels. For now, consolidation remains the dominant theme.
LINK Faces Key Retest After Post-Breakout Pullback
Chainlink’s short-term breakout above $17.35 has shown signs of strength, but fading momentum now puts pressure on this level to hold as support. The LINK price may test $17.10 or even $16.80 if buying interest weakens further. MACD’s recent death cross and RSI cooling off from overbought levels suggest a temporary stall in the upward drive. However, if bulls can defend the $17.35 zone, a renewed push toward $18.00 remains possible. Current momentum leans neutral to slightly bearish, with key levels to monitor at $17.35 (support) and $17.98 (resistance). A decisive break above or below this range will define LINK’s next major move.
Chainlink (LINK) Price Analysis of May 14th, 2025
The Chainlink price action over the last 24 hours shows strong recovery following weakness in the previous session. After opening near $16.20, LINK broke past the key support-turned-resistance at $16.60 around 09:25 UTC, showing strong bullish intent. Momentum continued steadily, with price consolidating briefly before forming a clean upward channel. RSI crossed into overbought territory twice during this leg. The MACD showed a golden cross around 14:30 UTC, confirming strong upward momentum. This rally topped out just beyond the $17.60 resistance near 19:40 UTC before losing strength, highlighting buyer exhaustion and a lack of follow-through past that breakout.
Chart 7- LINK/USDT M5 Chart, Analyzed by Alokkp0608, published on May 14th, 2025.
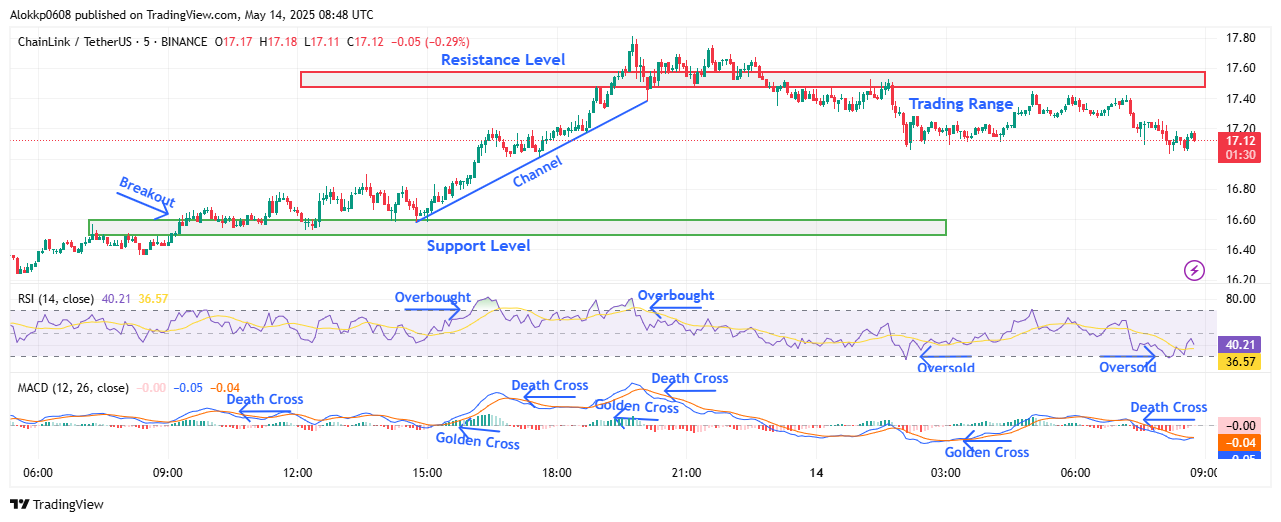
The next leg of price movement shifted to a sideways structure above the LINK resistance zone. LINK hovered close to the $17.60 line but failed to build momentum. MACD posted two death crosses near 20:45 UTC and again by 22:00 UTC, indicating weakening bullish momentum. RSI retreated from overbought to mid-zone and later dipped into oversold. These signals marked growing indecision. LINK began slipping below $17.60, marking the end of the short-term bullish trend. Sellers regained slight control, although no strong downside trend emerged. Instead, the price entered a more muted range-bound structure overnight.
Sideways Drift Below Resistance Zone
Following the early rally, LINK price entered a new sideways phase that lacked direction. Between 22:35 UTC and 01:40 UTC, prices hovered just under the LINK resistance level. The RSI fluctuated without momentum, while the MACD stayed flat. This period reflected a market unsure of further upside potential. Around 02:10 UTC, the Chainlink token briefly dipped to $17.07, pushing RSI into oversold again. MACD responded with a weak golden cross, but this failed to lift the price meaningfully. Volume remained relatively low during this segment. The lack of conviction from bulls or bears left LINK trapped below the earlier breakout zone.
By 03:00 UTC, LINK price continued sideways without testing either the previous high or the $16.60 support. RSI entered oversold again, but quick rebounds showed no follow-through. Another golden cross in the MACD formed near 06:30 UTC, but like earlier signals, this lacked market support. The price remained range-bound between $17.10 and $17.35. RSI bounced but never regained bullish strength. These patterns indicate a market that lacks strong buying interest despite previous momentum. The brief dips below $17.10 did not trigger panic, but also failed to spark buying demand, maintaining the range.
Range-Bound Trading Signals Market Uncertainty
LINK’s most recent behavior shows range-bound trading near $17.10, just under key resistance. At the latest visible candle, LINK price trades around $17.12 after another failed LINK breakout attempt. The RSI remains subdued, showing brief recoveries after oversold conditions but no sustained uptrend. MACD recently printed a death cross, reinforcing a neutral-to-bearish short-term bias. The broader picture shows buyers losing momentum, with no clear signs of reversal or support breakdown. LINK’s inability to retest $17.60, even after multiple golden crosses, suggests caution. Market participants appear hesitant, with neither bulls nor bears showing conviction near this zone.
LINK Struggles to Reclaim Momentum Near $17.60
Chainlink token shows weakening bullish momentum below resistance at $17.60 after early breakout attempts failed to hold. Momentum has shifted to neutral with fading bullish pressure. Support remains firm around $16.60, while LINK resistance stands between $17.50 and $17.60. RSI is bouncing from oversold levels but lacks strength. MACD has posted multiple golden and death crosses, but recent crosses have failed to drive trend changes. If LINK fails to break above $17.35 soon, sellers may test $17.00 or even $16.80. A renewed MACD golden cross near $17.10 with RSI rising could support recovery, but current signs suggest more sideways movement ahead.
Chainlink (LINK) Price Analysis of May 19, 2025
The LINK price action over the last 24 hours shows a clear three-phase pattern: sideways movement, sharp volatility, and eventual stabilization. The Chainlink token initially moved within a narrow trading range between $15.55 and $15.90 until about 14:20 UTC, showing minimal momentum or volume. It then surged upward to test the resistance at $16.50 by 16:10 UTC but failed to break through. This rejection triggered a steep drop within a descending channel, driving the price down to $14.88 near the LINK support level of $14.80. RSI spiked into overbought during the breakout and flipped back fast. MACD also printed a death cross right before the drop.

Between 18:00 UTC and 00:00 UTC, LINK price bounced off support and pushed steadily back to $16.00. The move built a clean rising channel as momentum shifted. RSI rebounded sharply from oversold levels into neutral, while MACD shifted bullish with a golden cross, suggesting renewed buying interest. However, the $16.00 region acted as a soft rejection zone, stalling the rally. Despite the upward momentum, bulls struggled to retest the earlier $16.50 resistance, indicating selling pressure was still lurking just above the recovery path.
Bulls Lose Steam Below Resistance
Between 00:00 UTC and 03:00 UTC, LINK gave up its gains and fell hard from $16.00 to retest $14.80. The drop matched a MACD death cross and RSI dipping back into oversold. This dip lacked strong volume, indicating weak follow-through by sellers. Notably, the price respected the $14.80 level again, reinforcing its status as a short-term demand zone. Buyers soon returned to lift LINK back above $15.00, initiating a gradual recovery with slightly higher lows.
Between 03:00 UTC and 09:30 UTC, the LINK price action flattened out into a sideways pattern between $15.00 and $15.30. MACD issued a golden cross around 08:30 UTC, but momentum remained weak and unconvincing. RSI hovered around 50 through the next stretch, staying neutral. Price stayed tight between $15.00 and $15.30 with low volume, showing the market was on pause.
Range-Bound Stability Returns Near $15.24
The most recent activity shows LINK price trading quietly at around $15.24 as of the last observed data, remaining within a narrow range. Price movement is compressing just above the $15.00 support band, with no decisive bullish or bearish momentum. MACD lines hover closely together, signaling a lack of trend clarity, while RSI floats just above 50, indicating equilibrium. This range-bound behavior hints at an accumulation phase or indecision before the next leg. Traders are likely watching for a breakout above $15.50 or a breakdown below $15.00 to determine short-term bias.
LINK Awaits Breakout After Volatile Swings
Chainlink token’s recent price action reflects a recovery effort that failed to sustain momentum above $16.00, bringing the coin back into a sideways structure around $15.24. Momentum has faded with RSI now neutral near 51 and MACD turning flat following its recent golden cross. LINK Support level at $14.80 remains critical, while the $15.50–$15.90 range is a near-term resistance band to overcome. If bulls manage to reclaim $16.00 with volume, LINK could retest $16.50. However, failure to hold above $15.00 may trigger a deeper move toward $14.50. Traders should remain patient until a clear breakout direction emerges.
Chainlink (LINK) Price Analysis of May 22, 2025
The Chainlink token price action from the start of the trading session shows a bullish rebound forming two clean upward channels with distinct breakouts. From 00:30 to 01:45 UTC, LINK oscillated tightly between the initial support level at $16.05 and resistance at $16.31. Buyers tested the upper boundary multiple times, building pressure on the RL. A decisive LINK breakout at 03:33 UTC confirmed the upward momentum. During this stretch, the MACD printed a golden cross, and the RSI entered overbought territory, reinforcing bullish intent. Price structure formed a minor HH near $16.34 before cooling briefly toward the newly formed support at $16.21.
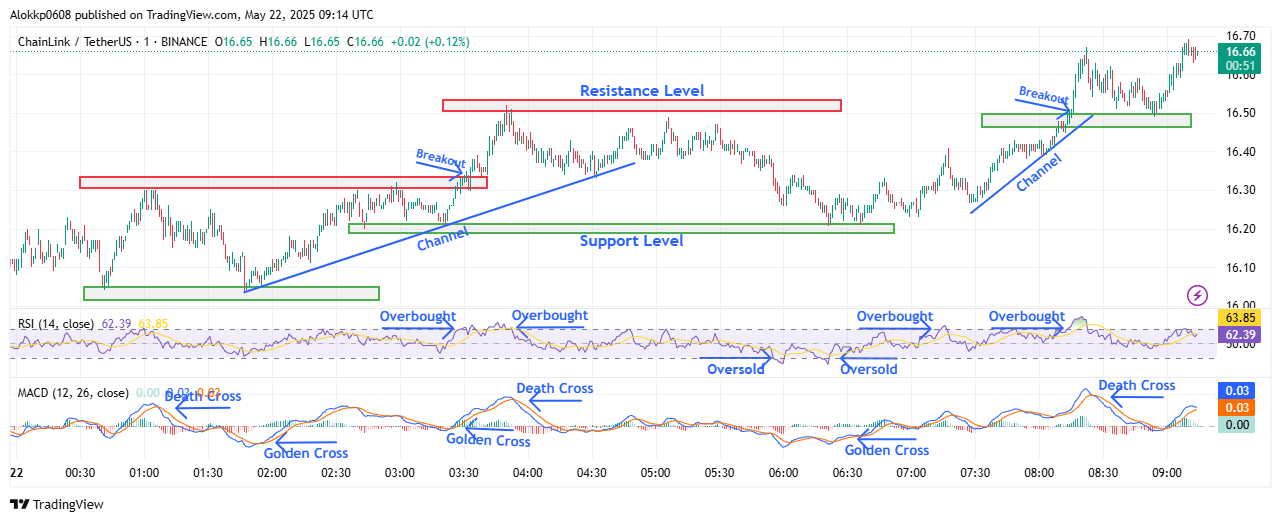
LINK/USDT M-1 Chart, Analyzed by Alokkp0608, published on May 22nd, 2025.
From 03:45 UTC to 07:00 UTC, LINK price entered a narrow sideways-to-upward range within the new support of $16.21 and resistance at $16.51. This period displayed both price fatigue and structural resilience. Repeated HL formations held above $16.30, while rallies failed to extend beyond $16.51, indicating a temporary ceiling. MACD momentum weakened slightly with a death cross near 04:45 UTC, yet it stayed close to the zero line. RSI dropped from overbought to mid-range, with brief oversold readings on two dips, signaling consolidation rather than bearish reversal. The trend remained intact, albeit capped by firm resistance.
LINK Breakout Restores Bullish Momentum
From 07:00 to 08:16 UTC, LINK price built pressure again, moving within a new upward channel. The support zone rose to $16.30–$16.50, with each dip forming higher lows. At 08:16 UTC, a strong bullish candle broke above the $16.51 RL, launching the next leg higher. Price action printed a fresh HH near $16.68 and formed tight HLs around $16.55, validating the breakout. MACD showed another golden cross just before the breakout, confirming a momentum shift. RSI spiked sharply into overbought territory, mirroring strong buyer conviction. This breakout came after a well-defined buildup, suggesting it wasn’t a false push.
Buyers Dominate After Range Compression
From 08:20 UTC to 09:00 UTC, LINK price maintained a bullish bias with consistent HLs near $16.58 and repeated HHs touching the $16.66–$16.68 zone. This stretch acted as an extension of the breakout move. Despite small-bodied candles and minor pullbacks, bears could not reclaim the $16.55–$16.60 range. RSI remained elevated above 62, while MACD flattened near the top with a brief death cross, indicating possible short-term exhaustion. However, the price structure still favored bulls, with no LL or LH formations. Price hovered just under $16.70 but paused, suggesting potential for either continuation or a pullback.
Price Pauses Below Local Highs Near $16.70
The Chainlink token closed the session near $16.66 after testing $16.68 twice, with momentum still leaning bullish. The LINK breakout above $16.51 held firm, with rising HLs around $16.55 reinforcing this strength. MACD is now neutral but above zero, while RSI remains slightly below overbought, both supporting further upside if buying pressure resumes. Immediate SLs to monitor are $16.50 and $16.21, while RLs are set at $16.68 and a potential new level at $16.75. Trend direction remains upward, but with signs of a temporary stall. Continuation requires a clean break above $16.68 on renewed volume and MACD lift. Momentum stays bullish unless $16.50 fails.
Chainlink (LINK) Price Analysis of May 26, 2025
The Chainlink price action today shows a strongly bullish opening followed by resistance-driven volatility that shaped a rising, yet unstable trend structure. The initial push began just after midnight, with prices reclaiming the $15.55 support and spiking to challenge the $15.75 resistance by 00:33 UTC. A golden cross on the MACD during that spike signaled early bullish intent, but a quick death cross at 01:00 UTC coincided with a pullback to the previous support. This first leg marked a Lower High at $15.75 and a Higher Low at $15.55, forming the early range boundaries.
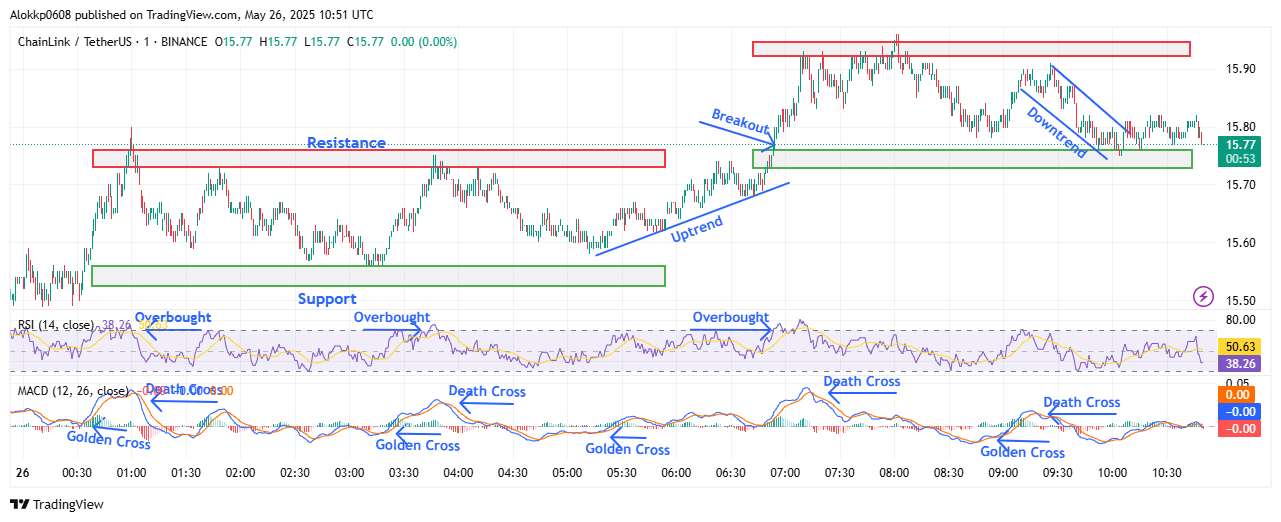
LINK/USDT M-1 Chart, Analyzed by Alokkp0608, published on May 26th, 2025.
The next sequence, between 01:30 UTC and 03:52 UTC, built a deeper structure. After consolidating near $15.55, LINK price bounced again at 03:16 UTC, marked by another MACD golden cross. Price revisited $15.75 resistance by 03:45 UTC, but rejection at 03:52 UTC and another MACD death cross confirmed that this level remained a firm ceiling. RSI hovered in neutral territory throughout, showing limited buying strength to fuel a clean LINK breakout. This price behavior confirmed a repeated LH near $15.75 and preserved the $15.55 zone as a support base.
LINK Breakout Rally and Rejection Define Short-Term Structure
Between 05:00 UTC and 07:15 UTC, momentum turned decisively bullish. A third MACD golden cross at 05:15 UTC aligned with a shift into a new uptrend channel. Prices broke out past $15.75 at 06:53 UTC, flipping it into a support level. This breakout pushed LINK to a new daily high of $15.95, forming a fresh resistance zone. However, that level triggered heavy selling pressure, and a MACD death cross shortly after 07:15 UTC foreshadowed the pullback. RSI had briefly tapped into overbought territory during the rally, signaling exhaustion.
From 07:15 UTC to 09:27 UTC, LINK price hovered just below $15.95 before a mild decline set in. Prices dipped to $15.78 by 08:45 UTC, where short-term support was confirmed. A quick MACD golden cross at 08:55 UTC helped the coin rebound to $15.90 by 09:27 UTC. However, this marked another LH beneath the $15.95 high. A death cross at 09:25 UTC sealed the loss of momentum, aligning with falling RSI that showed sellers regaining temporary control. This phase set a second major resistance at $15.90 and validated $15.78 as support.
Dip Reinforces $15.75 Support While Volatility Narrows
The final leg from 09:30 UTC to the end of the chart at 10:50 UTC revealed LINK price fading into a consolidation phase. After failing to reclaim $15.90, LINK began slipping again and retested the now-confirmed support level around $15.75–$15.78. Despite the dip, bulls showed signs of guarding that zone, with the price flattening out near $15.77 into the close. MACD remained flat post–death cross, suggesting cooling momentum, while RSI returned to a neutral zone, indicating neither buyers nor sellers had a clear edge. This left the coin in a coiled structure, holding support but lacking fuel for another breakout just yet.
LINK Momentum Fades After False Breakout at $15.95
Chainlink token shows signs of losing steam after an early-session breakout above $15.75 was rejected near $15.95. While short-term momentum was strong in the 05:00–07:00 UTC window, the failure to hold above the new resistance set the stage for sideways-to-down pressure. Momentum now appears neutral to slightly fading. Key support levels rest at $15.75 and $15.55, while resistance remains firm at $15.90 and $15.95. MACD has alternated rapidly, but its latest death cross and flattening slope suggest cooling trend strength. RSI sitting mid-range further supports a neutral bias. For bulls to regain control, a confirmed breakout above $15.95 must occur with volume.
Chainlink (LINK) Price Analysis of May 30th, 2025
The Chainlink price action today shows a strong early breakdown followed by a failed recovery attempt and prolonged consolidation. The day opened near $15.12 but quickly collapsed through the $14.88 support level by 00:28 UTC. A sharp drop to $14.19 marked the session low by 00:59 UTC, forming a clear Lower Low (LL). MACD issued a death cross during this drop, while RSI fell into oversold territory. A quick bounce followed from 01:02 UTC, with a golden cross on MACD reinforcing this short recovery. However, the rebound failed to regain the earlier high, signaling early trend weakness.
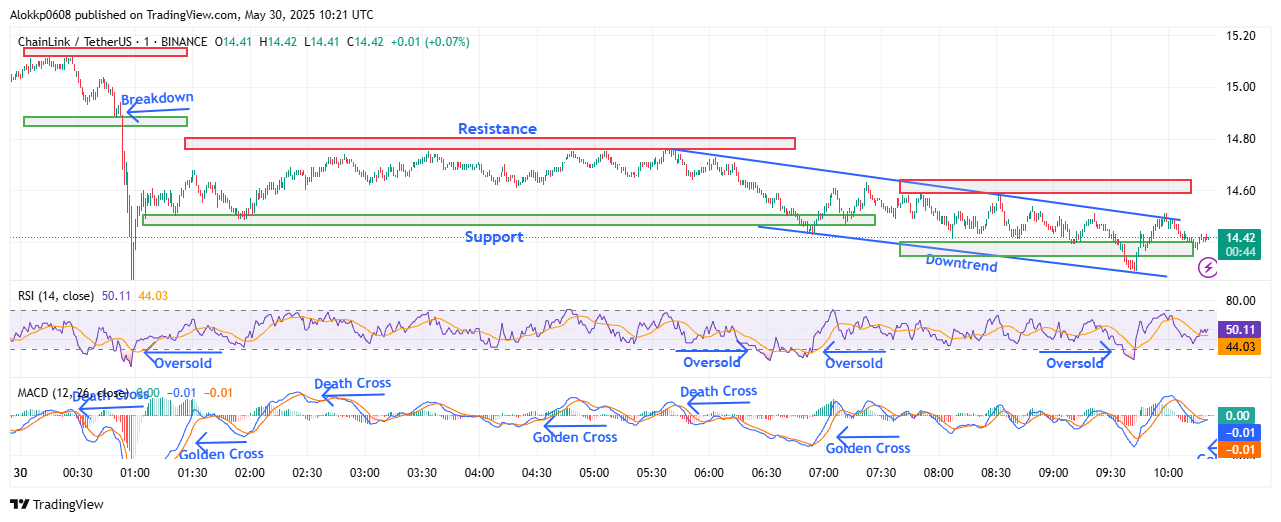
LINK/USDT M-1 Chart, Analyzed by Alokkp0608, published on May 30th, 2025.
From 01:30 UTC to 05:40 UTC, Chainlink token hovered between a support zone at $14.50 and resistance near $14.76. The price established multiple Lower Highs (LH), notably peaking near $14.74 by 02:48 UTC and briefly touching resistance again around 03:33 UTC, 04:48 UTC, and 05:40 UTC. Each attempt failed to break out, indicating strong overhead selling pressure. MACD issued alternating golden and death crosses in this window, while RSI remained below 60, reflecting weak bullish momentum and suggesting distribution. The resistance near $14.76 turned pivotal during this phase.
Consolidation LINK Breakdown and Emerging Downtrend
Between 05:43 UTC and 08:07 UTC, LINK price transitioned into a downward-sloping channel. The price broke down from the previous range after repeated rejection at $14.76, falling toward a new support zone near $14.40. This downtrend featured consistently lower highs and lower lows, with MACD confirming bearish control through a death cross at 05:43 UTC. RSI also dipped into oversold territory multiple times, highlighting selling strength. Price tested and respected the new support zone near $14.40, forming temporary stability. However, continued rejections below the $14.60 level kept upside capped.
From 08:15 UTC to 10:00 UTC, LINK price maintained a sideways path between $14.40 and $14.60, coiling tightly in a narrowing range. Price structure during this time showed minor Higher Lows (HL) but capped Lower Highs (LH), suggesting indecision rather than reversal. MACD printed a golden cross at 06:55 UTC, but momentum quickly faded, and signal lines flattened. RSI oscillated around neutral territory but held above the oversold zone, implying a balance between buyers and sellers. The $14.60 level remained a stubborn resistance, forming a short-term range-bound setup.
Breakout Attempt Rejected Below Resistance
Into the final leg of the chart, LINK price pushed up to test the descending resistance line again but failed to break through. The price peaked near $14.55–$14.60 before facing rejection, pulling back slightly to end at $14.42. This final move formed another LH relative to earlier peaks, keeping the broader downtrend structure intact. MACD lines converged again but lacked a strong bullish divergence. RSI climbed above 50 briefly but didn’t show follow-through. The failed breakout attempt confirms that sellers still control the $14.60 zone.
LINK Momentum Fades After Failed Breakout Attempt at $14.60
The Chainlink token appears stuck in a fragile consolidation between $14.40 and $14.60, with weakening momentum. Short-term price direction looks neutral to bearish unless bulls reclaim $14.60 with conviction. Support zones to watch remain $14.40 and $14.19, while resistance levels are $14.60 and $14.76. MACD remains indecisive with repeated crossovers but no clear trend continuation. RSI is hovering near 50, suggesting a lack of directional strength. Unless a strong breakout occurs above $14.60, the price may continue ranging or drift lower.
Chainlink Price Analysis of June 5, 2025
The Chainlink price action today, from the start of trading to 08:35 UTC, shows a volatile but technically reactive session. Prices ranged early between the $13.74 support and $13.86 resistance, bouncing within that zone until 01:53 UTC. Despite a MACD death cross at 01:15 UTC, a golden cross formed by 01:53 UTC, indicating strengthening bullish momentum. A clean breakout followed by 02:33 UTC, with LINK climbing above $13.86. A new trading range was quickly established between $13.82 and $13.94, suggesting an HL at $13.82. Momentum extended briefly to a day high of $13.96 at 02:38 UTC before sellers pushed back hard.
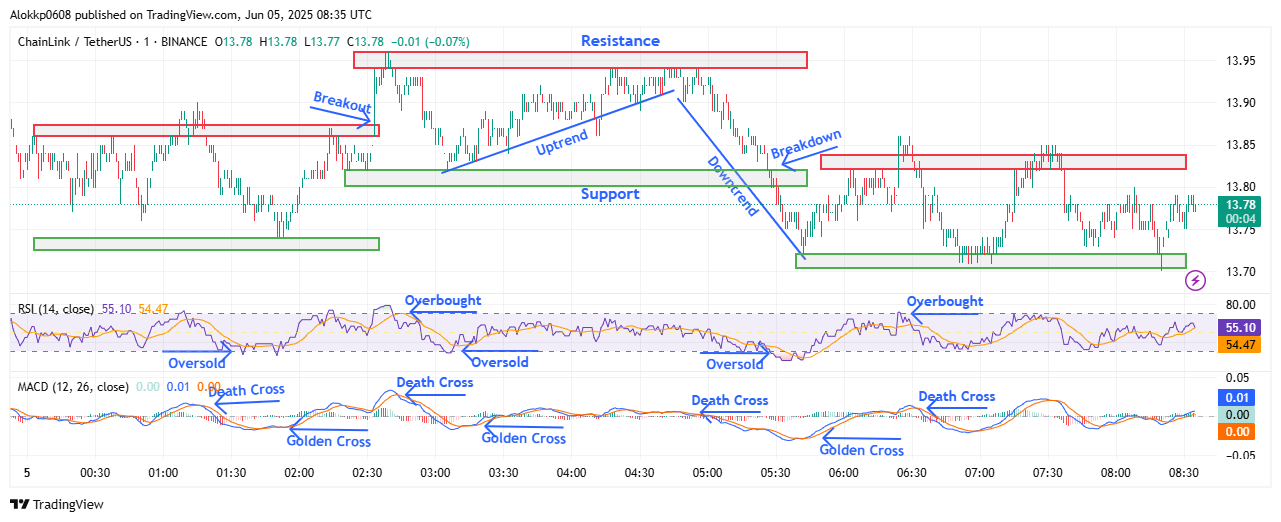
LINK/USDT M-1 Chart, Analyzed by Alokkp0608, published on June 5th, 2025.
By 02:43 UTC, just five minutes after the high, another MACD death cross signaled a pullback. LINK Prices dropped steadily and revisited the $13.82 support by 03:05 UTC. Interestingly, the fall was short-lived as a MACD golden cross emerged at 03:10 UTC, marking a pivot. Chainlink entered a rising structure again, forming a new HL and climbing to retest $13.94. Price hit resistance by 04:17 UTC and consolidated below it until 04:56 UTC, where a notable MACD death cross confirmed fading momentum. This created a lower high near $13.93, marking the start of a downtrend.
Failed Recovery Above Resistance, Bearish Shift After 05:00 UTC
The downtrend accelerated post-04:56 UTC, triggering a sharp breakdown on the $13.82 support by 05:28 UTC. Prices fell to a new intraday low of $13.72, establishing a fresh support zone between $13.70–$13.74. A temporary pause followed, but no bullish reversal formed, suggesting continued supply pressure. RSI during this slide showed a snap from neutral to oversold territory, briefly hinting at exhaustion. However, the MACD death cross earlier prevented any strong counter rally. LINK hovered between $13.72 and $13.82 for the remainder of the session, failing to reclaim higher levels. No HHs or HLs were made in this final stretch.
Despite a MACD golden cross appearing at 05:52 UTC, the LINK price response was muted, forming a sideways pattern instead. LINK stayed within the narrow $13.72–$13.82 band, making several LHs around $13.79–$13.80. The RSI stayed mostly neutral, indicating indecision rather than renewed demand. Price struggled to lift past minor intra-band resistance. Support at $13.72, though tested, held firm throughout. This range-bound behavior suggests the market is awaiting a decisive move but is leaning mildly bearish due to the lack of strong bounces or clear bullish structure.
Bearish Drift Holds LINK Price Below $13.82
Chainlink token closed the session near $13.78, still under short-term resistance and unable to reclaim earlier highs. Momentum remains weak, with the MACD last showing a golden cross but no significant follow-through. The RSI has stabilized near the midline, reflecting neutral sentiment. Current levels to watch include support between $13.70–$13.74 and resistance at $13.82 and $13.94. Without a break above $13.82, the bias remains mildly bearish to neutral. If sellers push below $13.70, the downside could extend. If bulls regain $13.82 with momentum, a retest of $13.94 is possible.
Chainlink (LINK) Price Analysis of June 10th, 2025
The Chainlink price action today shows early bullish momentum followed by whipsaw volatility. The session began near $14.35 and quickly rallied from that support by 00:15 UTC. A golden cross on the MACD supported the uptrend, with RSI rising but staying neutral. LINK breached the $14.50 resistance at 00:25 UTC and continued forming higher highs till 01:02 UTC. During this phase, the price hovered between $14.50 and $14.43 in a consolidation zone before rallying again. The breakout above $14.50 led to a new high of $14.62 by 01:37 UTC, establishing a fresh resistance.
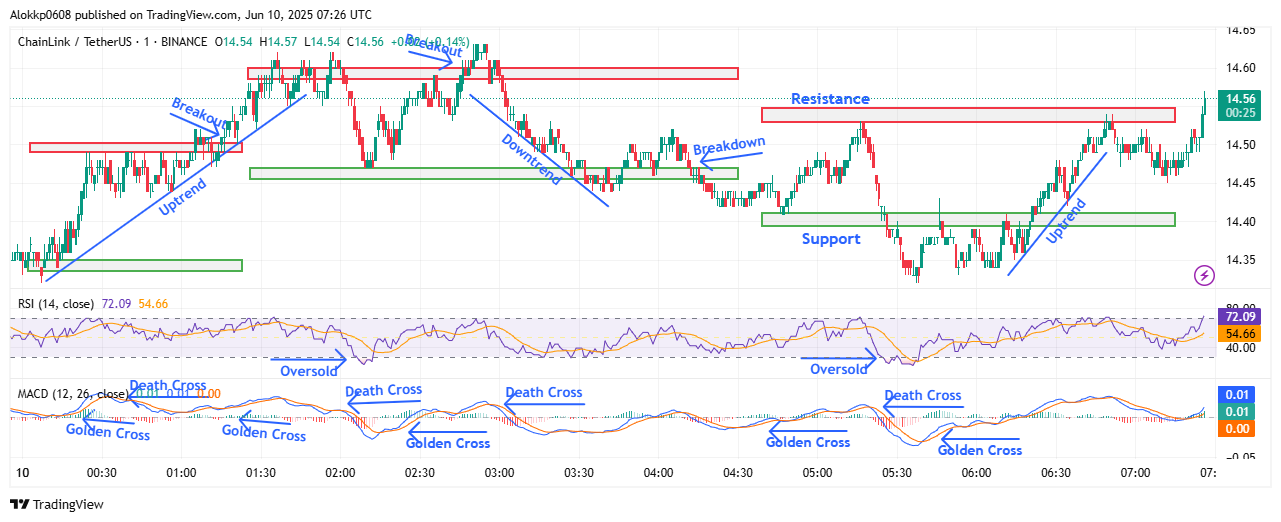
LINK/USDT M-1 Chart, Analyzed by Alokkp0608, published on June 10th, 2025.
Between 01:37 UTC and 02:57 UTC, LINK price shifted into a corrective phase. After peaking near $14.62, the price struggled to maintain momentum and slipped into a minor downtrend. The RSI stayed elevated but showed signs of fading strength while the MACD confirmed a death cross by 02:00 UTC. A golden cross at 02:13 UTC triggered a brief rebound and breakout past $14.60, but the move lacked strength. By 02:57 UTC, a sharp reversal brought a MACD death cross, breaking down through the $14.47 support level. This breakdown confirmed a lower high (LH) and marked the start of a broader corrective structure.
Failed Rebounds and Support Zone Retests
From 03:00 UTC to 04:47 UTC, LINK price entered a weak recovery mode with reduced volume. Price bounced mildly but failed to retake $14.50, confirming it as near-term resistance. MACD remained bearish until a golden cross emerged at 04:29 UTC. RSI dipped near the oversold area but didn’t fully breach it, indicating subdued bearish pressure. By 04:15 UTC, the breakdown of $14.47 support shifted the bias to bearish. A fresh support zone formed between $14.38 and $14.40. LINK hovered above this region, forming a potential higher low (HL) by 04:47 UTC, suggesting sellers were losing control.
Between 04:47 UTC and 06:19 UTC, LINK price saw alternating rallies and dips, but overall movement was range-bound. The MACD printed a death cross at 05:20 UTC, which coincided with another failed breakout attempt around $14.53. Buyers returned around 05:39 UTC, which sparked a rally supported by a golden cross. This move began forming an early uptrend pattern with a series of higher lows. However, momentum remained capped by a horizontal resistance near $14.53. RSI moved steadily upward, recovering from midline levels and showing no overbought extremes, keeping short-term bullish potential intact.
Renewed Uptrend Attempts as Bulls Push Above $14.53
The most recent price action between 06:19 UTC and 07:25 UTC indicates a bullish breakout attempt. LINK began climbing steadily, printing both higher lows and higher highs. The MACD’s recent golden cross at 05:39 UTC remained intact, signaling persistent buyer interest. Price successfully broke above the $14.53 resistance level, validating a new short-term uptrend. The RSI rose into overbought territory around 07:15 UTC, suggesting short-term caution but also reinforcing bullish momentum. As of 07:25 UTC, the price settled at $14.55, challenging the upper bounds of today’s trading range and hinting at further upside potential.
LINK Price Breakout Attempts Continue Amid Bullish Bias
The short-term outlook for the Chainlink token remains cautiously bullish. The price is attempting to sustain an uptrend after reclaiming ground above the $14.53 resistance. Momentum is positive, but RSI nearing overbought zones may trigger intraday pullbacks. Key support levels lie at $14.40 and $14.47, while $14.60 and $14.62 act as immediate resistance. A strong breakout above $14.62 could extend the rally toward $14.70. The MACD remains in bullish alignment after the 05:39 UTC golden cross, supporting further gains if volume picks up. Traders should monitor RSI behavior for signs of exhaustion as the price retests upper resistance from earlier in the session.
Chainlink (LINK) Price Analysis of June 14, 2025
The Chainlink price action today shows early signs of instability, followed by defined range activity and eventual downward continuation. The session opened with LINK moving within a downtrend, slipping toward support at $13.25 by 01:06 UTC. Though it temporarily held that level, MACD flashed multiple golden and death crosses between 01:17 and 05:54 UTC, signaling indecision. During this stretch, the price oscillated between $13.25 and $13.42, failing to make higher highs. RSI hovered near the midline, reflecting low conviction. Overall, the pattern suggested a weakening structure, stuck in a narrow zone with no bullish continuation.
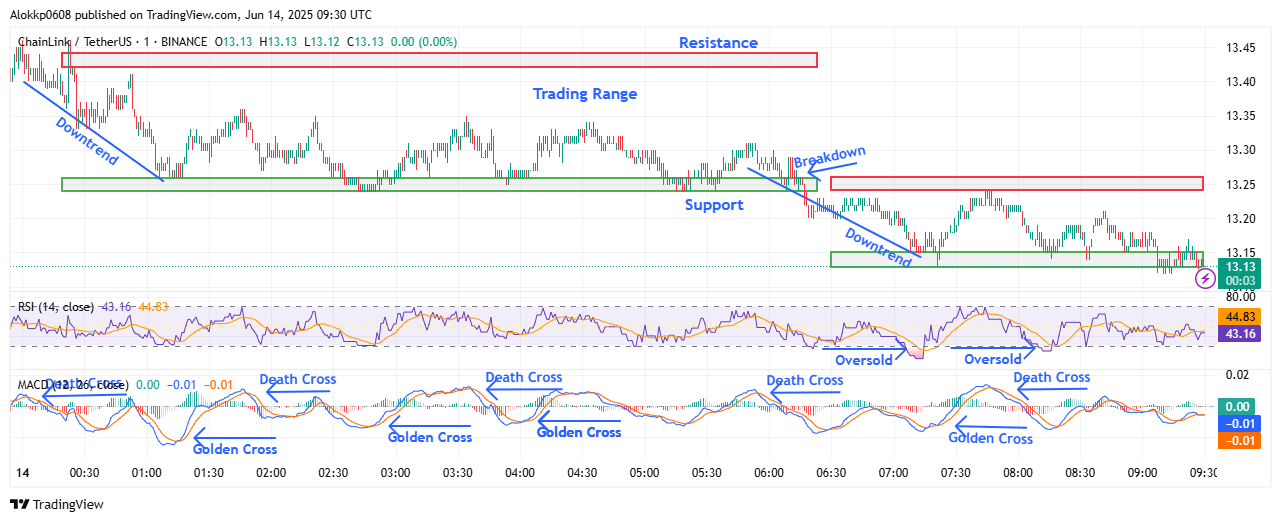
LINK/USDT M-1 Chart, Analyzed by Alokkp0608, published on June 14th, 2025.
By 05:54 UTC, momentum broke decisively as LINK slipped below the $13.25 support, establishing a new lower structure. The drop confirmed a fresh downtrend, and the price fell into a tighter range of $13.15–$13.25. The MACD death cross at 05:54 UTC aligned with the breakdown, and the RSI started dipping closer to oversold territory. By 07:11 UTC, LINK hit the new $13.15 support level, marking a fresh intraday low. The price then attempted a short-lived bounce. Though it entered a mild uptrend and briefly hit the $13.25 resistance again, bulls failed to reclaim the zone with strength.
Failed Breakout Attempt and Quick Reversal
From 07:22 UTC, LINK price began forming higher lows and higher highs, entering a weak upward channel. This move aligned with a golden cross on the MACD and an RSI bounce from near-oversold levels. By 07:45 UTC, LINK tagged the $13.25 resistance but couldn’t break through. The price rejected this level firmly and reversed by 07:47 UTC, with a MACD death cross confirming the turn. The rejection created a lower high (LH) and signaled bearish control. This lower high near resistance was a clear exhaustion point, and sellers quickly regained momentum over the next thirty minutes.
Consolidation Within Narrow Range Below Resistance
After the sharp rejection, LINK price fell back to the $13.15 support by 08:15 UTC, revisiting the earlier intraday low. The bounce from here lacked momentum. Between 08:15 and 08:40 UTC, the price remained rangebound within the $13.15–$13.25 zone. RSI drifted sideways near 44, suggesting no strong directional bias, while MACD remained flat and close to the signal line, showing fading volatility. This sideways action points to market indecision, with neither buyers nor sellers pressing a clear advantage. Price failed to establish either an HH or LL in this phase, signaling pure consolidation.
Breakdown Watch Under $13.15 or Bounce from Support Zone?
LINK’s price closed the latest leg of action just above $13.15, with no strong breakout or breakdown confirmation. This forms a delicate pivot zone that traders should watch closely. If $13.15 gives way, the next logical support might appear near $13.05–$13.10, while a bounce could revisit $13.25 and test the prior range ceiling. MACD remains in a neutral posture with no current crossover, and RSI stays muted. A break below $13.15 would likely reestablish the bearish structure with new LLs forming. A move above $13.25, however, would require a MACD golden cross and a push in RSI above 50 to have legs.
LINK Bearish Momentum Stalls but No Recovery Yet
At this point, the Chainlink token shows weak momentum after a failed breakout attempt near $13.25 and continued rejection from key levels. Short-term price structure remains bearish-to-neutral, with $13.15 acting as immediate support and $13.25 as short-term resistance. Below $13.15, the next support zone lies near $13.05. RSI is sluggish in the mid-40s without directional push, and MACD shows mixed crossovers that reflect intraday choppiness. For a bullish reversal, LINK needs a confirmed breakout above $13.25 with MACD support. Until then, the price may remain trapped or break lower.


