

Throughout the last few trading sessions, Litecoin displayed significant instability due to volatile movements. The cryptocurrency first surfaced from a small area, turning into a converging triangle and then experiencing bearish movements due to the MACD Death Cross. However, it eventually dropped below this range. MACD Golden Crosses and RSI fluctuations were observed during subsequent recovery attempts, alternating overbought and oversold conditions. LTC price action was centred on key levels of $83.50 and $88.00, with intraday action indicating failed breakouts and shifting momentum. Let’s look at the Litecoin price analysis.
Litecoin Price Analysis for April 28, 2025
After marking the day’s high at $87.59, Litecoin broke out from a minor range at 01:15 UTC. The Litecoin breakout formed a spike, and the price converged to create a converging triangle. The converging triangle broke out to the downside at 04:25 UTC, supported by a Death Cross of MACD. In the meantime, RSI dropped below the level of 30, indicating a reversal or at least a pullback in the ongoing downward movement of the price. At 05:55 UTC, a Golden Cross appeared in the price. Both MACD and RSI suggested a reversal or at least a pullback.

Chart 1: Analysed by vallijat007, published on TradingView, April 28, 2025
Litecoin formed a minor range, which broke out to the upside at 07:25 UTC, supported by a Golden Cross of MACD. Price spiked to the upside and formed an expanding triangle pattern. In the meantime, RSI moved above 70, indicating overbought market conditions. The expanding triangle failed to break out to either side, and another converging triangle appeared, which broke out to the upside at 17:45 UTC, supported by a Golden Cross of MACD. Price spiked to the upside but failed to form an upward-moving channel; a lower-moving channel appeared in the Litecoin price.
Litecoin at a Critical Juncture: Will 83.50 Hold or Will 88.00 Be Tested?
The channel that formed yesterday broke to the downside at 01:20 UTC, supported by a Death Cross of MACD. Price marked the day’s low at $83.70, but that downside breakout failed, and the price moved to the upside, breaking the channel to the upside at 03:15 UTC, supported by a Golden Cross of MACD. Price spiked to the upside and formed an upward-moving channel. If the upside Litecoin breakout fails, then Litecoin could mark another low below $83.50. If the upside breakout succeeds, then Litecoin may reach the level of $88.00.
Critical Levels and Momentum Confirmation
The LTC price action remains contingent on its latest bullish channel breakout. A successful hold above current levels, supported by MACD Golden Cross confirmation, could propel a retest of $88.00 resistance. Conversely, failure to sustain upside momentum risks a breakdown below $83.50, exposing lower supports. The interplay between RSI extremes and MACD crossovers has repeatedly signalled short-term reversals, underscoring their reliability in this context. Traders should monitor whether the newly formed upward channel maintains its structure or succumbs to profit-taking. Prudent risk management is advised, with tight stops below $83.50 for longs and above $87.60 for shorts, pending confirmation of the next decisive trend phase.
Litecoin Price Analysis for April 30, 2025
Litecoin traded between well-established support at $85 and resistance at $87 for most of the session. A piercing candle near the resistance level at 04:15 UTC signaled a shift, supported by a MACD crossover. Price dropped to test support, with RSI entering oversold territory at 05:15 UTC. This triggered a rebound, but momentum faded as the price again failed at resistance. An expanding triangle formed, breaking upward at 16:00 UTC with MACD support, but the breakout above $87 failed. Later, a downside test of $85 also failed, confirming indecision. Price action remained volatile yet confined within this narrow band. Let’s take a look at the Litecoin price chart and analyse it properly.
What Do Technical Indicators Suggest?
Litecoin formed a strong resistance area at the level of $87, with a support area at the level of $85. Litecoin moved within this zone for most of the time. At 04:15 UTC, the price reached its resistance level of $87 and formed a piercing candle pattern supported by an MACD crossover. Price spiked to the downside and took support at $85. At 05:15 UTC, RSI dropped below the level of 30, indicating oversold market conditions and suggesting a reversal or at least a pullback.
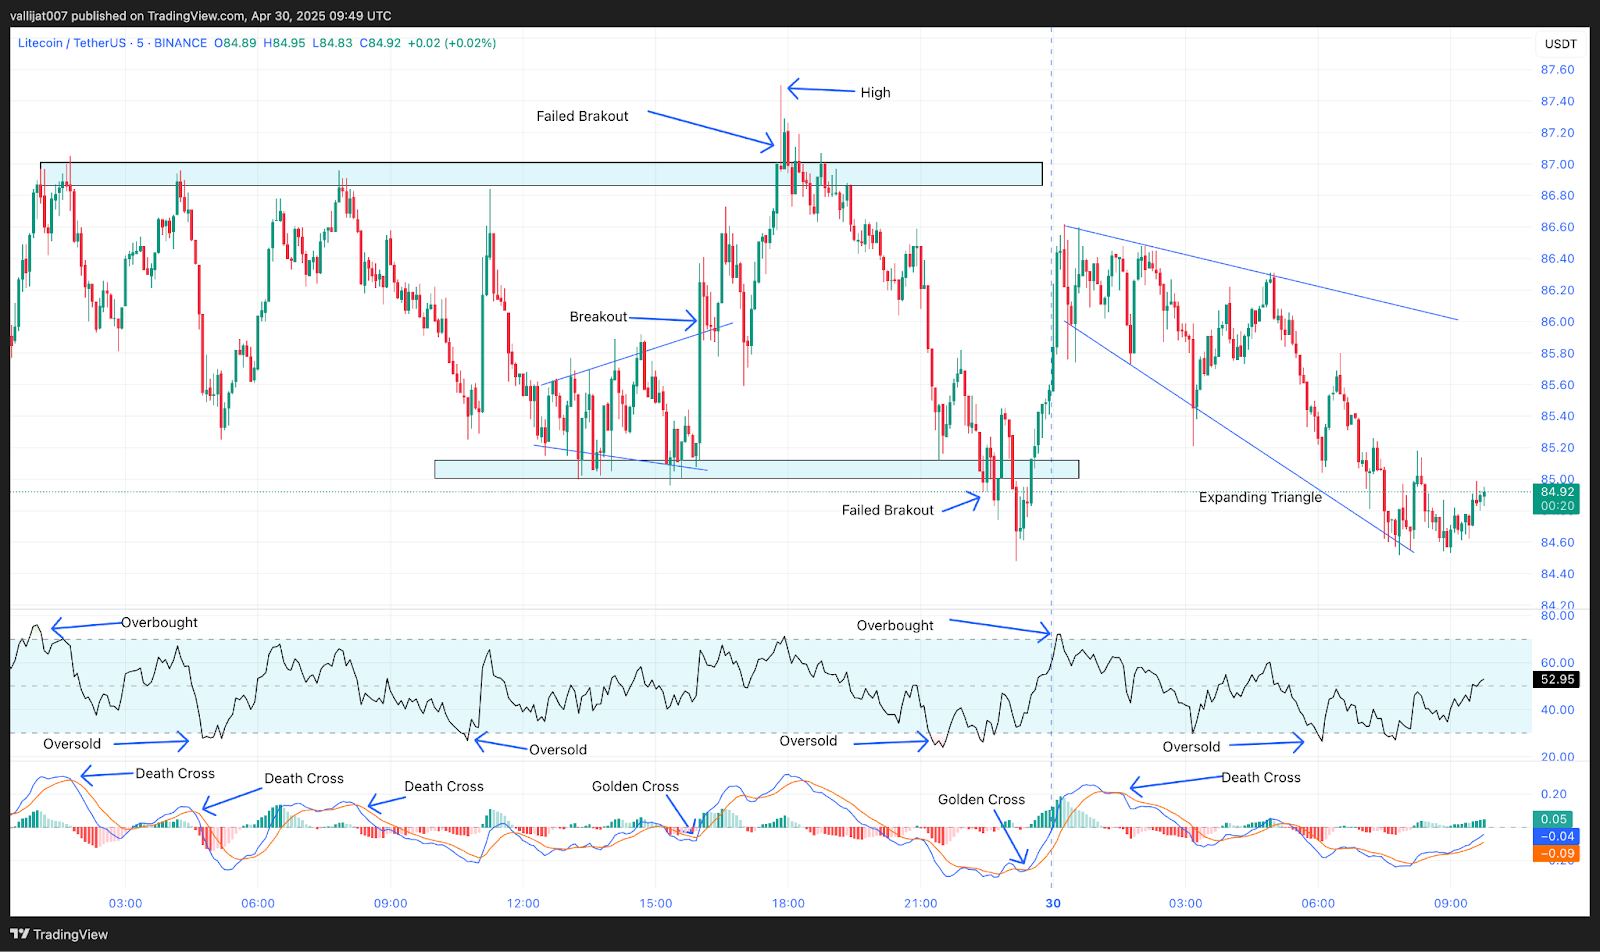
Chart 2: Analysed by vallijat007, published on TradingView, April 30, 2025
Litecoin reversed to the upside in search of sellers. At 07:50 UTC, LTC price again faced resistance in the zone and dropped to its support level at $85. An expanding triangle pattern appeared within the range, which broke out to the upside at 16:00 UTC, supported by a Golden Cross of MACD, which pushed the price to the upside. At 17:50 UTC, the price attempted to break the resistance level of $87, but the upside breakout failed, and the price dropped again in search of buyers. At 22:25 UTC, the Litecoin price broke its support area of $85, but the downside breakout also failed.
Expanding Triangle Signals Major Breakout Ahead
Litecoin continues to trade between its strong resistance and support, which is also reflected in the current price action, where the price formed a large expanding triangle, a hallmark of indecision in the market. A declining Litecoin price could push beyond $80 due to the expanding triangle breaking through support. A failed downside Litecoin breakout or an expanding triangle breakthrough to a higher point would allow Litecoin to reach the strong resistance level at $87. Litecoin to develop a clear trend, it must break through its key support point at $85 and its key resistance point at $87.
Litecoin Awaits Breakout From Tight Zone
The Litecoin price continues to move between $85 and $87, with both levels proving difficult to break. The Litecoin breakout from the expanding triangle pattern may decide the next major direction. If the LTC price breaks below $85, Litecoin could slide toward $80. Conversely, a successful breakout above $87 could spark a move higher, but recent failures suggest strong resistance at that level. RSI and MACD reflect indecision, with conflicting momentum cues. Until one of these key levels is broken decisively, Litecoin remains range-bound. Traders should avoid premature breakout trades and watch for volume and confirmation near either boundary.
Litecoin (LTC) Price Analysis of May 25, 2025
The session began with price action capped by a converging triangle pattern that marked the high at $96.06. A downside breakout triggered early bearish momentum, but the selling pressure was quickly countered as RSI dipped into oversold territory. The market responded with a recovery backed by a golden MACD crossover. What followed was a highly reactive structure of alternating channels, triangles, and ranges, with most downside Litecoin breakouts failing to develop into sustainable trends. Despite repeated pullbacks and MACD death crossovers, price repeatedly tested and held a support zone around $93.95, until a final dip breached that area, setting the day’s low at $93.84.
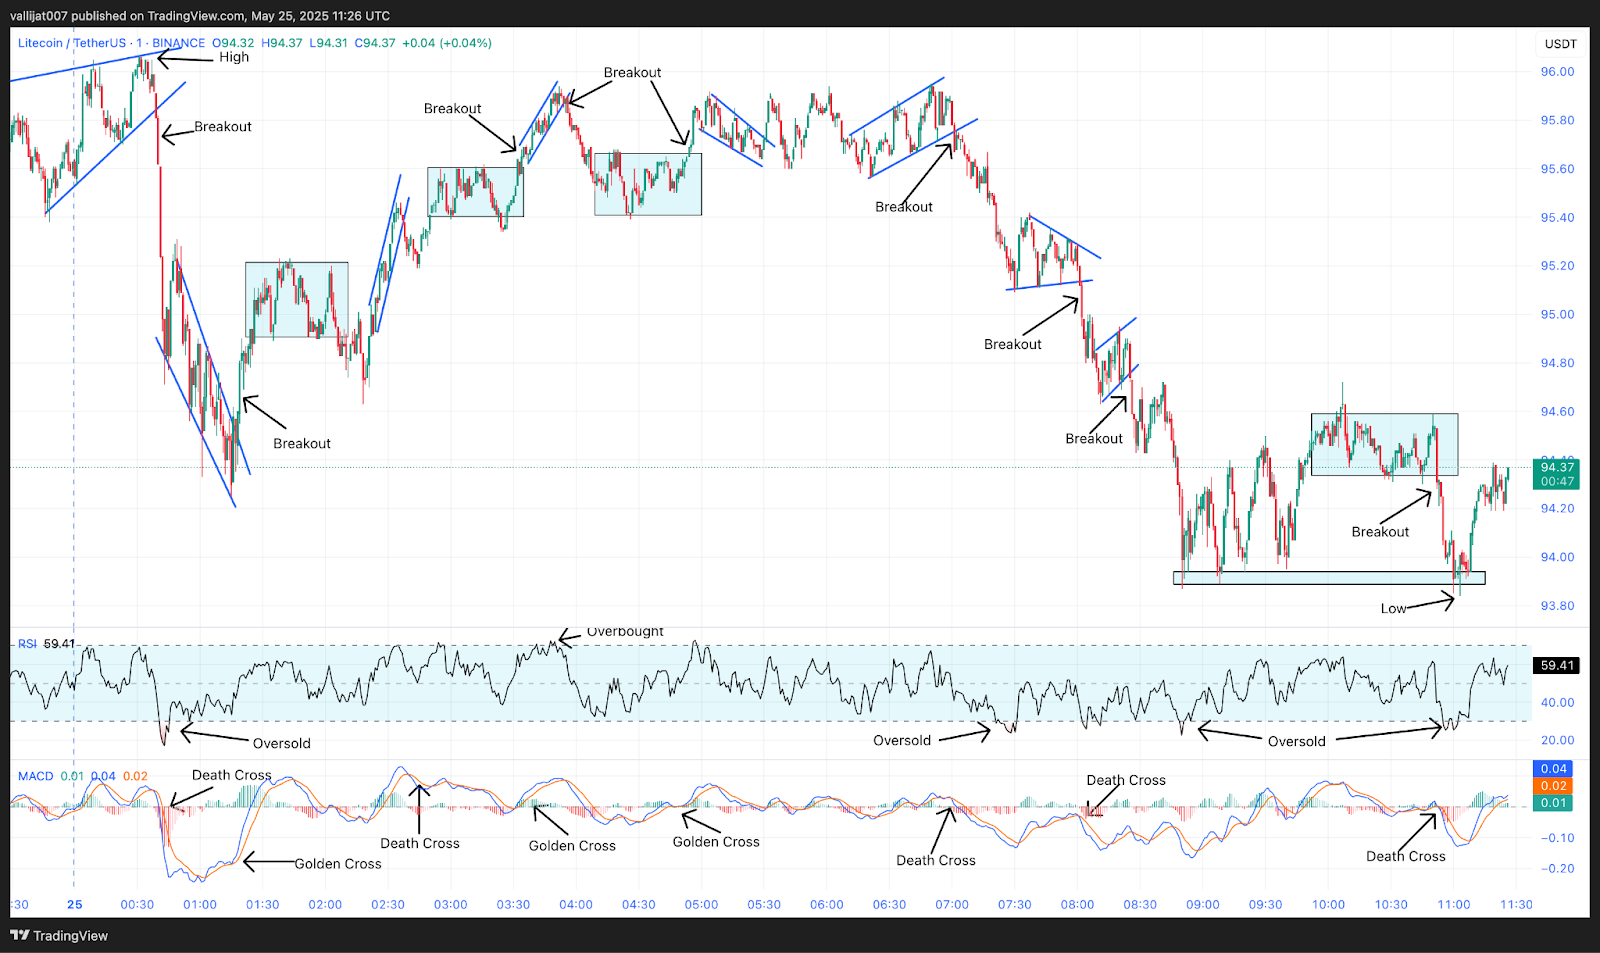
Chart 3: LTC/USDT M1 Chart, Analysed by vallijat007, published on TradingView, May 25, 2025
The converging triangle pattern marked the high for the day at $96.06. The converging triangle pattern broke out to the downside at 00:40 UTC, supported by a death crossover of MACD. LTC price moved to the downside and formed another converging triangle pattern. In the meantime, at 00:42 UTC, RSI dropped below the level of 30, indicating an oversold market condition, suggesting a reversal or at least a pullback. The second converging triangle broke out to the upside at 01:18 UTC, supported by a golden crossover of MACD. Litecoin price moved to the upside and formed a range.
Failed Breakdowns Highlight Strong Support at $93.95
The range tried to break out to the downside at 02:07 UTC, supported by a crossover of MACD, but the downside Litecoin breakout failed, and the Litecoin price rose to the upside, forming an upward moving channel. The upward-moving channel broke out to the downside at 02:38 UTC, supported by a death crossover of MACD, but the downside breakout failed, and the price formed a range. The range broke out to the upside at 03:32 UTC, supported by a golden crossover of MACD. Price spiked to the upside and formed an upward-moving channel.
In the meantime, at 03:45 UTC, RSI moved above the level of 70, indicating an overbought market condition, suggesting a reversal or at least a pullback. The upward-moving channel broke out to the downside at 03:55 UTC, supported by a death crossover of MACD. The Litecoin price moved to the downside and formed a range. The range broke out to the upside at 04:55 UTC, supported by a golden crossover of MACD. Price moved to the upside and formed a downward-moving channel. The downward-moving channel failed to break out in either direction, and an upward-moving channel appeared in the price.
The upward-moving channel broke out to the downside at 07:00 UTC, supported by a death crossover of MACD. The Litecoin price moved to the downside and formed a converging triangle pattern. The converging triangle pattern broke out to the downside at 08:02 UTC, supported by a death crossover of MACD. Price moved to the downside and formed an upward-moving channel. The upward-moving channel broke out to the downside at 08:26 UTC, supported by a death crossover of MACD. Price dropped to the level of $93.95, creating a support zone. Price then dropped below the support area, marking the low for the day at $93.84.
Failed Breakdowns Reinforce Support, But Pressure Builds
Throughout the session, Litecoin price action remained volatile yet technically contained, with most breakdowns quickly reversing, underscoring strong buyer interest at the $93.95 level. However, the final breach below this zone suggests that bearish momentum may be gaining traction. Repeated MACD death crossovers and overbought RSI signals earlier in the session point to exhaustion on the bullish side. If price fails to reclaim and hold above $93.95, further downside toward lower support levels is likely. On the flip side, reclaiming this level with strong momentum could trigger a relief bounce. Traders should stay alert for confirmed direction as the LTC price nears a pivotal decision point
Litecoin (LTC) Price Analysis of May 31, 2025
Litecoin opened the session showing early weakness, establishing a session low before quickly reversing course. Price action was marked by sharp rebounds and subsequent consolidations, beginning with a downward channel that failed to maintain its structure. Breakouts, whether to the upside or downside, largely lacked conviction throughout the session. MACD signaled multiple golden and death crossovers, yet none were followed by strong directional momentum. Overbought RSI levels signaled intraday exhaustion during bullish attempts. Litecoin’s movement through expanding triangles and short-lived channels reflected indecision, keeping the Litecoin price confined between key technical zones as traders gauged potential breakout direction.
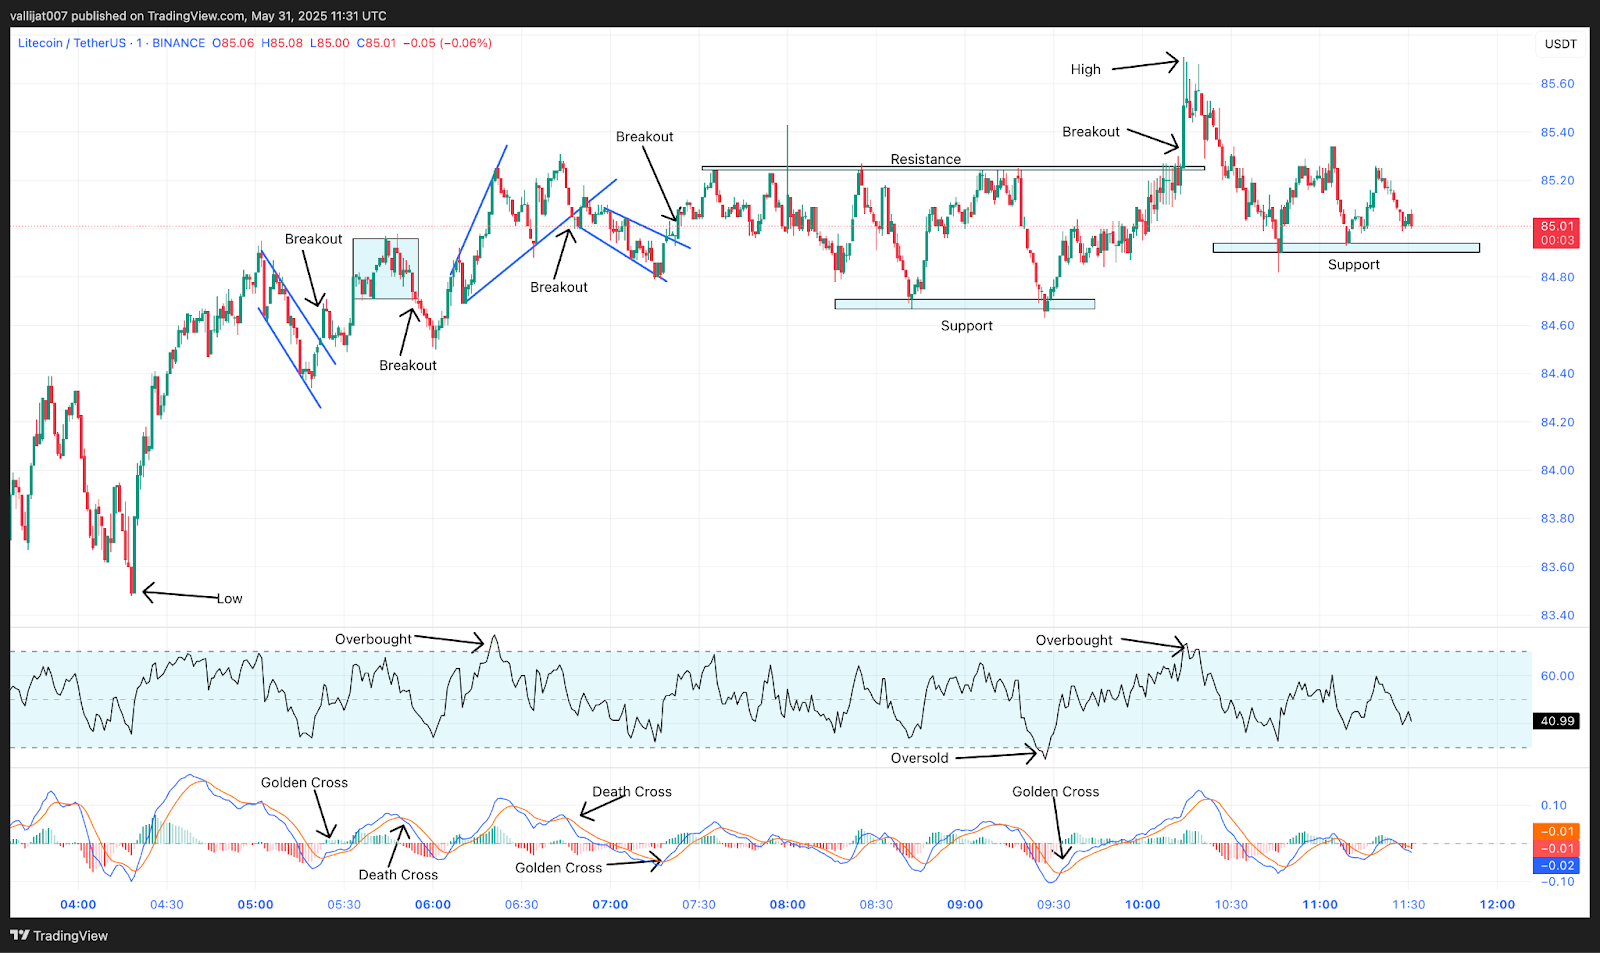
Chart 4: LTC/USDT M1 Chart, Analysed by vallijat007, published on TradingView, May 31, 2025
The Litecoin price marked the low for the day at $83.48. After marking the low, the price rapidly rose to the upside and formed a downward-moving channel. The channel broke out to the upside at 05:23 UTC, supported by a golden crossover of MACD, and formed a range. The range broke to the downside at 05:55 UTC, supported by a death crossover of MACD, but the downtrend did not sustain, and the price rose again. Litecoin price formed an expanding triangle pattern, which pushed the RSI above the level of 70, indicating overbought market conditions and suggesting a reversal or at least a pullback.
Critical Support Test: $84.00 vs. $86.00 Breakout
The expanding triangle pattern broke out to the downside at 06:47 UTC, supported by a death crossover of MACD, and formed a downward-moving channel. Supported by a golden crossover of MACD, the down channel at 07:23 UTC broke out to the upside, creating a resistance area at $85.25 and a support area at $84.70. The Litecoin price broke to the upside from the resistance area at 10:15 UTC, powered by a golden crossover of MACD, marking the high for the day at $85.71. But the Litecoin breakout failed, and the LTC price fell to $84.90, where it established a support zone.
In the meantime, at 10:15 UTC, RSI moved above the level of 70, indicating overbought market conditions, suggesting a reversal or at least a pullback. Currently, the LTC price is in a consolidation phase, where most Litecoin breakouts have failed to sustain a trend. If the price breaks to the downside from the support area, it may drop to the level of $84. If the Litecoin price holds the support and rises, it may move up to the level of $86. Traders and investors should be cautious before placing a breakout trade.
Consolidation Dominates as Market Lacks Clear Bias
Litecoin price action remains indecisive, stuck in a tight consolidation band where most breakouts fail to develop into trends. Overbought RSI conditions and failed upside pushes suggest bullish attempts lack follow-through, while support remains resilient, preventing a clean breakdown. The MACD’s mixed signals underline this lack of directional clarity. For now, LTC appears to be in a wait-and-see phase, with both buyers and sellers cautious. A strong move will likely depend on a confirmed break above resistance or a clear drop below support. Until then, traders should be careful and avoid anticipating trend continuation without confirmation.
Litecoin Price Analysis of June 11, 2025
On June 11, 2025, Litecoin (LTC) moved through a choppy trading session, marked by repeated reversals and false breakouts. The Litecoin price set a high of $93.65 early in the session before dropping to a low of $91.45. Key patterns such as converging triangles, expanding triangles, and channels played out throughout the day. RSI signals frequently indicated both overbought and oversold conditions, but momentum remained inconsistent. MACD crossovers drove most of the intraday shifts, yet failed to build any sustained trend. The session overall reflected short-term indecision and a market waiting for stronger conviction. Currently, Litecoin price is trading at $91.80.

Chart 5: LTC/USDT M1 Chart, Analysed by vallijat007, published on TradingView, June 11, 2025
Litecoin price formed a downward-moving converging triangle pattern, which had already marked the high for the day at $93.65. The converging triangle pattern broke out to the downside at 00:57 UTC, supported by a death crossover of MACD. Price moved lower and formed an upward-moving channel. At 01:00 UTC, RSI dropped below the level of 30, indicating an oversold market condition and suggesting a reversal or at least a pullback. The upward-moving channel broke out to the downside at 01:30 UTC, supported by a death crossover of MACD. Price continued lower, forming a downward-moving channel.
New Daily Low Forms at $91.45 in Downward Channel
The downward-moving channel broke out to the upside at 02:06 UTC, supported by a golden crossover of MACD. However, the upside Litecoin breakout failed as the momentum faded, and the LTC price dropped again, forming another downward-moving channel. The second downward-moving channel marked the low for the day at $91.45. This channel broke out to the upside at 03:06 UTC, supported by a golden crossover of MACD, and formed an expanding triangle pattern.
Price Establishes $92.00 Resistance and $91.55 Support Levels
RSI crossed the 70 level at 03:11 UTC, pointing to overbought market circumstances and implying a possible reversal or pullback. Supported by a golden crossover of MACD, the rising triangle pattern broke out to the upside at 03:30 UTC, and the Litecoin price established a downward-moving channel. RSI fell back below 30 at 04:12 UTC, pointing to oversold circumstances. At 04:19 UTC, the descending channel broke out to the upside.
Supported by a golden crossover of MACD, and formed a resistance area at $92.00. As price failed to break this resistance, it dropped and formed a support area at $91.55. Currently, the Litecoin price is ranging between the support and resistance levels in an attempt to break out in either direction. If the price breaks the resistance at $92.00, it may rise to the level of $94.00. If the LTC price breaks the support at $91.55, it may fall to $90.00.
$91.55–$92.00 Range Holds Key as Litecoin Price Struggles to Break Direction
Litecoin’s price movement stayed bound between resistance at $92.00 and a well-defined support at $91.55. Notwithstanding several technical indications, golden and death crossovers on MACD as well as frequent RSI extremes, neither bulls nor bears could sustain momentum. The failure to clear $92.00 keeps upside potential limited, while the inability to break below $91.55 points towards underlying support. Presently, LTC is still consolidating within this limited range. While a breakdown below $91.55 may pave the way for a retest of $90.00, a Litecoin breakout over $92.00 might propel it toward $94.00. Traders should be on the lookout for confirmation and volume.
Litecoin Price Analysis of June 18, 2025
Litecoin price opened with range-bound movement before breaking down to mark the low of the day at $84.13 at 00:26 UTC. Following this low, the price climbed into a converging triangle pattern, pushing RSI above 70 by 01:10 UTC, indicating overbought situations. Though Litecoin price action rose briefly to a session high of $85. 68, it became volatile and ran through various zones, triangle patterns, and MACD crossovers throughout the session. This repeated sequence of breakouts and failures illustrated short-term indecision with rapid shifts in momentum. Currently, Litecoin is trading at $85.00.
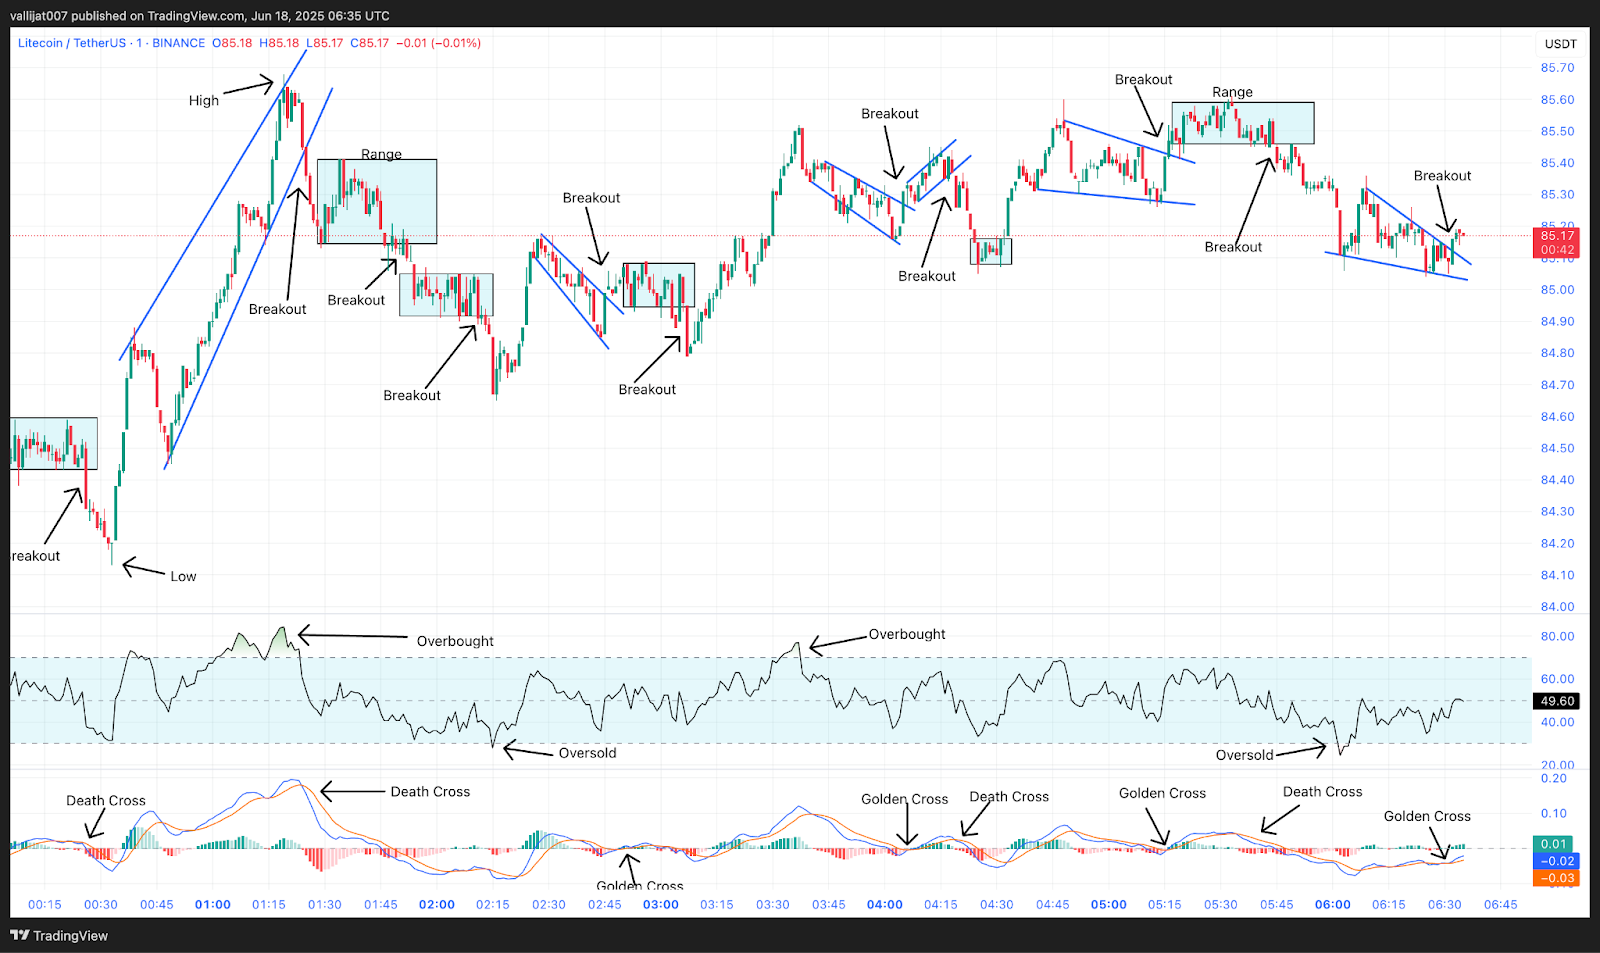
Chart 6: LTC/USDT M1 Chart, Analysed by vallijat007, published on TradingView, June 18, 2025
Litecoin price formed a range. The range broke out to the downside at 00:26 UTC, supported by a death crossover of MACD, with price moving back to the downside and marking the low for the day at $84.13. After marking the low, the price rose to the upside and formed an upward-moving converging triangle pattern. At 01:10 UTC, RSI moved above the level of 70, indicating overbought market conditions, suggesting a reversal or at least a pullback.
Daily High Established at $85.68 Before Triangle Breakdown
The converging triangle pattern marked the high for the day at $85.68. It then broke out to the downside at 01:25 UTC, supported by a death crossover of MACD, and formed a range. The range broke out to the downside at 01:52 UTC, supported by a death crossover of MACD, with price spiking to the downside, and another range developed. The second range again broke out to the downside at 02:11 UTC, supported by a death crossover of MACD, but the breakout soon failed, and the LTC price rose to the upside, developing an expanding triangle pattern.
Oversold RSI Signal at 02:16 UTC Precedes Pattern Shifts
At 02:16 UTC, RSI dropped below the level of 30, indicating oversold market conditions, suggesting a reversal or at least a pullback. The expanding triangle pattern attempted to break out to the upside at 02:46 UTC, supported by a golden crossover of MACD, but the momentum soon faded, and a range formed. The range broke out to the downside at 03:07 UTC, supported by a death crossover of MACD, but the downside Litecoin breakout failed, and the LTC price rose to the upside, forming another expanding triangle pattern.
The expanding triangle pattern broke out to the upside at 04:05 UTC, supported by a golden crossover of MACD, and formed an upward-moving channel. The upward-moving channel broke out to the downside at 04:19 UTC, supported by a death crossover of MACD, and formed a minor range. The minor range broke out to the upside at 04:33 UTC, supported by a golden crossover of MACD, and formed a converging triangle pattern.
The converging triangle pattern broke out to the upside at 05:16 UTC, supported by a golden crossover of MACD, and a range developed. The range broke out to the downside at 05:45 UTC, supported by a death crossover of MACD, and formed a converging triangle pattern. The converging triangle pattern broke out to the upside at 06:32 UTC, supported by a golden crossover of MACD.
$85.68 High Rejected as Litecoin Rebounds from $84.13 Low
Litecoin price saw a failed attempt to hold its daily high at $85.68 after early upward movement met resistance. Despite multiple bullish MACD signals, each upside Litecoin breakout lacked lasting strength. Key overbought RSI readings and successive failed breakouts indicated that buyers struggled to sustain momentum. The eventual move to $84.13 represented the day’s floor, from which LTC staged several recovery attempts. As of the final breakout at 06:32 UTC, the bullish structure remains fragile. If momentum holds, price could retest the $85.50–$86.00 zone; otherwise, a breakdown below $84.00 may expose LTC to $82.50 support.


