

Are you considering trading Meta stock and waiting for the next Meta breakout? You’re in the right place. Meta (META) stock trades within a narrow range, facing strong resistance at $593 and support at $569. This analysis will break down recent price actions, technical indicators like MACD and RSI, and what they mean for traders anticipating the next significant move. These indicators will highlight when momentum changes and give signals about overbought and oversold positions to help you make better trading decisions. Traders and investors, both short-term and long-term, can benefit from these technical signals to identify lucrative investment opportunities. Let’s dive into the in-depth analysis of Meta’s stock to predict the upcoming significant movement in the stock market.
Meta Price Analysis For May 2, 2025
The Meta stock price opened the session with a sharp move higher but quickly lost momentum and entered a volatile trading range. At the start, the price formed upward channels before it stopped short of breaking through its $593 resistance level. The downward channel development in stock price coincided with a MACD Death Cross indicator at 14:45 UTC, indicating changing market sentiment. During this price move, the RSI instrument produced overbought signals that indicated an end to the rally.
At 16:30 UTC, the Meta price maintained its narrow zone above $569 support. At 17:30 UTC, a Golden Cross on the MACD developed to trigger a temporary Meta breakout effort. The price attempt to maintain above $579 turned out to be short-lived, as this move abruptly stalled below $579. RSI started decreasing from its previous overbought state, which proved that the buyers’ influence was declining. The unsuccessful breakout showed that market forces and strong resistance prevented price movement.

Chart 1- Analysed By Anushri Varshney, Published On TradingView, May 2, 2025
The MACD generated its second death cross at 19:30 UTC to start another round of selling pressure, which affected the Meta stock. During that time, the security price moved to $569 support while the RSI indicator was below 30, indicating oversold conditions in the market. After hitting the support zone, the meta price stayed above it before it finished the day at $572.09. The $569 price level became an essential support point for the following trading day, although strong resistance continued at around $590.
What Are the Possible Price Movement Scenarios for META?
If Meta stock opens below the $569 support, it may quickly retest this level and potentially break lower, depending on volume confirmation. The resistance level at $572 has shown robust stability during current trading sessions, and successful volume-based breaks may start new downward price effects. The opening of Meta above the $579 price point might risk a price movement toward testing the $588 resistance level.
The resistance area has functioned as an effective barrier that has limited the bulls’ price advancement. Likewise, a breakdown would require the price to close below $570 with substantial volume to confirm a bearish continuation. The stock will stay within its current boundaries before breaking out of its current pattern. Market participants maintain their position and decision-making restraint as they need clear price signals to confirm entering bigger trades.
Meta Consolidates as Breakout Attempts Repeatedly Reverse
Meta stock remains range-bound as bulls and bears battle for control between $569 and $593. While temporary MACD signals suggest changing momentum, neither side has gained a decisive edge. A breakout above $593 or a breakdown below $569, accompanied by volume, would likely dictate the next directional move. Until then, consolidation is expected to continue. Substantial trading volume would need to support a meaningful breakout above $593 to confirm bullish momentum beyond the current range.
Trading for meta will likely remain within the defined range until a significant price movement occurs that might create future gap-fill scenarios during market openings. With key levels holding firm, Meta stock appears to be in a classic consolidation phase. Traders should wait for a decisive break above $593 or below $569 before entering directional trades.
Meta Price Analysis For June 12, 2025
The Meta price analysis over the last 24 hours shows an early bullish attempt that lost strength quickly, leading to a prolonged downward channel through most of the session. The price action started with a short-lived uptrend during the early morning hours, where Meta stock climbed above $704.00 but faced resistance near $707.50. This move was supported by a golden cross on the MACD and an RSI push into the overbought zone above 70.
By 14:30 UTC, the Meta price slipped into a downward channel. The trend flipped bearish with a clear MACD death cross, while the RSI dropped back below 50. Sellers stepped in, and the stock kept making lower highs and lower lows, with brief pauses in between. A minor golden cross formed around 15:30 UTC, but the move didn’t hold. Another death cross quickly followed, confirming continued weakness in the Meta stock trend.
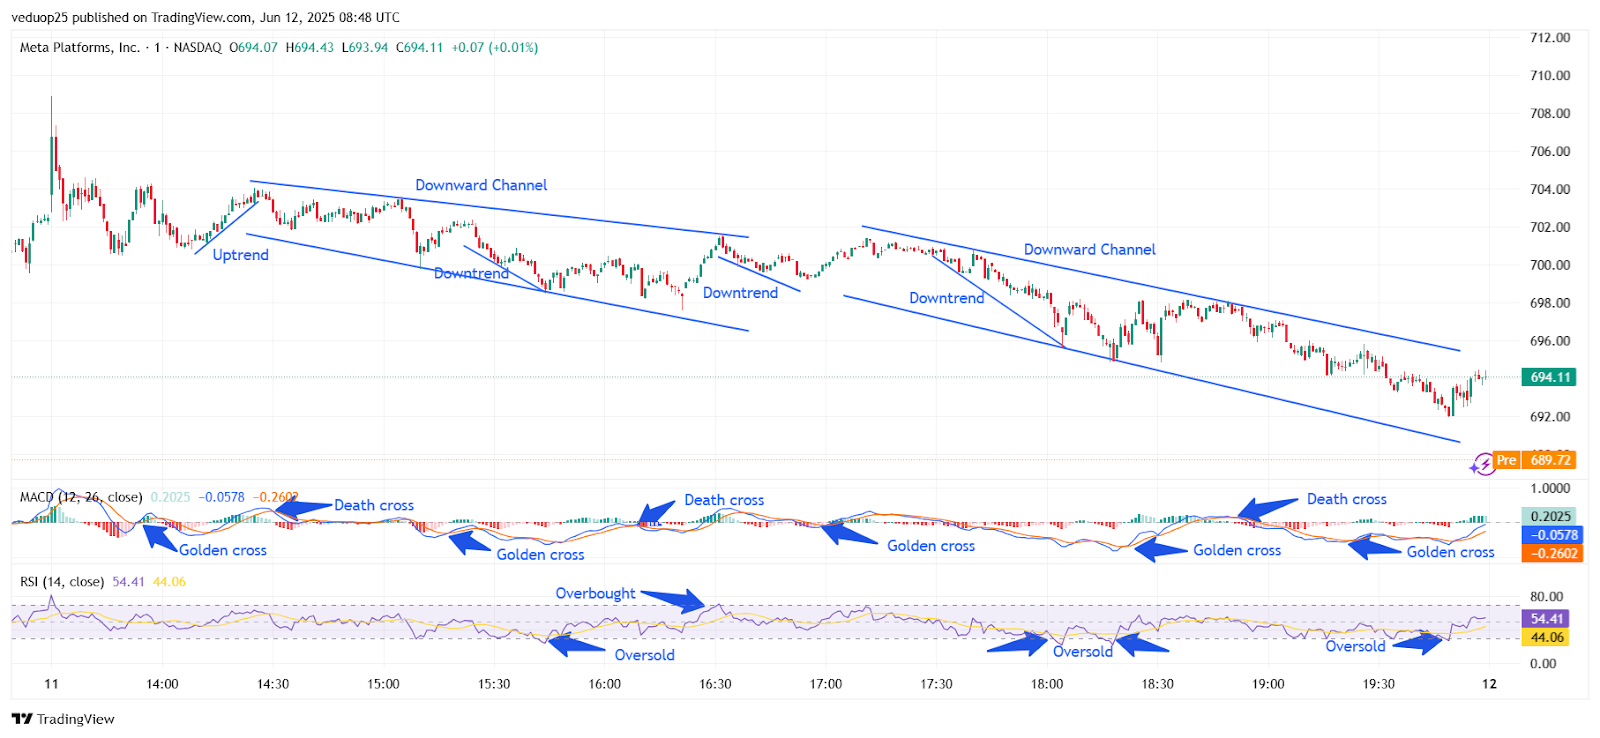
Chart 2- META/USDT M1 Chart, Analysed By Anushri Varshney, Published on TradingView, June 12, 2025
Between 16:00 and 16:30 UTC, Meta attempted a weak bounce. RSI temporarily rose above 60, but another death cross on the MACD pulled the momentum back down. The price entered another short-lived downtrend and failed to sustain higher levels. A clean rejection followed, and Meta price returned to the lower boundary of the descending channel.
Meta Price Rejected at $700 Again as Bearish Channel Holds
From 17:00 to 18:00 UTC, the Meta stock made another push, sparking hopes of a Meta breakout. A golden cross on the MACD and RSI’s steady rise above 50 gave bulls some hope. But again, the breakout attempt failed near the $700 mark. Another death cross around 18:30 UTC showed selling pressure returning fast, and the Meta price slipped back into the bearish range. Between 19:00 and 20:00 UTC, Meta hit fresh intraday lows around $692.00. RSI dipped into the oversold territory twice, confirming strong bearish pressure.
A slight golden cross appeared later, followed by a brief upward tick in price, but the overall structure stayed inside a clean downward channel. Into the final hours, Meta stock hovered near $694.00. Overall, the Meta price stayed bearish across the day, trapped in a steady downward channel. Until a clean breakout above $700 with strong RSI and MACD support, the trend remains weak.
Meta Stock Needs Strong Momentum for a Clear Breakout
The Meta stock spent most of the previous 24 hours trading within a well-defined downward channel, showing consistent weakness after failing to hold gains above $700. Despite multiple golden crosses on the MACD and a few brief RSI recoveries, the Meta price couldn’t build enough strength to confirm a breakout. Each bullish signal was followed by renewed selling pressure, keeping the price range-bound and below key resistance. The lower support near $692 held several times, showing some buyer interest, but not enough to flip the trend.
Unless the Meta stock can break cleanly above $700 with strong RSI support above 60 and a firm golden cross confirmation on the MACD, any bounce may be short-lived. The current trend remains cautious, and traders will likely wait for a decisive Meta breakout before entering aggressive long positions. Momentum needs to shift clearly to regain confidence in the Meta price action.


