
Are you keeping an eye on the Microsoft Corporation stock (MSFT) and wondering whether the tech giant is gearing up for a decisive move? Then don’t worry, we have got you covered. Let’s break down the latest MSFT price action and assess where the Microsoft stock might be heading in the short term. While the broader tech sector has been seeing mixed performance recently, Microsoft remains a key player to watch.
After some early session gains, MSFT struggled to hold momentum and encountered multiple reversals throughout the day. With that in mind, let’s dive straight into the price chart for Microsoft and uncover what the latest MSFT trends and technical signals are revealing about potential price movements.
Microsoft (MSFT) Technical Analysis for May 3, 2025
The Microsoft stock opened at a price of $431.28. The trading session began with strong bullish momentum. The price of the Microsoft stock surged rapidly from the session low, marking a clear upward trend, as the price rallied steeply toward the $439.5 level. This quick rise met resistance in the highlighted resistance zone, and the price began to reverse. Following this, a downward MSFT trend took over, and a series of red candles followed, the price declining sharply to $434.18.
MSFT – NASDAQ, M-5 Chart, analyzed by raodevansh18, published on TradingView, May 3, 2025
After losing the early gains, the price entered a trading range, consolidating sideways for an extended period between $434.80 and $436. During this phase, the price struggled to break above or below the defined range. At 15:55, another upward trend emerged as buyers pushed the stock higher, momentarily breaking the top of the previous range. However, this push too found resistance at $437.8 just below the earlier highs. A second trading range was then established, slightly higher than the previous one, showing indecisiveness among traders.
Much like the previous trading range, though, another downtrend formed after the price hit the resistance level and failed to break through. The bears took over, pulling the MSFT price back down toward the support zone near $434.80 by 18:45 UTC. A short-lived upward retracement followed but was weak in conviction and led to yet another downtrend, bringing the price to the lower boundary of the defined support level around $434.50. By the end of the session, the stock price hovered at $434.95.
Indicators Reveal Bearish Outlook for Microsoft
The MACD shows several key signals throughout the session. A golden cross early on supported the initial price rally. However, multiple death crosses appeared later, correlating with bearish moves, particularly the sharp declines post-resistance rejection. The MACD lines remained below the baseline during the latter half, indicating persistent bearish momentum.
The RSI touched overbought territory during the early surge, which preceded the reversal. Later, RSI remained below the midpoint, reflecting weak buying interest. As of now, the RSI is just below the midline, suggesting that if the bulls take over, a significant upturn may occur for the MSFT price. Overall, indicators support short-term bearishness unless momentum shifts.
Outlook and Key Levels for MSFT Price
Heading into the next session, Microsoft looks to be under short-term bearish pressure, with price action testing the lower boundary of a well-defined support level around $434.50. A break below this level could lead to a fall toward $433.50 or even $432.00. Conversely, a strong bullish push back above $436.80 could retest the resistance zone between $438.50–$439.00. Traders should watch for MACD crossover changes and RSI movements near oversold zones as early signals for reversals. Unless momentum shifts, the bias remains slightly bearish.
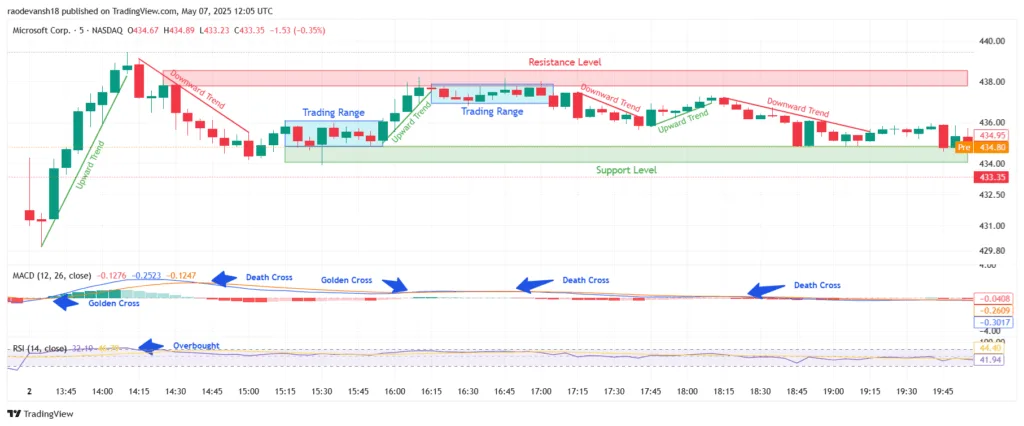
Microsoft Corporation (MSFT) Stock Price Analysis for May 7
Microsoft (MSFT) began the session at $432.18. The price started climbing early, forming a confident uptrend to $434.83 by 13:40 UTC. A notable early drop was seen, forming a large red candle that pushed the price down to around $433.41. However, this bearish move was quickly met with support at 432.8, as buyers stepped in, initiating a strong upward trend. A sequence of bullish candles followed, with the price rapidly climbing to $435.80. The uptrend slowed down at 14:35, but continued to push the Microsoft stock up, the price reaching a high of $436.7. The bullish strength persisted until the price hit the resistance zone marked near $436.75, where the rally faced rejection.

MSFT – NASDAQ, M-5 Chart, analyzed by raodevansh18, published on TradingView, May 7, 2025
This rejection led the price down to $435.21 by 16:05 UTC. However, a large bullish candle formed, supported by another green candle, leading the price up to $437.4. However, the Microsoft price found strong rejection at this level. Following this peak, the stock saw a pullback around 16:15 UTC, with a tall red candle indicating selling pressure. This initiated a minor downward trend, dragging the price to around $435.70.
Microsoft Stock Breaches Support After Rejection from $437.4
However, bulls responded quickly, lifting the price once again in an attempt to reclaim the previous highs. That effort was rejected at 17:20 UTC, and the price fell to $434.52 for support. Although a reversal was seen, the bullish push lost steam early, and the price settled into a narrow trading range between $435.88 and $434.99. This sideways movement signaled indecision between buyers and sellers and lasted until approximately 19:45 UTC.
As the session progressed, sellers gradually regained control. A sequence of small-bodied red candles marked the beginning of a slow descent. Around 19:45 UTC, bears pushed the price firmly below the trading range, resulting in a sharp red candle that drove the Microsoft stock down to $433.35 by the close. The chart closed with a strong downward MSFT breakout, suggesting that bearish sentiment dominated the latter part of the day.
Technical Indicators Suggest Bearish Opening for the Next Day
Technical indicators marked the intraday momentum shifts accurately. The MACD played a crucial role in confirming momentum reversals. Early in the session, a golden cross on the MACD coincided with the beginning of the initial bullish trend. A second golden cross matched the tall bullish candle at 16:10 UTC. Later, a death cross aligned with the transition into the late downward movement, confirming bearish momentum as the session drew to a close.
The RSI further supported the bearish thesis. In the early session, the RSI dipped into oversold territory, which matched the first bounce from support. As the Microsoft price rose, RSI gradually climbed but never reached overbought levels, signaling that bullish momentum lacked strength. Toward the end of the session, RSI hovered below 30, confirming growing weakness and a drop in buying interest.
Short-Term Pullback May Be Seen, Investors Wait for A Decisive MSFT Breakout
Looking ahead, the outlook remains cautiously bearish. The most recent death cross on the MACD, paired with declining price action and a weak RSI, suggests that bearish momentum may continue into the next session. If Microsoft fails to hold the current support zone around $433, further downside toward $430 could follow, especially if selling pressure picks up volume.
However, if buyers step in early and the RSI begins to recover, the MSFT price may attempt a short-term bounce. A bullish reversal would require a strong golden cross on the MACD and a break above the $435.5–$436.5 range to confirm regained momentum. Until those signals appear, any recovery is likely to face resistance.