

Are you considering investing in MSTR and looking for a confident, data-driven outlook before making your move? This in-depth MSTR price analysis is tailored for you, breaking down the key support, resistance, and momentum shifts seen on the 5-minute chart over the past 24 hours. Whether you’re planning a short-term trade or watching for a broader trend, this analysis offers the clarity you need to act with confidence.
MicroStrategy(MSTR) Price Analysis of May 2nd, 2025
The MSTR price action on a 5-minute chart over the past 24 hours shows a clear sequence of trend reversals between support and resistance zones. On May 2, around 13:30 UTC, the price bottomed near $380 after descending within a falling channel. The RSI hit oversold territory, and MACD confirmed a bullish signal with a golden cross. This led to a steady recovery, breaking out into a rising channel between $386 and $393. MicroStrategy stock price maintained this upward trajectory through the early afternoon session, building momentum as buyers stepped in near the lower end of the range.

Chart 1- Analyzed by Alokkp0608, published on May 3rd, 2025.
Between 15:00 UTC and 18:00 UTC, MSTR price maintained its bullish trajectory, climbing steadily within an upward channel that peaked at $404. The RSI twice touched overbought conditions during this period, signaling an overextension. MACD stayed in a bullish crossover phase but began to flatten by 17:45 UTC. The rally showed signs of exhaustion as the price approached a key resistance band between $402 and $404. A small pullback near $400 was met with another brief push higher, but this proved unsustainable. Sellers emerged aggressively just before 19:00 UTC, initiating the next reversal.
Volatility Returns as Resistance Rejection Unfolds
Between 18:00 UTC and 21:00 UTC, MSTR price failed to break through the $404 ceiling, triggering strong selling pressure. RSI dropped rapidly from overbought levels back to near 40, and MACD printed a fresh death cross. This shift in momentum confirmed that the bulls had lost control. Despite an attempt to hold the $398 level, the price failed to maintain stability and began trending down, breaking the lower bound of the earlier rising channel. Volume picked up during the decline, reinforcing bearish strength. Price action grew choppy, lacking strong support until the $392 level was tested later in the evening.
As the new trading session developed, MicroStrategy stock touched an intraday low near $392. This area had previously acted as a support-resistance flip and now appears to be a short-term holding zone. While a modest rebound occurred, it was capped at around $396. The RSI dipped again toward the oversold region, and MACD maintained a bearish configuration with widening separation between signal lines. Buyers have yet to show meaningful commitment at this level. A failure to bounce above $398 soon could expose the stock to a deeper correction, potentially dragging it toward the broader demand zone at $386–$384.
Bearish Continuation Threatens Rebound Attempt
MSTR price is currently holding near $394 after being sharply rejected from $404. Momentum indicators remain firmly bearish, with RSI hovering around 39 and MACD deep in a negative zone. Unless the stock reclaims $398 and clears $400 with sustained volume, short-term pressure will likely remain dominant. If $392 breaks down decisively, the next critical support lies near $380, which aligns with the May 2 morning low. On the upside, a MSTR breakout above $400 would neutralize bearish sentiment and pave the way for another test of $404. But for now, the trend favors continued weakness into the lower demand range.
MSTR Price Recovery at Crossroads
After a failed MSTR breakout at $404, the price has retraced sharply and now sits in a vulnerable technical position near $394. The bearish momentum is confirmed by an active MACD death cross and weak RSI, which dipped into oversold zones twice during the decline. MSTR Price is at risk of revisiting deeper support between $380 and $376 if no bullish reversal emerges above $398. Traders should watch for consolidation signs at current levels. A successful reclaim of the $398–$400 band could trigger a short-term recovery, but downside risks remain elevated unless momentum indicators begin to stabilize and turn upward.
MicroStrategy (MSTR) Price Analysis of May 7, 2025
The MSTR price action on a 5-minute chart during regular market hours on May 6, from 13:30 UTC to 20:00 UTC, shows a shaky start but a solid recovery into the close. After opening at $378.42, MicroStrategy stock dipped quickly toward $378, an interim support area, but sellers failed to extend lower. Buyers stepped in early, triggering a quick rebound to $382. This first leg helped establish a short-term floor. Despite some hesitation under $385, the MSTR price maintained a steady climb, showing early signs of resilience. RSI briefly entered oversold territory before snapping back, while MACD started to flatten, hinting at easing selling pressure. These signs laid the foundation for a constructive reversal attempt.
Chart 2- Analyzed by Alokkp0608, published on May 7th, 2025.

Between 14:15 UTC and 16:45 UTC, MSTR price moved in a tight but upward-leaning consolidation. It held mostly between $381 and $384.5, flirting with the interim resistance at $385 multiple times. Each test was met with skepticism, but buyers remained active. This back-and-forth zone served as a digestion phase following the morning rebound. RSI stabilized just below the midpoint, while MACD began turning upward, completing a golden cross around the middle of this phase. The chart showed a mild ascending base forming, suggesting a buildup rather than exhaustion. The longer the price stayed within this band without breaking down, the more likely bulls would gain control.
MSTR Breakout Holds as Bulls Reclaim Control into the Close
The MSTR breakout came during a strong run from 16:45 UTC to 18:30 UTC. MicroStrategy stock pushed above $385 with conviction, hitting $387. This move was supported by a continued MACD expansion in the bull’s favor and RSI climbing into the high 50s. The structure was clearly bullish, with higher lows and confident bids on each minor dip. Sellers took some profit near $387, but the price barely retreated. The clean break above the interim ceiling shifted the focus toward the key resistance at $392. Price was now running on firm footing, with no serious breakdowns or momentum loss.
Into the final 90 minutes of trade, price stayed calm yet constructive, holding near $386.4 to $387.2. Despite a modest dip, the prior resistance at $385 began acting as support. This kind of role reversal suggests bulls remain in control, even without fresh highs. RSI plateaued in the 55–60 zone, and MACD stayed elevated, though momentum slowed slightly into the close. The final close at $386.42 puts MSTR just $0.15 shy of its May 5 closing price of $386.57, signaling that buyers quietly reclaimed control without much fanfare. All in all, this was a quietly bullish session.
Holding Steady with Bullish Lean, MSTR Inches Toward Breakout
MicroStrategy stock looks poised to challenge the $392 resistance if bulls continue pressing higher. Price stayed firmly above $378 throughout May 6, respecting both interim and key support levels. The MSTR breakout above $385 was meaningful, turning that level into a potential launchpad. RSI behavior was constructive without being overheated, and MACD confirmed upward pressure with a steady bull cross and widening momentum. For the uptrend to continue, holding above $385 will be essential. If bulls reclaim $387 early, the path to $392 opens. On the flip side, any drop below $385 could trigger a retest of $378.
MSTR Price Analysis of May 16, 2025
The MSTR price action over the last trading session opened at $411.22, starting the session with a notable gap down from the previous day’s close at $416.65. In the first hour, price attempted to rebound slightly toward $414 but met early resistance near the $418–421 zone. Sellers quickly regained control, dragging MSTR down toward $407 between 14:30 UTC and 15:30 UTC. During this early move, RSI drifted lower from neutral to a more bearish angle, dipping below 45. Meanwhile, MACD lines started to widen downward, hinting at early bearish momentum expansion. No meaningful support was held in this phase, and buyers showed limited conviction. A weak intraday bounce near $407 failed to spark follow-through strength before more selling resumed.
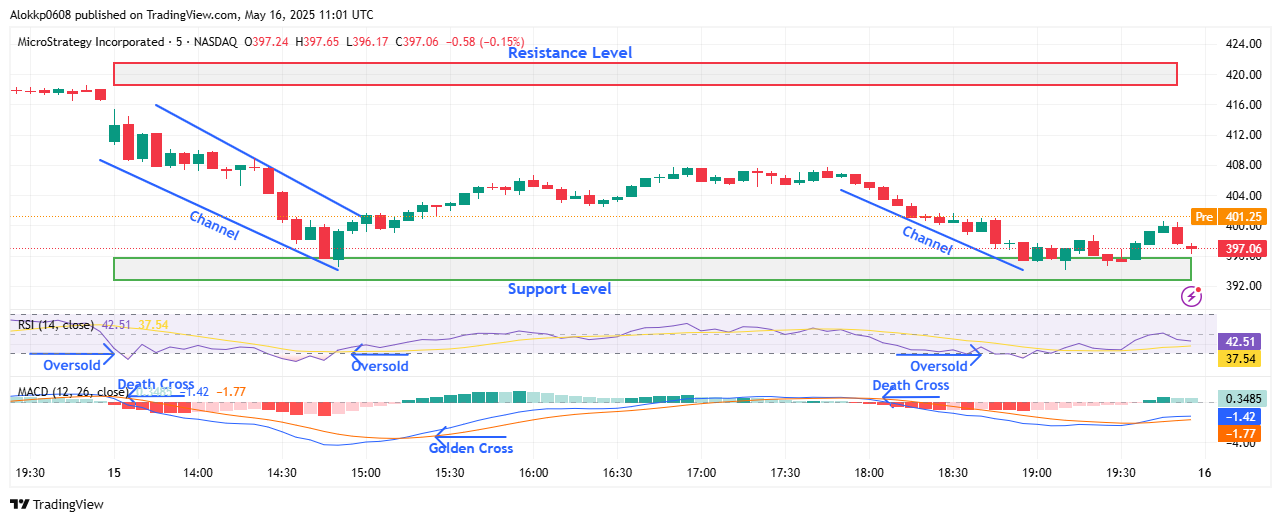
Between 15:30 UTC and 17:30 UTC, the MicroStrategy stock saw continued weakness as it dropped below $405, then slipped toward $400. Minor pauses were observed near $403, but these were short-lived, with sellers dominating each recovery attempt. MACD continued expanding downward, reinforcing strong downside pressure. RSI hovered in a soft downtrend, steadily moving toward the oversold region without sharp divergence. Around 17:00 UTC, the MSTR price dipped below the $400 psychological threshold, triggering more aggressive downside reactions. No reversal signals emerged, and the stock failed to reclaim any intraday highs. This period showed no signs of a reversal base forming, keeping short-term momentum clearly with the bears.
Intraday Breakdown Stalls Near MSTR Support Zone
From 17:30 UTC to 19:00 UTC, the MSTR price hovered near $398–400, trading sideways with modest consolidation. A brief test of $397 occurred, touching the annotated support zone of $395–391. Sellers eased slightly, allowing the RSI to flatten just above oversold levels, suggesting temporary exhaustion but not enough for a meaningful bounce. MACD began to compress but still leaned bearish. Buyers lacked the volume or strength to reclaim $400, turning it into a short-term resistance. Despite slowing losses, the trend stayed defensive. No signs of bullish divergence emerged, and attempts to stabilize had weak follow-through.
In the final hour, from 19:00 UTC to 20:00 UTC close, MSTR price slipped to close at $397.07, just above the key support band. Sellers maintained pressure, while any bullish participation remained soft and reactive. RSI ended the session in a weak zone, slightly above oversold but without an upward turn. MACD signals compressed tighter, but did not yet hint at bullish momentum return. The stock’s failure to hold $400 leaves a fragile structure into the next session, with bears in control unless a significant reversal develops near support.
Bearish Continuation Threatens Key MSTR Support Zone
The bearish momentum in MSTR now targets the support area between $395 and $391. With the stock closing at $397.07, just above this zone, a breakdown could trigger further downside toward $388–385. Momentum remains weak as sellers dominated most of the session, and the failed attempts to reclaim $400 turned that level into short-term resistance. MACD shows signs of compression but remains in a bearish posture, while RSI hovers just above oversold with no clear directional recovery. If bulls can defend $395 convincingly, a short-term bounce toward $403 is possible, but only a move above $408 would signal real strength returning. For now, the path of least resistance remains downward into support.
Microstrategy (MSTR) Price Analysis of May 21, 2025
The Microstrategy stock price action over the last regular US session began at $413.40 and initially moved sideways with slight bearish pressure, hovering just above the $413 mark. Early trading between 13:30 UTC and 15:30 UTC showed hesitation near the short-term resistance range of $414–$416. Prices struggled to break through this ceiling, forming a tight range that tested the patience of both buyers and sellers. MACD remained in a narrowing range, offering little momentum, while RSI floated near the mid-40s, reflecting indecision. This cautious sentiment began to shift slowly as candles formed higher lows, indicating early signs of a potential bullish breakout from the base consolidation zone.

By the 15:30–17:30 UTC window, MSTR price formed a subtle ascending channel, nudging closer to the resistance band again. The channel formed with a gradual bullish structure, and pressure mounted as buyers consistently tested the $414–$416 resistance zone. MACD began expanding upward, hinting at early bullish momentum. Simultaneously, the RSI climbed toward the 60s, suggesting growing buying interest but still shy of overbought territory. This accumulation phase ultimately paved the way for a MSTR breakout setup as price momentum continued pressing into the upper resistance limit, foreshadowing a stronger move.
MSTR Breakout Above $416 Clears the Way for Buyers
The MSTR breakout above $416 occurred around 19:50 UTC after a steady climb that started post-17:30 UTC. MSTR price pierced the resistance level with a clean bullish candle that confirmed follow-through rather than a fakeout. This move was supported by a renewed MACD golden cross and strong histogram expansion, showing bulls had taken control. The RSI simultaneously surged toward 70, though not yet into the overbought zone, showing buyers still had some room. The breakout was reinforced by a short-term bullish channel that had formed post-19:00 UTC, helping the price hold above the prior ceiling.
After breaching $416, MSTR price maintained strong footing just above the breakout zone. It closed the session at $417.46, continuing to respect the newly flipped support band around $414–$416. No sharp retracement followed the breakout, suggesting confidence among buyers. RSI remained elevated but controlled, while MACD momentum remained strong and positive. This close near the session high gives bulls a solid upper hand heading into the next trading day. Price action was orderly, and the breakout was clean, both of which are signs of strength rather than speculation.
Bulls Sustain Momentum Above $416 Resistance
Microstrategy stock closed at $417.46 after a clean breakout above the $414–$416 resistance zone, suggesting continued bullish momentum. Buyers appear in control with a solid session low near $406 and a steady rise into the close. The breakout occurred late but held well, reinforcing short-term support at $414. MACD shows sustained expansion after a late-session golden cross, signaling ongoing upside potential. RSI closed just under 70, showing strength but with limited risk of immediate reversal. If momentum holds, MSTR could aim for $420 next, potentially stretching toward $424 if volume supports it. On the downside, watch $414 as a short-term support and $406–$404 as the next buffer. Momentum favors bulls heading into the next session.
MicroStrategy(MSTR) Price Analysis of May 24th, 2025
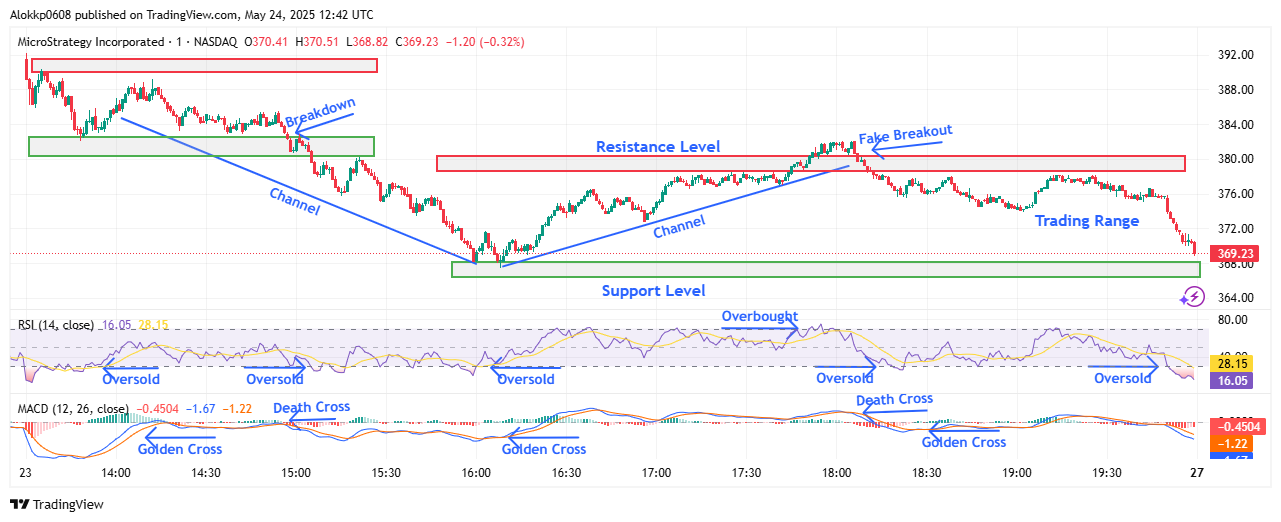
The MicroStrategy stock price action over the last regular trading session, from 13:30 UTC to 20:00 UTC, opened on a sharply bearish note. Starting at $391.50, already down from the previous day’s $399.55 close, MSTR declined swiftly, breaking below the interim support at $382 by 15:05 UTC. Selling pressure was persistent and aligned with an early death cross on the MACD just before 15:00 UTC, while RSI hovered deep in oversold territory through much of this drop. Prices moved within a clear descending channel, finding interim support near $368 by 16:00 UTC. This area briefly halted the slide, marking a low that would later prove critical as a bounce zone.
MSTR M-1 Chart, Analyzed by Alokkp0608, published on May 24th, 2025.
From 16:08 UTC, MSTR price reversed with conviction, following a MACD golden cross and RSI rising out of oversold conditions. Price formed an upward channel, and bullish momentum steadily built toward the new resistance around $380. Between 16:30 UTC and 17:45 UTC, buyers controlled the trend, pushing MSTR toward this level. Although the stock managed a breakout above $380 around 17:55 UTC, the push quickly lost strength. RSI peaked near overbought territory, indicating temporary buyer exhaustion, while MACD momentum began fading soon after the breakout.
Failed Breakout Triggers Pullback Below $380
By 18:06 UTC, the MACD showed another death cross, confirming a bearish shift as MSTR price fell back below $380. Despite holding close to this resistance for nearly an hour, buyers couldn’t reclaim ground. The trading range narrowed between $375 and $377.50, with low momentum and an RSI drifting downward toward neutral. The stock hovered just under the resistance zone, giving no clear signal of recovery strength. Selling resumed after 19:50 UTC, driving MSTR below $372 as it headed into the closing minutes.
The final move was a sharp slide that pushed the price back toward its earlier intraday low, ending the session at $369.24. The RSI once again reached oversold levels, and the MACD histogram expanded bearishly, confirming the renewed pressure. This drop reaffirmed $368 as a vital short-term support level. The consistent inability to hold above $380 now shapes the near-term ceiling for bulls.
Selling Pressure Builds as $368 Support Faces Retest
MicroStrategy stock closed the May 23 session at $369.24, signaling persistent downside momentum after an intraday fake breakout above $380 failed to hold. Unless bulls defend the $368 support level convincingly, further losses could target the $362–$360 region next. The MACD is now in a death cross zone with expanding bearish histogram bars, showing growing downward pressure. RSI remains stuck near oversold levels, hinting that any bounce may be shallow unless supported by strong volume or a MACD reversal. Resistance is clearly defined near $380, and only a breakout above this level would shift short-term momentum back toward $385. Until then, sentiment remains cautiously bearish across the current support-to-resistance band.
MicroStrategy (MSTR) Price Analysis of June 5, 2025
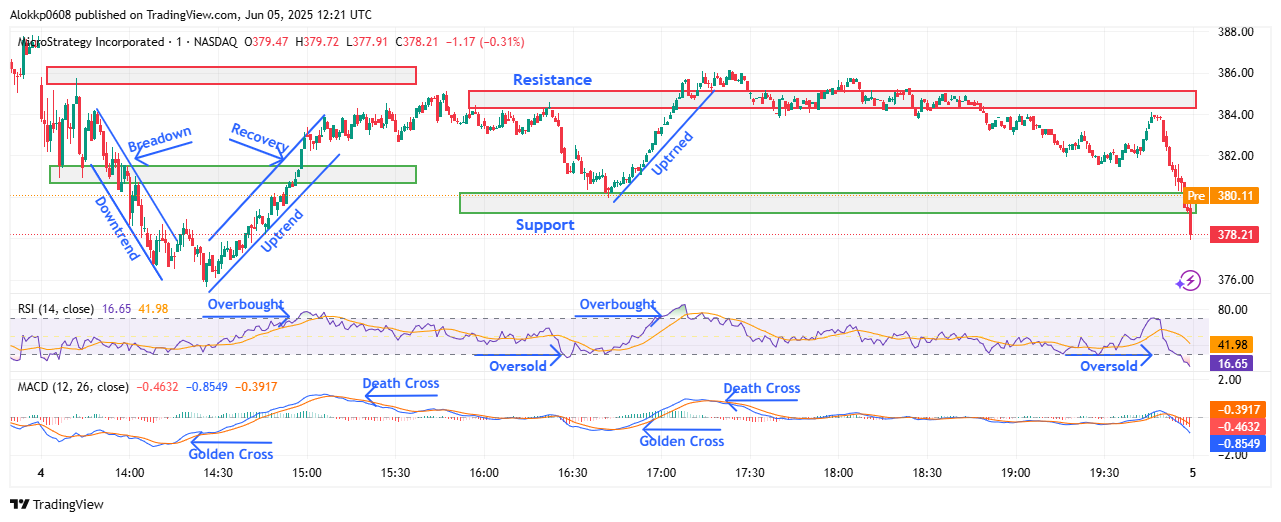
The MSTR stock price action of the last 24 hours over regular market hours, from 13:30 UTC to 20:00 UTC, opened slightly lower at $385.35, slipping into a mild downtrend within minutes. Price initially ranged between a short-term support near $381.55 and resistance at $385.45. By 13:57 UTC, sellers dominated, triggering a breakdown below support. This led to a steep decline, bottoming near $376.61 by 14:15 UTC. During this drop, RSI slipped into oversold territory, and a golden cross formed on the MACD, suggesting potential reversal interest is building. Buyers gradually stepped in by 14:26 UTC, and an uptrend emerged. Momentum strengthened through 14:58 UTC, reclaiming the $381.55 mark and signaling early recovery confidence.
MSTR M-1 Chart, Analyzed by Alokkp0608, published on June 5th, 2025.
By 15:45 UTC, MSTR reached an intraday high of $385.10, just under the earlier resistance. A short-term support base shifted to $380.20 while resistance firmed at $385.10. RSI peaked above overbought levels during this uptrend before cooling down. However, shortly after 15:09 UTC, a MACD death cross signaled weakening momentum. This was confirmed as the price dipped toward $380.20 around 16:22 UTC. By 16:43 UTC, renewed bullish effort saw another MACD golden cross, pushing prices up again. A brief breakout above $385.10 occurred at 17:07 UTC, reflecting a second attempt by buyers to surge. Yet, that momentum started fading within the hour.
Breakout Fails to Hold, Sellers Reassert Near Resistance
After hovering near $385.10 between 17:00 UTC and 17:30 UTC, price momentum weakened, as seen in the RSI gradually declining and a MACD death cross near 17:18 UTC. This signaled that the earlier bullish wave lacked the strength to sustain a breakout. Sellers pushed back effectively, pulling the price down to hover around the resistance-turned-ceiling near $384 through 19:00 UTC. Volatility reduced, but selling pressure remained consistent, rejecting upward attempts and slowly dragging the stock back toward the $381–$382 zone. RSI moved directionally downward while staying in mid-range, reflecting indecision. MACD also displayed shrinking histogram bars, reinforcing the narrative of fading bullish strength into the late session.
Between 19:00 UTC and the closing bell, MSTR price continued drifting lower, confirming a shift in session sentiment. The $380.20 short-term support failed to hold during the final hour, leading to a quick drop below it. This bearish move deepened by 19:45 UTC, sending prices closer to the earlier day’s low near $378.20. RSI fell toward oversold levels again, mirroring the earlier intraday dip. The MACD remained bearish, widening into a downtrend zone with no immediate crossover threat. The day ended with MSTR closing at $378.19, noticeably lower than its open and the previous day’s close, reflecting a complete round trip and fading intraday recovery effort.
Bearish Continuation Threatens Support Zone Below $378
MicroStrategy stock’s intraday recovery ultimately failed to hold gains, closing the session at $378.19. The late-session price retreat confirms weakening bullish momentum and growing bearish pressure. The momentum now appears tilted to the downside with fading volume and failed rallies. If sellers persist, a retest of the $376.60 low looks likely. Below that, further downside could eye the broader $373–$374 zone. Resistance remains stiff near $385.10. RSI ended near 16.6, again inside oversold territory, hinting at short-term exhaustion but not a reversal by itself. MACD remains under a death cross zone with widening bearish momentum. Unless RSI diverges upward or MACD narrows, downside continuation remains more probable heading into the next session.
MicroStrategy(MSTR) Price Analysis of June 21st, 2025
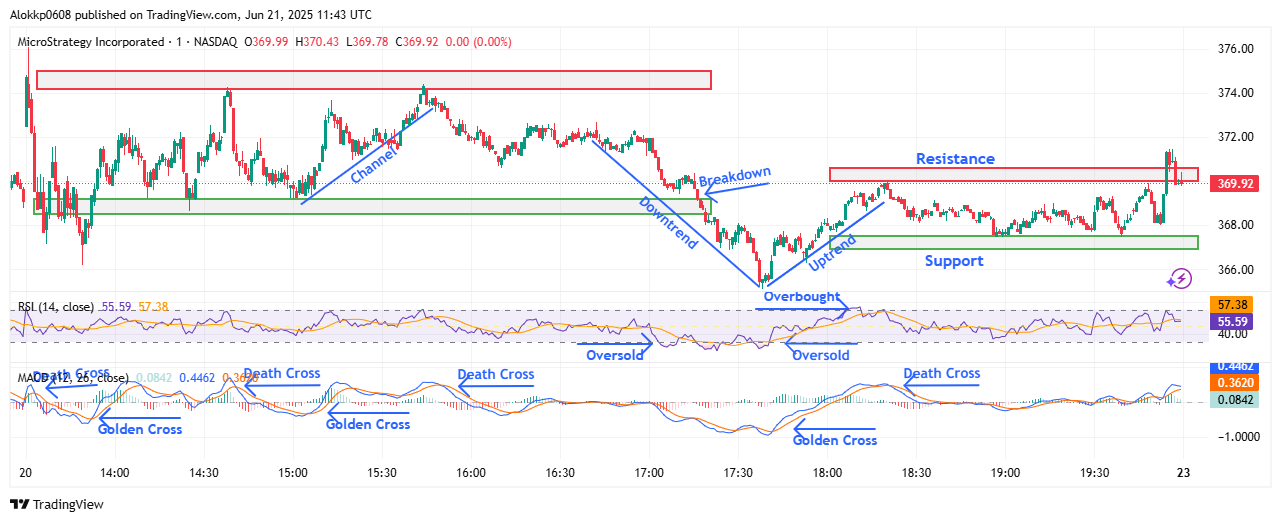
The MicroStrategy stock’s recent price action over the regular US session opened sharply lower at $372.50 compared to the previous close of $369.09. Within the first 20 minutes from 13:30 UTC, the price dipped aggressively, reaching a session low of $366.24. However, buyers quickly stepped in, lifting the stock above the initial support level of $369.20 by 13:51 UTC. The MACD showed a golden cross at that point, reinforcing the recovery, while RSI began climbing out of the oversold region. From there, MSTR moved within the range of $369.20 to $374.20 through a choppy consolidation marked by several MACD golden and death crosses, reflecting indecision and mixed momentum across the 14:00–15:30 UTC stretch.
MSTR M-1 Chart, Analyzed by Alokkp0608, published on June 21st, 2025.
By mid-session, sellers regained control. After testing the upper resistance region around $374.20 and failing to sustain momentum, prices began to decline. A death cross on the MACD around 15:49 UTC signaled weakening momentum. The price dropped to around $370.70 by 16:10 UTC and continued trending lower. The RSI dipped again, approaching oversold territory as bearish pressure built up. Eventually, a breakdown below the initial support level of $369.20 occurred by 17:17 UTC, and prices fell sharply to $365.23 by 17:38 UTC—indicating a significant shift in sentiment and exhaustion of early-day bullish attempts.
Recovery Stalls Near Resistance After Late Bounce
After hitting the intraday low near $365.23, buyers returned aggressively around 17:41 UTC, initiating an upward channel. This MSTR recovery brought prices back above the newly established short-term support at $367.50. The MACD showed a golden cross during this bounce, signaling renewed buying momentum. However, despite this optimism, the RSI only briefly entered the overbought zone before retreating. By 19:00 UTC, price movement slowed, resulting in sideways consolidation between $367.50 and the interim resistance at $370.50. Around 19:53 UTC, a sudden spike pushed MSTR briefly above this resistance, but the momentum couldn’t hold, and the price pulled back slightly before the close.
Throughout this late phase, the MACD momentum showed signs of fading with a death cross at 18:20 UTC, while the RSI failed to maintain strength above 60, indicating hesitation. Sellers remained active near resistance, capping upside attempts. Despite the short-term recovery, sustained breakout energy was missing.
Recovery Attempts Face Resistance as Bulls Test Strength
MSTR Prices closed the day at $369.93, slightly above the previous day’s close of $369.09, after recovering from a sharp intraday selloff. Although the stock staged a bounce off $365.23 and reentered a short-term uptrend, its failure to sustain above the $370.50 resistance points to fading bullish strength. The MACD showed early signs of recovery but weakened again toward the close, while the RSI hovered near 55, showing cautious optimism but no strong directional conviction. Going forward, if bulls can reclaim and hold above $370.50, the next upside target is $374.20. On the downside, $367.50 remains the key short-term support, followed by stronger backing near $365. A neutral-to-slightly bullish bias holds for now, pending a decisive breakout or breakdown.


