Are you considering investing in Netflix stock and wondering if now’s the right time to enter after its recent dip? This clear and focused NFLX price analysis breaks down all the key moves from the latest trading session. From an early bounce off support near $1,105 to a sharp rejection just below $1,160, we cover what mattered most, along with MACD and RSI signals. Whether you’re eyeing a rebound or bracing for more downside, this analysis helps you stay ahead.
Netflix(NFLX) Price Analysis of May 5th, 2025
The Netflix price action over the last trading hours from 13:30 UTC to 20:00 UTC on May 5 opened with a confident push off support near $1,105. In the first stretch between 13:30 UTC and 16:30 UTC, buyers stepped in quickly, lifting the stock into a rising channel. Netflix stock climbed steadily to $1,145 before slowing. Momentum was clear early on, MACD showed a bullish crossover with widening green histogram bars, and RSI bounced out of oversold territory to reach mid-50s. The move looked strong, but it didn’t come with an NFLX breakout, just a well-controlled grind higher.

Chart 1- NFLX M5 Chart, Analyzed by Alokkp0608, published on May 6th, 2025.
Between 16:30 UTC and 19:30 UTC, the NFLX price met resistance around $1,155–$1,160 and started moving sideways. The candles flattened out, and the upper wicks hinted at hesitation. This range held steady as price drifted between $1,140 and $1,155. MACD lost its upward slope and flattened, suggesting the earlier buying strength was fading. RSI stayed in neutral territory, bouncing between 45 and 55 without commitment. The market felt unsure, there was no big selling, but also no one willing to push higher. That $1,160 wall looked too tough to break without more volume.
Failed NFLX Breakout Attempts and Bearish Signals
As the session approached its final stretch between 19:30 UTC and 20:00 UTC, the Netflix price lost its grip above $1,140. Sellers started to press, and the price fell quickly to $1,133. That dip broke the bottom of the consolidation zone, marking a clear rejection of the earlier highs. MACD crossed bearishly just before the close, and red histogram bars started building. RSI dropped back to the 30s, hinting that bearish momentum was picking up again. This wasn’t a violent breakdown, but it was decisive. Buyers who were hoping for an NFLX breakout above $1,160 likely got flushed out by the close.
Price settled near $1,133 at the end of the day, right above key support from the earlier breakout zone around $1,130. That area now becomes crucial for the next session. If NFLX holds that zone, a rebound toward $1,145 is still possible. But if sellers stay active and drag it below $1,130, the next soft spot sits near $1,110. Both MACD and RSI point to weakening momentum, so bulls may need to step in early during the next session if they want to turn things around.
NFLX Bears Gain Momentum as Price Slips Below Key Range
Netflix price ended the May 5 session on a weaker note after losing momentum near $1,160 and closing under $1,135. MACD flipped bearish in the final hour, and RSI moved closer to oversold levels. The failure to break above $1,155–$1,160 opened the door for a drop toward the $1,130–$1,110 support band. If bulls can’t reclaim $1,140 early in the next session, more downside pressure is likely. For now, the tone is cautious and leaning bearish as momentum indicators shift against the buyers, all within the clearly defined US trading window.
Netflix(NFLX) Price Analysis of May 7th, 2025
The Netflix stock price action over regular U.S. market hours on May 7 started with a calm open at $1138.1, just a few cents under the previous close. In the first hour (13:30–14:30 UTC), the stock traded sideways, holding near $1140 with little urgency from either side. But just before 15:00 UTC, buyers stepped in and pushed the price through the $1146 short-term support zone, turning it into a springboard. Momentum picked up quickly, lifting the stock above $1150. During this stretch, RSI climbed but stayed well below overbought territory, a sign of controlled strength. MACD also began to lean bullish, showing early signs of a golden cross as the session gathered steam.
Chart 2- NFLX M5 Chart, Analyzed by Alokkp0608, published on May 8th, 2025
By 15:30 UTC, the move had legs. NFLX price continued to rally and reached as high as $1157 around 16:00 UTC. Price action from 15:00 to 16:30 UTC was clearly bullish, but not overheated, no signs of panic buying or forced short-covering. Instead, the price floated higher in clean waves, respecting every small dip. The RSI hovered in the 60s, showing buyers were in control without getting reckless. Meanwhile, MACD lines crossed firmly into bullish territory, expanding upward with good spacing between the signal lines, a healthy NFLX market trend continuation signal. The $1162 interim resistance came into view, but the stock stayed just below it for now.
Steady Climb Faces Resistance Near $1162
The next stretch, from about 16:30 to 18:30 UTC, showed Netflix stock settling into a tighter range just beneath that $1162 resistance. It made several quiet pushes toward it but couldn’t close above it convincingly. Buyers didn’t retreat, though; they just paused. Price held above $1155 through most of this phase, a sign that the earlier gains were being accepted. RSI stayed elevated, but no longer climbed, hovering sideways around 55–60. MACD started flattening too, suggesting the strong momentum was cooling, but not reversing. There wasn’t any real selling pressure, just a pause in upside energy.
Then came a late-session flicker. From 18:30 UTC to the close, NFLX price made a few more attempts to clear $1162. One candle pierced it briefly, reaching $1165, but it didn’t hold. Price closed the day at $1156, still a solid gain from the open, but slightly below the high. Buyers showed they’re still around, but the hesitation near $1162 suggests they’re watching that $1170–1175 zone closely. RSI dipped a bit as momentum eased, but it remained neutral. MACD stayed positive with a gentle slope, no bearish crossover yet, just signs of a stock catching its breath.
Netflix Eyes $1170 but Needs Stronger Push
Overall, NFLX price showed strong, steady upward momentum on May 7, climbing from $1138.1 at the open to $1156 by the close. That’s a healthy daily gain, with buyers showing control but not overextending. The NFLX market trend is still bullish, but the price is clearly respecting the $1162 resistance zone. If it breaks that level with volume, a move toward $1170–1175 looks likely. Short-term support sits at $1146, and if that fails, the $1136–1131 base becomes critical. Momentum indicators are still on the bulls’ side: RSI is steady, not exhausted, and MACD remains in a mild golden cross with space to grow. As long as those hold, Netflix looks set for another push, but it’ll need stronger conviction to clear the next ceiling.
Netflix (NFLX) Price Analysis for May 12th, 2025
The NFLX price action during regular U.S. trading hours on May 12 opened at $1138.80, showing a modest bullish gap from the previous day’s close at $1134.16. In the first 60 to 90 minutes, the stock dipped slightly but held firm above the $1134–$1131 support zone. Early sellers attempted to retest the lower range, but the downside was quickly absorbed. RSI bounced upward from near-oversold territory, while MACD, having flattened overnight, began curling upward slightly. By 15:00 UTC, NFLX had recovered from its morning weakness and hovered near $1136–$1138, suggesting buyer defense around support was working. Despite low urgency, the stock maintained a cautiously bullish tone and resisted revisiting deeper lows.
Chart 3- NFLX/USDT M5 Chart, Analyzed by Alokkp0608, published on May 12th, 2025.
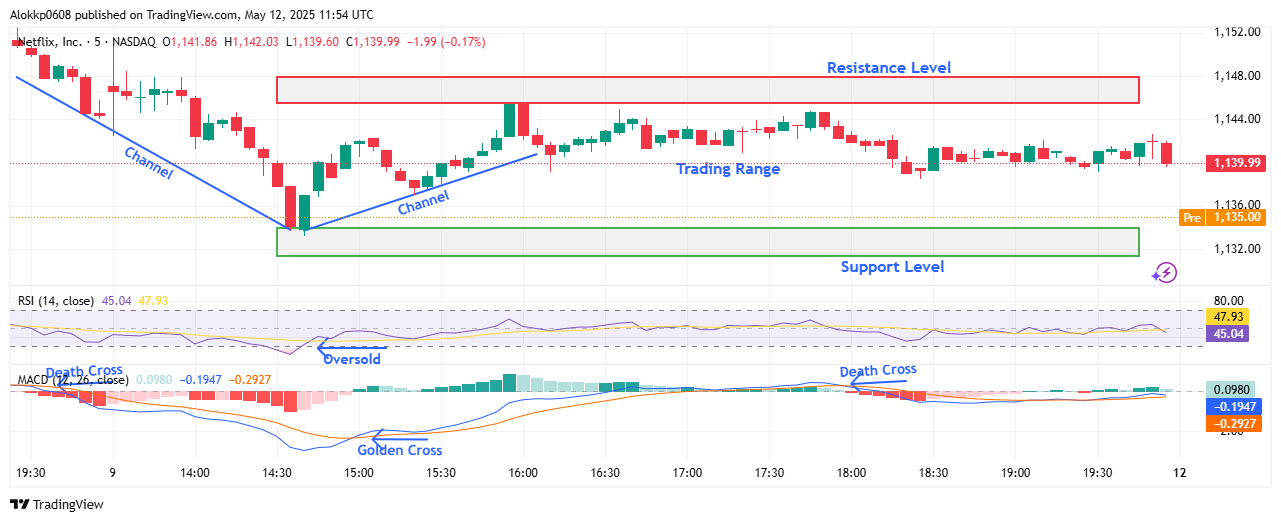
Between 15:00 UTC and 17:30 UTC, Netflix stock gradually pushed upward as buyers gained confidence. The price climbed steadily into the $1140–$1142 range, nudging closer to the key $1145–$1148 NFLX resistance zone. RSI rose through the 50s, signaling improving strength, and MACD showed early signs of expansion, confirming upward momentum was starting to build. While the move lacked speed or volume surges, it reflected steady accumulation. Minor dips were consistently bought around $1138, and the NFLX price closed several candles above this level. The $1134–$1131 short-term support range remained untouched during this stretch, reinforcing the idea that sellers had backed off, at least temporarily.
NFLX Momentum Slows Just Below Resistance at $1145
From 17:30 UTC to 19:00 UTC, the upward move began to stall just beneath the $1145 NFLX resistance level. NFLX hovered in the $1142–$1144 band, but buying power showed signs of fatigue. RSI began to plateau just below the 60 mark, and MACD’s histogram bars narrowed, indicating reduced bullish momentum. Sellers didn’t force a reversal, but buyers were no longer as assertive. The stock remained above $1138, which still marked a solid intraday floor, yet the market showed indecision near a key ceiling. Price stayed pinned in a tight zone, waiting for a breakout that didn’t come as the session moved toward its final hour.
In the final hour of trading, the NFLX price remained in a narrow band between $1140 and $1144, eventually closing the session at $1140. This small gain over the open reflected stability but not breakout energy. MACD flattened further, and RSI held neutral ground, suggesting a cooling phase rather than a strong continuation. Buyers had won the early battle of support, but couldn’t breach the $1145–$1148 key NFLX resistance area by session’s end. Still, price never threatened the $1134–$1131 support range again after the early test. The day closed with quiet strength and a cautiously bullish tone, leaving the next directional move to be decided soon.
NFLX Momentum Cools as Resistance Holds Strong
Netflix stock ended the trading session at $1140, just above its $1138.80 open and well above the previous day’s close of $1134.16. Buyers successfully defended the $1134–$1131 short-term support zone, using it as a base for a steady intraday climb. However, the stock lost steam as it approached the key $1145–$1148 resistance band. MACD initially expanded but faded by the close, and RSI stalled in the upper 50s. Momentum is currently neutral with a slight bullish lean, but a breakout above $1145 remains the key to upside continuation. If breached, the NFLX price could target $1150 and beyond. Until then, bulls must defend $1138 and, more crucially, $1134 to avoid losing short-term structure in the next session.
Netflix(NFLX) Price Analysis of May 17th, 2025
The NFLX price action over the regular US session on May 16 opened strong at $1195.68, quickly dipping on early selling pressure but holding above the $1190 mark. In the first hour (13:30–14:30 UTC), prices swung downward toward $1191 before buyers stepped in. Despite a weak opening push, the price avoided a breakdown near the short-term support zone around $1188, showing that demand still lingered. RSI briefly touched the overbought zone early in the session but soon began to retreat. Around 14:30 UTC, MACD showed a bearish crossover, with momentum briefly favoring sellers before flattening out. The price began to recover slowly, forming a minor rising channel into the afternoon.
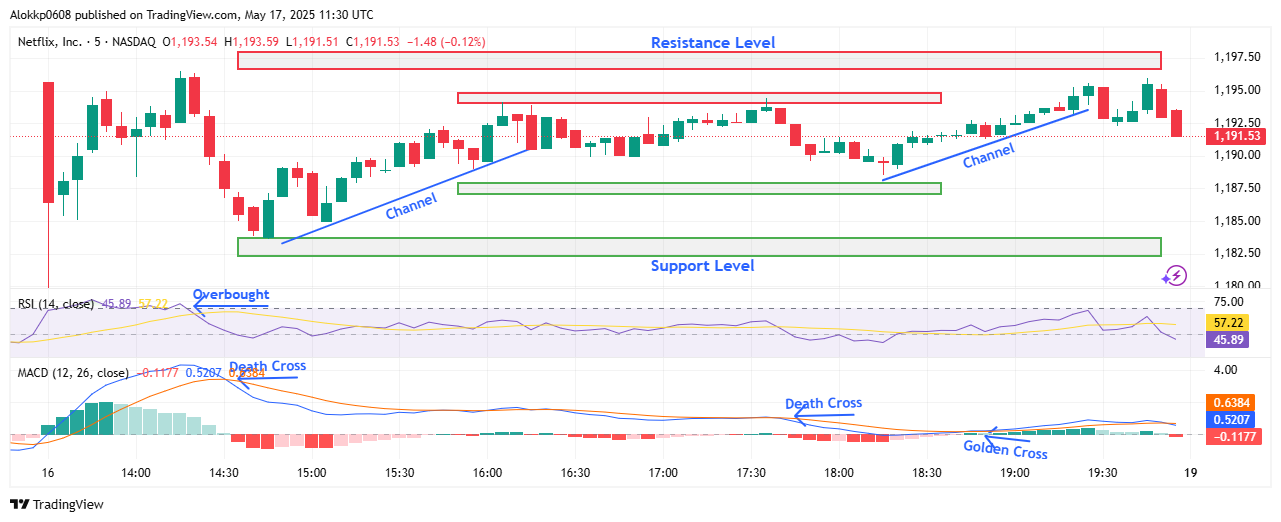
From 14:30 UTC through 16:30 UTC, NFLX price climbed steadily in a stair-step fashion, with bulls pushing it closer to $1194. This interim NFLX resistance was tested multiple times but capped upside attempts, forming minor consolidation under that level. The rising channel remained intact, suggesting buyers were still active, though cautious. RSI climbed toward the mid-50s and remained stable, reflecting balanced momentum. MACD flattened after the early death cross but did not expand bearishly, signaling indecision more than strong downward pressure. The stock hovered near the $1192–$1194 range by mid-session, as bulls appeared to pause ahead of stronger resistance at $1196.
NFLX Fails to Break $1196, Momentum Pauses
Between 16:30 UTC and 18:30 UTC, Netflix stock made its strongest bullish attempt of the day. Price pushed through $1194 and briefly approached the key NFLX resistance zone at $1196–$1198. However, sellers defended the region aggressively, forcing a pullback. The move triggered a bullish MACD crossover, but follow-through momentum remained weak. RSI rose toward the upper 50s but failed to reclaim overbought territory. The price retreated into the prior rising channel, signaling that bulls lacked the conviction to extend gains past key resistance. Despite this, the stock managed to avoid sharp reversals and held its ground just below $1194.
In the final stretch between 18:30 UTC and the closing bell at 20:00 UTC, NFLX price stayed within a narrowing range, gradually drifting back toward $1191.60. This closing level was slightly below the open, representing a modest intraday loss. The price repeatedly touched the lower end of the short-term channel but avoided a breakdown into the $1188 support region. RSI softened and turned sideways, reflecting waning buying energy. MACD lost its recent bullish tilt and began to flatten again. Overall, the session closed with cautious consolidation, as both bulls and bears refrained from strong moves late in the day.
Consolidation Below $1196 Caps Upside, Bulls Need Follow-Through
Netflix stock ended the session at $1191.60, just below its opening price of $1195.68, after a volatile yet ultimately range-bound day. Price action respected the rising channel for most of the afternoon but was capped firmly by NFLX resistance around $1196–$1198. The stock’s failure to break this key zone signals hesitation from buyers and suggests any NFLX breakout will need stronger momentum. The RSI is currently softening toward the mid-40s, indicating fading bullish strength. MACD flattened after a brief golden cross, reflecting a neutral-to-bearish momentum shift. Going forward, holding above $1190 will be key for bulls. A break below $1188 could invite further downside toward $1184. If buyers reclaim $1194 with strength, the door to $1198 may reopen.
Netflix (NFLX) Price Analysis of May 20th, 2025
The NFLX price action over the last regular US session started with a bearish gap, opening at $1172.84, well below the prior close of $1191.52. Within the first hour (13:30–14:30 UTC), the price tested the short-term support zone near $1175, briefly dipping to $1174.10 before bouncing back. This early NFLX recovery effort signaled that buyers were active near the lower boundary of the key $1178–1175 support range. RSI during this phase climbed steadily from oversold territory toward the mid-40s, hinting at shifting momentum. The MACD, while still in a bearish crossover, began flattening. As the session progressed toward 15:30 UTC, the price slowly climbed above $1180, suggesting cautious accumulation as bears failed to push further down.
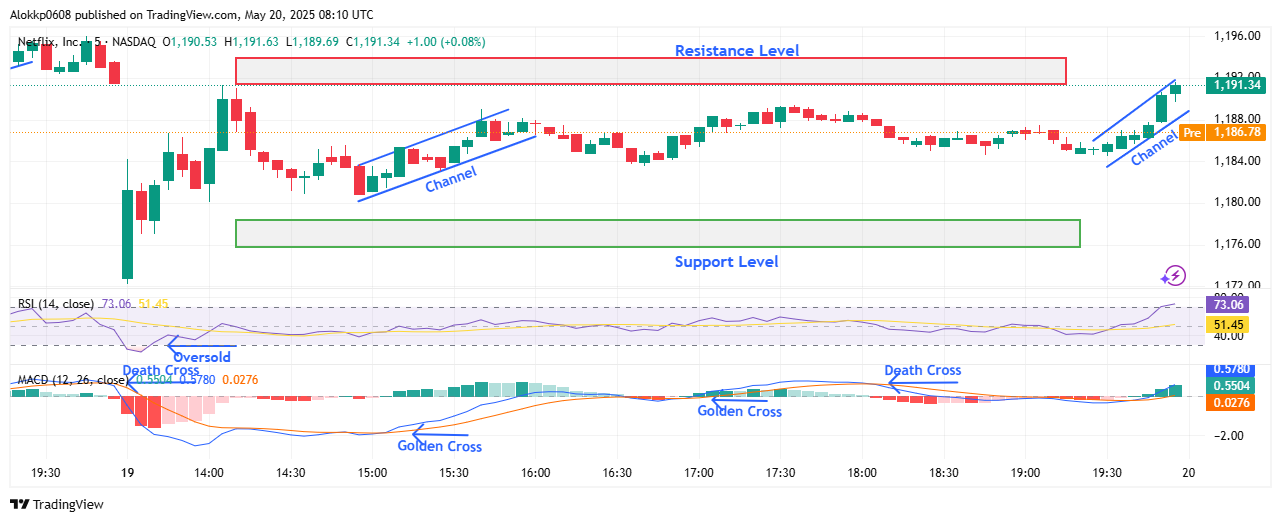
Between 14:30 UTC and 16:30 UTC, Netflix stock maintained a slow, methodical rise with tight price action between $1182 and $1187. Sellers remained present near the $1188–$1190 zone, just below the key resistance area of $1191–$1194. Despite the pressure, the stock avoided any deep pullbacks, consolidating above $1183. This showed growing intraday confidence, supported by MACD beginning to curve upward toward a neutral stance. RSI hovered in the high 50s by 16:30 UTC, indicating a gradually strengthening bias. The stock lacked any major surge, but its refusal to revisit earlier lows marked a clear base-building phase before the late session.
Late NFLX Recovery Closes the Gap with Resistance Test
From 16:30 UTC to 18:30 UTC, NFLX price gained more energy, crossing above $1190 and briefly tagging $1192. This move effectively erased the opening gap and placed the price right at the lower edge of the key resistance range ($1191–$1194). A slight pullback followed around 18:45 UTC, but buyers stepped in near $1188, keeping the price within striking distance of a breakout. MACD shifted into a modest bullish expansion during this stretch, reflecting real momentum support. RSI continued its ascent toward the low 60s, showing a healthier trend forming. The volume also saw a mild uptick, confirming buyer participation as the session neared its final hour.
In the final 90 minutes of trading, the NFLX price hovered in a narrow range between $1189 and $1192, showing signs of equilibrium. Attempts to break past $1193 stalled, and the price finally closed at $1191.30, just under the previous day’s close. Although this technically marked a red day, the NFLX recovery from the open was significant. RSI ended near 63, while the MACD stayed in a mild bullish zone, showing continued upward interest. Sellers were unable to push below the earlier short-term support, and buyers stayed active at each dip, especially in the $1185–$1188 range.
NFLX Price Recovery Eyes a Push Beyond $1194
The late-session recovery in Netflix Stock signals bullish intent, especially as the price closed just under the resistance ceiling of $1194. Momentum appears to favor buyers heading into the next session, with MACD expanding slowly in a bullish direction and RSI sustaining its rise above 60. If bulls can drive a clean break above $1194 early, the next upside target could land near $1202–$1205. However, failure to reclaim this resistance could lead to consolidation back into the $1185–$1178 range. Overall, the intraday NFLX recovery restored short-term confidence, and as long as NFLX holds above $1178, the path of least resistance leans higher. The $1175–$1178 zone remains key support for bulls to defend in the coming session.
Netflix (NFLX) Price Analysis of May 23, 2025
The NFLX price action over the last trading session shows a volatile yet technically structured movement. Opening May 23 at $1193.11, the stock initially attempted to reclaim higher ground but ultimately closed weaker at $1187.53, marking a pullback from the previous close of $1194.23. The early session was defined by indecision, with price fluctuating near the $1190 level, lacking directional strength.
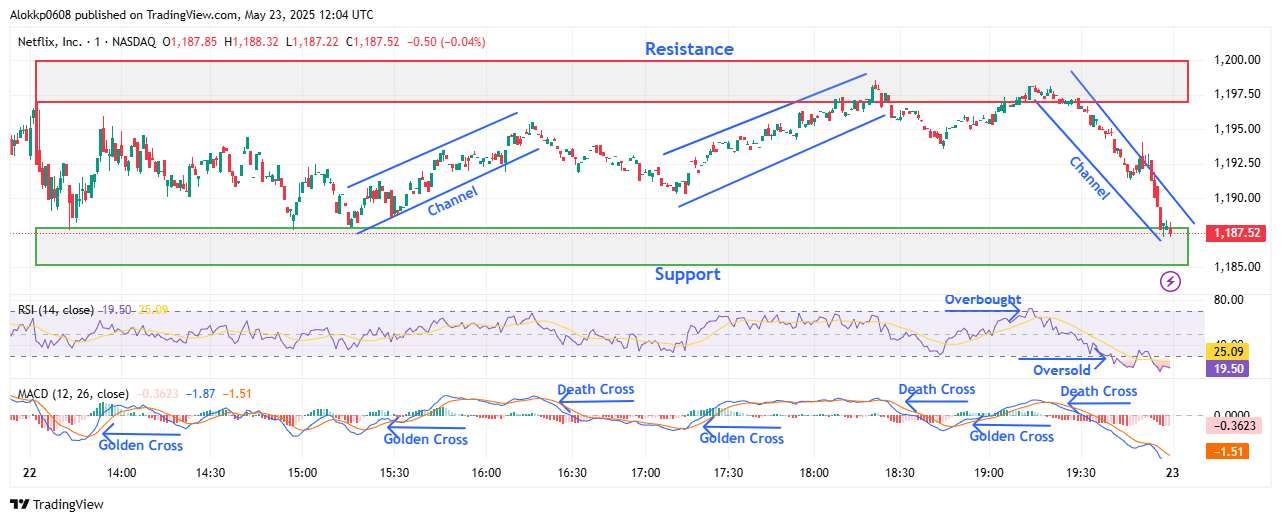
NFLX/USDT M-1 Chart, Analyzed by Alokkp0608, published on May 23rd, 2025.
Between 13:30 UTC and 16:30 UTC, the Netflix stock broke out of a tight consolidation range near 14:45 UTC, marking the first Higher Low (HL) followed by a Higher High (HH). This established an ascending trend channel with upward momentum. MACD showed a Golden Cross early in the session, aligning with this upward break. The RSI hovered in the 50–60 zone, indicating positive but not overbought sentiment. The rally extended toward the $1197–$1200 Key NFLX Resistance Level, with price peaking near $1198 before forming a Lower High (LH) around 16:00 UTC.
Bullish Trend Fades Near Resistance, Bearish Signs Build
Between 16:30 UTC and 18:15 UTC, another upward channel formed as the Netflix stock produced fresh Higher Lows and Higher Highs, attempting to retest the NFLX resistance ceiling. This secondary push failed again below $1198, solidifying the area as a strong rejection zone. Another Golden Cross appeared on the MACD around 17:15 UTC, but this momentum soon faded. RSI peaked above 70 by 18:30 UTC, hitting Overbought territory—a typical precursor to reversal when paired with rejection from resistance.
After 18:15 UTC, the NFLX price broke the rising structure and entered a defined downtrend channel. The move was led by a sequence of Lower Highs (LHs) and Lower Lows (LLs), with the selling accelerating near 19:15 UTC. The MACD confirmed the shift with multiple Death Crosses, while RSI sharply dropped into the Oversold region around 19:35 UTC, hitting levels below 20. The sell-off sliced through the $1190 mid-pivot and pushed toward the critical Support Zone of $1188–$1185.
Bearish Close Above Support Keeps Downside Pressure Alive
NFLX price ended the session at $1187.53, just above the lower boundary of the support zone. The late-session downtrend failed to produce any new Higher Lows or break the Lower Low structure, suggesting bearish momentum remains dominant. While RSI did start to recover slightly from oversold conditions, the MACD lines continued to diverge negatively, reinforcing the downward bias. Buyers showed mild interest near $1185, but without a confirmed reversal pattern, this remains a fragile base.
NFLX Near-Term Momentum Hinges on Holding $1185
Netflix stock’s near-term direction will depend heavily on how it behaves around the $1185–$1188 support range. If this zone fails to hold, further downside toward $1183 or lower is likely. However, a recovery above $1190 with a confirmed Higher Low would shift short-term momentum back toward $1195 and challenge resistance once again at $1197–$1200. Momentum indicators like RSI suggest potential for a relief bounce, but unless a bullish structure forms with new Higher Highs, the bears remain in control.
Netflix (NFLX) Price Analysis of June 11th, 2025
The NFLX price action during the last regular trading session opened at $1227.35 and quickly showed signs of weakness. Sellers dominated the early session, pushing the stock into a clear downtrend that began breaking the $1210.85 short-term support around 14:00 UTC. This confirmed the bearish pressure, dragging prices lower through the $1200 psychological mark. RSI slipped into the oversold region by mid-session, indicating exhaustion, while MACD had already shifted into a death cross around 13:45 UTC. Though a golden cross briefly formed by 14:18 UTC, bearish momentum stayed intact. The price dropped to a low of $1180.65 by 15:33 UTC. That level acted as a strong support, prompting a temporary pullback to around $1193.93 before entering a sideways zone.

From 15:37 UTC onward, the stock began recovering gradually off its new support range near $1185.40. RSI climbed out of oversold territory and slowly trended toward neutral levels, while MACD flipped bullish again with a golden cross during this phase. Price mostly hovered in a consolidation zone between $1185.40 and $1193.93 until about 17:50 UTC, where bulls started to gain traction. Volume appeared modest but consistent, and price began climbing toward the $1200 resistance. A bullish uptrend formed heading into the late session, showing sustained buying interest and repeated higher lows that added confidence to the NFLX recovery setup.
NFLX Breakout Clears $1200, Buyers Regain Control
Around 18:56 UTC, NFLX broke out cleanly above the $1200 short-term resistance. This rally reached a high of $1204.50 by 19:05 UTC, marking a strong reversal from earlier lows. MACD showed a final golden cross at 17:30 UTC, and despite a minor death cross at 19:09 UTC, momentum stayed relatively strong. RSI climbed near overbought territory just before the breakout, signaling heightened buying pressure but also suggesting the move could face resistance above. From 19:05 UTC onward, the price hovered tightly around $1202–$1204, showing consolidation rather than immediate follow-through.
The NFLX price behavior reflects a transition from bullish acceleration to short-term stabilization, especially as traders evaluated whether the breakout can sustain above $1200. By the closing bell, NFLX price held firm at $1202.90, up from the $1180.65 low earlier in the day. The ability to maintain levels above $1200 despite late-session pullback attempts gives bulls a psychological advantage heading into the next session. MACD momentum, while cooling, hasn’t yet flipped fully bearish, and RSI remains near neutral after pulling back slightly from earlier highs.
Buyers Reclaim Ground as NFLX Eyes $1210 Retest
Netflix stock closed June 10 at $1202.90, regaining ground after a sharp early drop. The NFLX recovery shows fresh bullish momentum, with the stock now eyeing a possible retest of the $1210.85 short-term resistance. A continued hold above $1200 strengthens that case. Support remains firm near $1185.40, which caught the earlier fall and led to a reversal. RSI is currently stable near the mid-50s, suggesting balanced pressure but room to climb. MACD is in a weakening golden cross zone, indicating that while the bullish push has slowed, sellers haven’t fully regained control either. If bulls can push through $1210.85, the next upside target would be near the $1220 level. Overall momentum leans cautiously bullish, as long as $1200 holds in early trade tomorrow.