

The OKB Price has displayed stability within its boundaries throughout the last 24-hour period. Recent OKB trading formed several intraday patterns within a narrow price range. The OKB coin rose after a rebound from $51.65 support before developing an upward trend channel, which received backing from MACD Golden Crosses. The OKB Breakout momentarily drove the price upward, but sellers eventually entered the market to drive the price down to $52.40. The negative price reversal emerged because a Death Cross signaling mechanism and RSI levels declining beneath $30 emerged.
The price found strong support, which enabled a recovery and the establishment of a fresh support and resistance area. A second temporary price increase happened as the market showed insufficient strength to sustain the upward trend. The price area remained stagnant from $51.65 to $52.20. Different indicators, such as MACD and RSI, displayed inconsistent signals because of market indecision.
OKB Price Analysis of the Last 24 Hours
The market dropped to $51.65 before it began an upward trend, which formed a channel yesterday. The price increase was supported by two MACD Golden Cross signals during 03:00 UTC and 06:00 UTC. The RSI entered an overbought position two times, which indicated intense bullish movement. OKB Coin stretched its growth until a $52.40 price barrier stopped its advance before it could surpass that level.

Chart 1- OKB/USDT M5 Chart, Analysed By Anushri Varshney, Published on TradingView, April 29, 2025
OKB Price started a bearish movement when its upward channel resonated into downward pressure. The reversal became undeniable when the MACD Death Cross formed at 11:30 UTC. OKB Price suffered a fast decline, yet stopped at the $51.65 support level. At 18:00 UTC, the RSI measurement fell to 30 or less, demonstrating price oversupply conditions. Favorable market conditions allowed a brief upward move of OKB at 19:00 UTC as MACD produced another Golden Cross. RSI returned above the 30 value, demonstrating an optimistic market trend.
The price movement occurred within a boundary between $51.65 and $52.20. During this sideways move in price levels, more Golden and Death crosses appeared in the MACD. OKB Coin is currently respecting defined trading bounds that intersect at the $52.20 resistance and $51.65 support levels. The resistance level has been rejected multiple times, demonstrating that investors prefer to sell their assets. The present support at $51.65 effectively preserves the evaluated trading range.
OKB Stuck Between $52.5 and $51.6
OKB Coin started sideways, but at 02:10 UTC fell following a MACD Death Cross. The OKB Price remained weak as RSI was closer to becoming oversold. In the downside breakout scenario, OKB will sink further to $51 support, while in the case of OKB Breakout failure, the coin might rebound up to $52.5 resistance. The MACD is bearish primarily throughout the session. RSI remains below 50, which indicates weak momentum. A strong move above $53 will be needed for OKB to turn bullish in the price action movement.
OKB Coiled for Breakout Move?
The OKB price consolidates between strong support at $51.6 and resistance near $52.5. The MACD has shown weak momentum with a mix of Golden and Death Crosses, which reflects indecision. The RSI remains around neutral territory and shows no clear bullish or bearish strength. The price consolidates within a tight range, suggesting a potential breakout setup. A breakout above $53 will trigger higher moves toward $53, possibly even more.
Conversely, a breakdown below $51.6 will extend the decline to the lower support zone. For now, Coin will probably be stuck in a sideways trend. Traders should wait for confirmation before initiating any trades. The OKB breakout setups and RSI signals will help spot early momentum sparks. For OKB’s future, a confirmed breakout will be considered key; the price action over the coming sessions will dictate the next big one.
OKB Price Analysis of May 1, 2025
During yesterday’s trading session, OKB moved within a narrow horizontal range, holding support at $50.80 while facing strong resistance at $51.80. The market stayed within this narrow range for most of the day, reflecting a mix of consolidation and trader uncertainty. The price tested the resistance area numerous times but failed to overcome it without strong momentum. Weak market momentum turned into an oversold condition at 01:45 UTC when the RSI shifted under 30. A positive momentum shift became evident when the MACD cross signal occurred above the signal line, yielding a MACD Golden crossover at 02:15 UTC.
The second Golden Cross formed at 06:05 UTC, adding evidence to support short-term buying opportunities. OKB prices continued consolidating within its established $50.80–$51.80 range, awaiting a decisive breakout. At 09:05 UTC, a third MACD Golden Cross appeared, signaling renewed buying interest and a potential shift in momentum. A temporary OKB Breakout took place at 13:30 UTC, causing the price to rise above $51.60. Several bullish candlesticks appeared, suggesting a brief shift in market sentiment. The MACD Death Cross emerged at 18:25 UTC, supporting weak bullish market conditions.
Strong OKB Support Holds as MACD and RSI Provide Signals
During the last trading hours, RSI entered the overbought zone at 13:10 UTC, suggesting the rally may have peaked and a pullback was likely to appear. Soon after that, another MACD signaled a Death Cross that verified the weak trend. Price retraced but remained above the zone of $51.20 without making another try for support at $50.80. This showed that buyers were still active, although strong bullish momentum was lacking.

Chart 2- OKB/USDT M5 Chart, Analysed By Anushri Varshney, Published on TradingView, May 1, 2025
Moreover, the OKB Coin traded in a well-defined horizontal channel through April 30, 2025, taking key levels at $50.80 and $51.80 as resistance points. The multiple crossovers on MACD and RSI showcased extreme volatility during the trading session. OKB Price will most likely remain range-bound with short-lived intraday volatility until some clear breakout occurs, whether above the resistance level or below the support level.
OKB Stalls Below $51.80 as MACD and RSI Indicate Weak Momentum
Today, the OKB price action moved in a narrow range below a support level of $50.80 and a resistance level of $51.80. The OKB Coin shows that the two significant golden crosses noted in the MACD indicate short-term bullish momentum. Besides, both attempts to break resistance were recorded failures and led to the formation of the Death Cross at around 21:00 UTC. Furthermore, the RSI briefly entered overbought territory at 02:35 UTC, indicating selling pressure other than some minor volatility; there appears to be no sustained OKB breakout above the resistance. MACD readings suggest bearish momentum, with multiple crossover signals appearing throughout the trading session. OKB Coin still ranges between $50.80 and $51.80, waiting for a strong confirmation of a breakout in either direction.
OKB Coin Awaits Clear Breakout as Indicators Flatten
A breakout above $51.80 with increased volume could pave the way toward $53.00, while a breakdown below $50.80 may trigger a retest of $49.50. Today, price action was confined, lacking any strong directional moves. Earlier MACD Golden Crosses hinted at a potential bullish reversal, but resistance at $51.80 held firm, preventing further breakout. The follow-up Death Crosses signaled the loss of bullish momentum. The coin will likely continue sideways without a more substantial volume or a confirmed breakout. Traders should wait for more apparent confirmation before making directional moves. Meanwhile, the coin may be moving sideways in a narrow zone for some time. A breakout from either side of this range will determine the next directional move for OKB Price.
OKB Price Analysis of May 9, 2025
The OKB Price trend over the last 24 hours shows slow progress followed by a sharp OKB breakout past short-term resistance. The price action remained controlled during yesterday’s trading session before buyers stepped in and pushed OKB Coin toward the $55.59 resistance. OKB opened the day near $51.60 and began climbing slowly inside a defined upward channel. Between 01:00 and 09:00 UTC, the prices moved steadily from $51.80 to $53.00. Momentum remained stable as MACD showed alternating golden and death crosses. RSI hit overbought levels twice; first around 05:00 UTC and again by 09:30 UTC, but the price continued holding the upper trend. The upward channel was respected throughout this period, confirming a bullish move.

Chart 3- OKB/USDT M5 Chart, Analysed By Anushri Varshney, Published on TradingView, May 9, 2025
From 10:00 to 18:00 UTC, OKB entered a sideways consolidation phase. Price hovered inside a tight range between $52.80 and $53.30, forming a new trading range just above the channel. MACD showed multiple death crosses, indicating a loss of momentum, but no major downside pressure followed. The support at $52.80 held consistently.
Strong OKB Surge Faces Resistance at $55.59
The breakout appeared around 18:50 UTC. The price surged above the range with a strong bullish candle, backed by a MACD golden cross and rising volume. The OKB Breakout pushed the price from $53.30 straight up to $54.70 in less than an hour. RSI spiked into overbought territory near 70, confirming momentum strength. From 20:00 to 23:00 UTC, the rally extended further. OKB reached a high of $55.55, just below the defined resistance level of $55.59. This level acted as a barrier, and some short-term selling was observed. In the final hour, from 23:00 UTC, OKB Coin retraced toward $54.50. The pullback remained above the $53.30 breakout zone, which has now flipped to support while indicators are still bullish.
OKB Price Stabilizes After Breakout Today
The OKB Price today is showing signs of consolidation after yesterday’s strong breakout. Price reached a high of $55.55 before pulling back slightly to $54.50, where it is currently holding above former resistance. The breakout level at $53.30 has now turned into a short-term support zone. Technical indicators remain neutral, but the trend still favors the bulls. OKB will need to hold above $54.00 to maintain momentum. A clear push above $55.59 resistance could trigger fresh upside. If rejected, price may retest $52.80. So far, the trend remains favorable with strong support and steady buyer interest.
OKB Price Holds Gains as Momentum Cools Above Support
The OKB Coin is holding its ground after a strong OKB Breakout, with price consolidating above $54.00. Yesterday, the rally pushed the OKB Price out of a narrow trading range and above the $55.00 resistance. Although the price briefly hit $55.55 before pulling back, it still trades well above the previous channel highs. MACD remains positive, but histograms are shrinking, suggesting fading momentum. RSI has corrected from overbought levels and now hovers near 56, indicating the uptrend is cooling but not reversing. The breakout zone near $53.30 has turned into a strong support base, and buyers continue to step in near that level. As long as the price stays above $54.00, bulls maintain control. However, failure to reclaim $55.59 may signal short-term weakness. Overall, the trend remains constructive, but OKB must hold above key support zones and reclaim resistance to keep the breakout structure intact.
OKB Price Analysis For May 13, 2025
The OKB price analysis over the last 24 hours shows a mixed session where the price bounced between support and resistance, reacting sharply to technical signals like overbought RSI and MACD shifts. OKB coin opened the day inside a downward channel, gradually slipping toward the $54.00 mark during the early morning hours. Around 05:00 UTC, OKB attempted a breakout from this falling structure. This breakout was followed by a MACD golden cross and a quick spike in price that pushed the price toward the resistance zone at $56.80. By 07:00 UTC, the RSI touched overbought levels, signaling that buyers were overextended. But the rally quickly lost momentum, and the price reversed near $56.80, confirming it as strong resistance.

Chart 4- OKB/USDT M5 Chart, Analysed By Anushri Varshney, Published on TradingView, May 13, 2025
Between 08:00 and 12:00 UTC, OKB hovered below resistance with weak volume, failing to attract enough buyers to push higher. The MACD showed a death cross, signaling weakness. By 13:30 UTC, selling picked up, dragging the price down to the $53.00 support, where buyers once again stepped in. The RSI had dipped into oversold territory near this support level, and between 14:00 and 16:00 UTC, OKB bounced, forming a minimal uptrend. The bounce looked promising but lacked strength, and the price stalled just under $54.50. The MACD showed another death cross, confirming buyers couldn’t sustain momentum.
From 17:00 to 21:00 UTC, OKB re-entered a downward channel, trending lower once again. The pair tested the $52.00 level multiple times. By the end of the session, around 23:00 UTC, OKB Coin showed signs of strength. The RSI climbed above 50, and a MACD golden cross formed, hinting at a short-term reversal. The price climbed back near $53.90, closing the session with a mild uptrend.
OKB Price Holds Steady Above $53.50 After Rebound From Support
The OKB price analysis for today shows the coin trading steadily above $53.50 after bouncing from the key support level at $53.00. After starting the day with mild pressure, OKB coin regained momentum following an oversold RSI signal and a golden cross on the MACD. The price moved into a slow uptrend and reclaimed $54.00. However, it soon faced slight resistance. Momentum remains neutral for now. RSI hovers near 54, and MACD shows weak signals. An OKB breakout above $54.50 could trigger a move toward $56.80, while a drop below $52.60 would shift sentiment bearish. Traders are watching for the next clear signal.
OKB Price Awaits Clear Direction After Mixed Signals
The OKB coin is currently in a wait-and-watch phase, hovering just above the $53.50 mark after a recovery from the key $53.00 support. While the bounce brought temporary relief, the price hasn’t shown enough strength to trigger a solid OKB breakout. Both RSI and MACD indicators are sitting in neutral zones, indicating a lack of strong momentum from either bulls or bears. The OKB price is still caught between well-defined levels, i.e, $53.00 acting as a support and $56.90 as a resistance. Traders should stay alert for sudden volume spikes or breakout attempts, as these could signal the next big move. OKB price needs a clear direction, and the coming few sessions will likely decide the short-term trend.
OKB Price Analysis For May 17, 2025
The OKB price analysis over the last 24 hours shows an early attempt to rally above resistance, but bullish momentum faded quickly, leading to a steady drop inside a downward channel. Despite a brief OKB breakout above $53.80, the OKB coin couldn’t hold gains and ended up testing support near $52.80 again. Price action started the session with bullish energy as OKB pushed upward, breaking out of a tight range. This OKB breakout took price above the key resistance at $53.80 around 07:00 UTC. However, the move was short-lived. Sellers stepped in right after the breakout, causing a sharp rejection that pulled the price back below $54.00.
Between 08:00 and 14:00 UTC, the OKB price entered a consolidation phase. The price hovered between $53.20 and $53.60, with momentum fading. During this time, the RSI showed signs of cooling down after hitting overbought levels earlier. MACD also reflected a weakening trend with a death cross forming around mid-session, indicating early signs of bearish pressure.
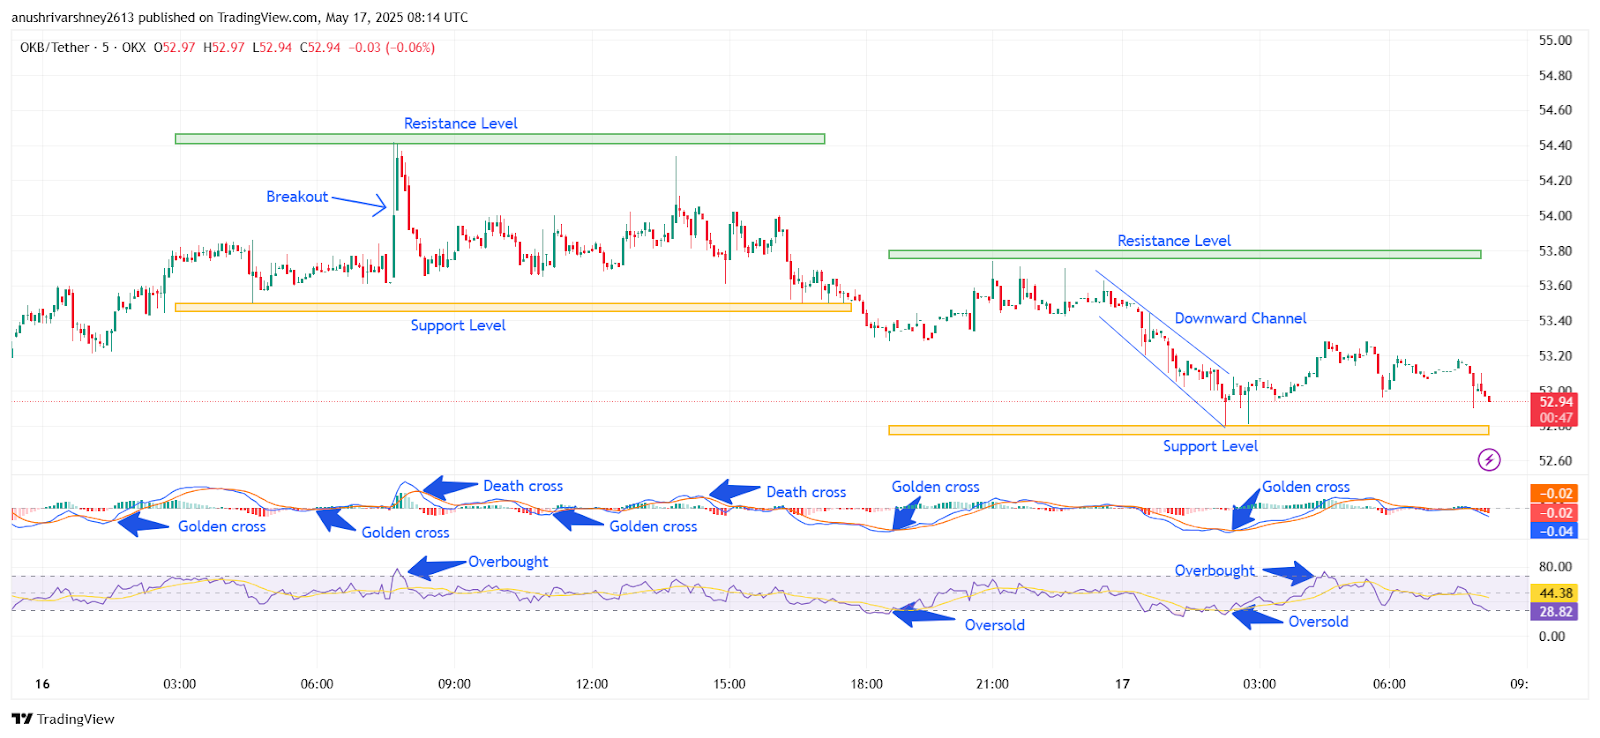
Chart 5- OKB/USDT M5 Chart, Analysed By Anushri Varshney, Published on TradingView, May 17, 2025
After 15:00 UTC, the downward momentum picked up. OKB started forming lower highs and lower lows inside a clean downward channel. The MACD printed another death cross, confirming the selling pressure. RSI dropped into oversold territory during this decline, showing the price had moved too fast to the downside. A brief golden cross appeared on the MACD around 21:00 UTC, which led to a small bounce, but it was quickly rejected below $53.40. By late evening, OKB was testing the key support level at $52.80 again. This level had previously acted as a strong base and managed to hold through the night, keeping the market from further downside.
OKB Price Holds $52.80 Support as Sellers Dominate After Failed Breakout
The OKB price analysis for today shows continued bearish pressure after the failed OKB breakout above $53.80 yesterday. Price action remains trapped below resistance, with the OKB coin currently trading near $52.94. A downward channel structure continues to dominate, while the RSI stays below 50, showing weak momentum. MACD lines are flat, suggesting indecision and low volatility. Key support at $52.80 has been tested multiple times and is holding for now. If buyers lose this level, the OKB price may slide toward $52.50. For a bullish reversal, the price must reclaim $53.80 with strong volume. Until then, OKB coin sentiment remains cautious, with no clear signs of recovery.
OKB Faces Key Decision Zone Between Support and Resistance
The OKB coin is currently at a critical point, trading just above the $52.80 support level after failing to sustain a breakout above $53.80. This range has defined price behavior today, reflecting the indecision in the market. There was a small breakout attempt in the OKB, but the price was almost immediately rejected, which is a signal that selling pressure is strong at resistance. The RSI is still low, and while the MACD is not confirming the bullish crossover, it is because momentum is downward. If the bulls manage to hold the $52.80 support and push the price above $53.80 with strong volume, we could see a fresh breakout. Traders should expect a breakdown below $52.80 or reclaim $53.80 before confirming which direction we are headed.
OKB Price Analysis For May 20, 2025
The OKB price analysis over the last 24 hours shows a clear shift from bearish momentum to consolidation, as the OKB token moved through distinct phases of trend reversal before stabilizing above key support. The price traded inside a downward channel, forming lower highs and lower lows. By 06:00 UTC, the OKB token gradually declined from around $52.80 to a low near $50.20, where selling pressure finally slowed. RSI dropped below 30, flashing an oversold signal, while the MACD formed a golden cross, hinting that momentum could soon flip.
Around 07:00 UTC, bulls began stepping in. A shift in price structure broke the downward channel, and OKB entered an upward channel formation. From 07:00 to 15:00 UTC, the token climbed steadily from $50.50 to around $52.80, marking a clear uptrend. The MACD posted another golden cross, confirming the change in momentum, while RSI crossed the 70 mark, briefly pushing into overbought territory by 14:00 UTC.

Chart 6- OKB/USDT M5 Chart, Analysed By Anushri Varshney, Published on TradingView, May 20, 2025
From 15:00 UTC onward, the price began to lose strength. The token moved between $51.90 and $53.00, rejecting any clear breakout. During this range-bound move, MACD printed alternating death crosses and golden crosses, showing mixed signals. By the end of the trading session, the OKB price was moving around $52.19, comfortably above short-term support at $51.90. The OKB network is steady after the bounce, but buyers remain cautious, and bulls are yet to reclaim full control.
OKB Price Fails to Break $53.00, Holds Firm Above $51.90
Today, the OKB price remains in a tight trading range between $51.90 and $53.00, showing signs of indecision after yesterday’s uptrend. Early sessions showed a slight push towards $52.80, but momentum faded as the RSI hovered near 50, indicating neutral strength. The MACD remains flat, with recent crossovers failing to spark a strong move. Buyers are holding short-term support at $51.90, while $53.00 continues to act as a key resistance level. The OKB token needs a clean breakout above this level to resume bullish momentum. For now, the OKB network looks stable, but volume remains low, keeping price action muted as traders wait for a directional cue.
OKB Future Remains Neutral as Market Awaits Clear Direction
The present implication of the OKB token indicates a situation in the market where neither the bulls nor the bears seem to be completely in control. After bouncing back from the recent lows, we are now seeing sideways movement happening in the price within a decent range; it seems as though traders are being cautious and taking a wait-and-see approach. A breakout above $53.00, of course, would continue the bull move, while a drop below $51.90 would likely prompt more legitimate selling pressure. For now, the OKB network is flat, and as traders, we will want to keep an eye on volume and breakout levels to indicate a follow-through move. Patience is key in such setups, especially when the market indicates signs of consolidation rather than commitment.
OKB Price Analysis For May 24, 2025
The OKB price analysis today shows a mixed session with multiple breakout attempts, range-bound action, and a recovery from oversold levels. The OKB token started the day inside a downward channel in the early hours of the day, trading lower toward $52.05 as sellers briefly took control. The MACD formed a golden cross near 00:30 UTC, signaling early bullish strength, which was followed by a breakout around 01:00 UTC. This breakout led to a quick uptrend that pushed the OKB price close to $52.25.
Between 01:00 and 01:45 UTC, the OKB network showed bullish momentum, but a death cross on the MACD around 01:45 flipped the trend. The price then retraced, forming a lower low near $52.05. At this point, another breakout was observed, followed by a trading range from 02:00 to 03:30 UTC. During this range, the RSI hovered in the neutral zone, and the MACD printed alternating golden and death crosses, reflecting indecision.
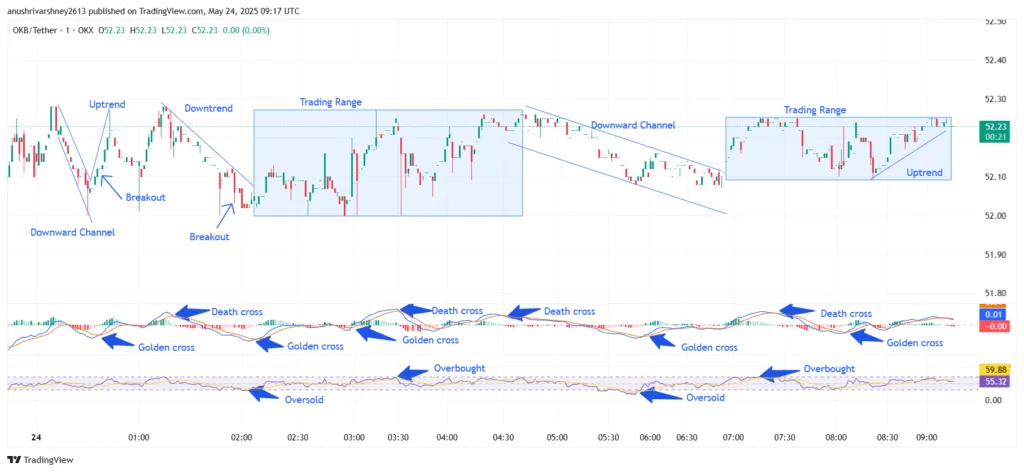
Chart 7- OKB/USDT M1 Chart, Analysed By Anushri Varshney, Published on TradingView, May 24, 2025
Around 03:45 UTC, the OKB price touched $52.28 but failed to break higher. This rejection pushed the token back into a downward channel, starting a slow bearish trend. The MACD confirmed the downtrend with a death cross at 04:15 UTC, while the RSI began dipping toward the oversold zone. By 06:00 UTC, OKB entered oversold territory, signaling a potential bounce.
OKB Price Holds $52.23 Range, Eyes Breakout Above $52.30
From 06:30 UTC onward, the OKB token started to recover. A golden cross formed on the MACD near 06:45 UTC, and the RSI climbed out of the oversold region. This bounce led to a new consolidation phase inside a tight trading range between $52.10 and $52.28. The OKB network price action remained steady throughout this period, forming a short-term uptrend support line visible from 08:00 UTC.
As of now, the OKB price is holding around $52.23 with mild bullish pressure. The MACD printed another golden cross near 08:30 UTC, while RSI is nearing 60 but not yet in the overbought zone. This setup suggests buyers are regaining control, but a confirmed breakout above $52.30 is needed to push further.
OKB Token Builds Momentum, Breakout in Focus
The OKB token has shown steady signs of recovery after dipping into oversold conditions earlier in the day. Following the golden cross and RSI rebound from oversold levels, the OKB price stabilized within a tight range between $52.10 and $52.28. The MACD is now tilting bullish again, and the RSI hovering near 60 suggests that the buying interest is gradually building. As of now, the OKB price is holding above $52.20, indicating underlying strength in the OKB network. A clean breakout above the $52.30 resistance level could confirm a bullish continuation and open doors to new short-term highs. However, failure to clear that barrier may keep the token in consolidation. Traders should watch for volume spikes and MACD strength as potential signals. Overall, the OKB token is well-positioned for a potential upside move if momentum continues to support the current trend.
OKB Price Analysis For June 1, 2025
The OKB price analysis shows clear trends and range-bound movement, with buyers stepping in at key RSI zones but failing to sustain a breakout. Price opened near $50.05 and stayed flat until 00:30 UTC. Shortly after, OKB Token entered a steep downtrend, dropping from $50.30 to $49.85 by 01:15 UTC. This move formed a downward channel and was supported by a bearish MACD and RSI dipping into oversold territory near 28.
Around 01:30 UTC, OKB’s price stabilized and began consolidating. From 01:30 to 03:00 UTC, the price moved sideways between $49.90 and $50.10. A MACD golden cross formed just after 02:00 UTC, signaling early signs of recovery. This was followed by an uptrend at 03:15 UTC, pushing the price to $50.20 by 03:45 UTC. The bounce aligned with an RSI rebound above 40 and a second golden cross, giving short-term bulls some control.
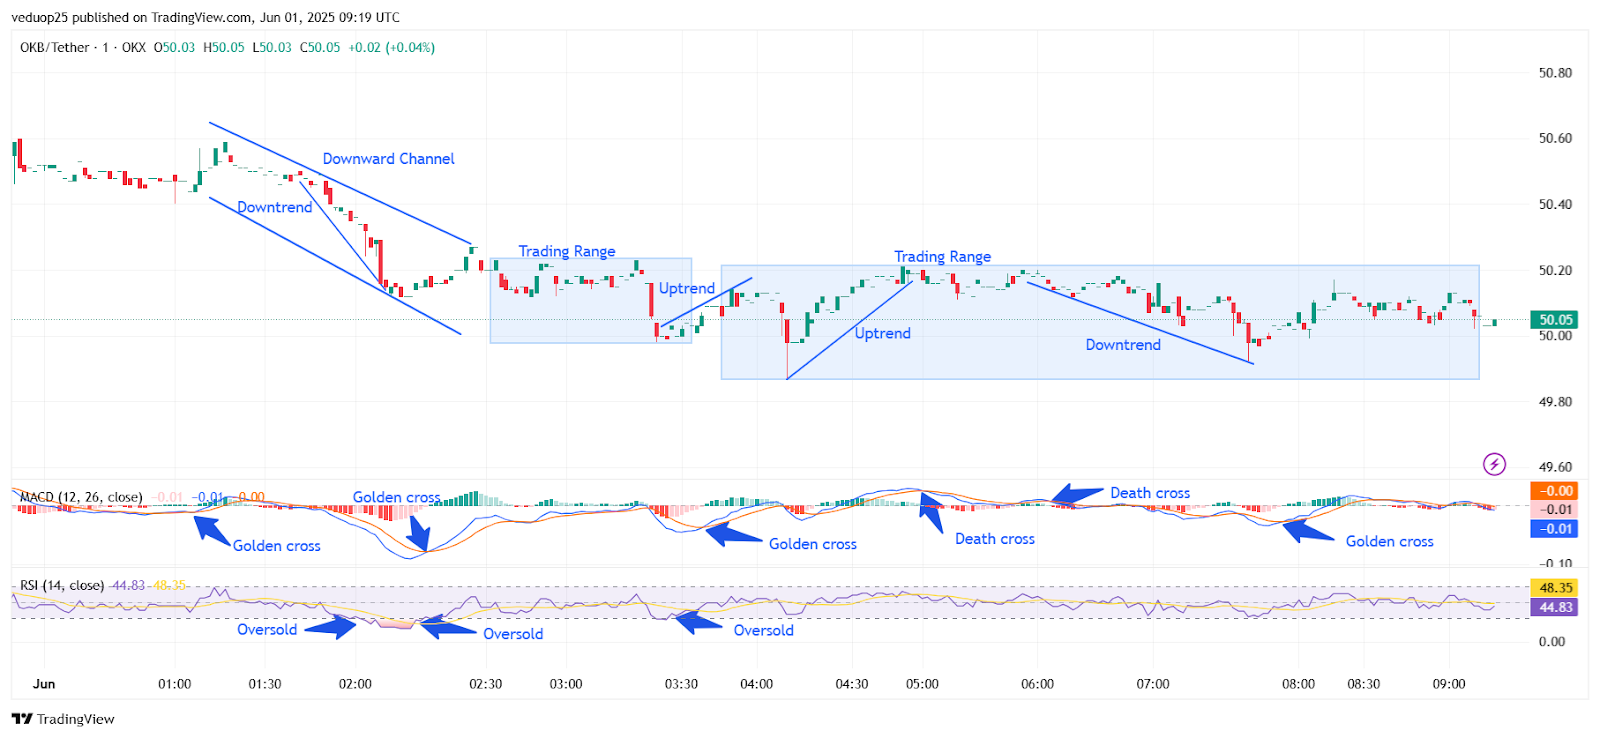
Chart 8- OKB/USDT M1 Chart, Analysed By Anushri Varshney, Published on TradingView, June 1, 2025
Between 04:00 and 05:30 UTC, OKB Network saw price action shift into another range. Despite two brief uptrends during this period, buyers lacked the volume to push further. The RSI hovered between 45 and 50, while the MACD printed flat signals. At 05:45 UTC, a new death cross appeared, leading to a fresh downtrend that lasted until 07:00 UTC. During this move, OKB slipped from $50.18 to $49.95. However, RSI stayed above 35, avoiding oversold conditions.
OKB Price Holds Between $49.90 and $50.25 as Breakout Stalls
From 07:15 UTC onward, the OKB price traded in a tight range between $49.95 and $50.20. A final golden cross near 08:15 UTC hinted at a possible breakout, but the move lacked strength. Price barely reacted, holding steady near the midrange. The RSI floated around 45 while the MACD stayed close to neutral.
For now, the OKB price needs a clean break above $50.25 to trigger any real upside. On the downside, losing $49.90 could bring more selling. Until then, the token may continue to trade sideways in a tight zone as traders wait for a clearer setup.
OKB Token Maintains Sideways Structure Amid Shifting Momentum
OKB Token reflects a balanced mix of trend moves and sideways phases, with no clear breakout. Key indicators like MACD and RSI played an important role throughout the session, with golden crosses and oversold signals triggering temporary price recoveries. However, these signals failed to generate strong follow-through, keeping the OKB price locked within a narrow range. Downtrends were met with quick support, while uptrends lost steam near resistance levels.
The OKB Network maintained stability around the $50 mark but showed hesitation during every bullish attempt. This suggests that while buyers are present, confidence remains limited without stronger momentum. As long as the price continues to bounce between support and resistance, traders should focus on key indicator shifts for early signals. A decisive move above resistance or a breakdown below support will be needed to confirm the next major direction for OKB.


