

Are you considering investing in Optimism token ‘OP’ and looking for a clear, data-driven perspective on its price action? This in-depth OP price analysis will give you the insights you need, covering recent trends, key support and resistance levels, and the overall market momentum. We’ll explore the technical indicators like RSI and MACD, providing a thorough breakdown of OP’s recent price movements to help you make an informed decision. Keep reading to see what’s shaping OP’s price outlook.
OP Coin Price Analysis of May 3rd, 2025
The OP price action over the last 24 hours shows a consistent bearish structure shaped by successive downtrend channels. Between 13:00 UTC and 16:00 UTC on May 2, OP oscillated downward from $0.714 to $0.702, forming a tight descending pattern. Short-term relief rallies failed near $0.708, indicating weak buyer momentum. RSI fell below 30 during this window, flashing early oversold conditions. MACD also formed a bearish crossover, and histogram bars widened in the negative territory, confirming downside bias. Despite several micro-pullbacks, pressure remained skewed to the downside as candles closed near their lows.
Chart 1- Analyzed by Alokkp0608, published on May 3rd, 2025.

From 16:00 UTC to 19:00 UTC, OP price dropped more sharply, plunging to $0.695 after repeated failures to break $0.705. This move confirmed the presence of strong sellers clustered near $0.707. The price continued hugging the lower channel boundary, and another RSI dip into the oversold zone occurred. MACD lines spread further, with no sign of convergence, showing strengthening bearish momentum. Though Optimism price briefly attempted to bounce off the $0.695 support zone around 19:30 UTC, the rebound lacked volume and commitment. The presence of long upper wicks during minor rallies reinforced persistent rejection pressure at intermediate levels like $0.700.
Consolidation and Bearish Breakdown
Between 19:00 UTC and 22:00 UTC, OP attempted a base-building phase above the $0.695 support. However, rather than a breakout, it entered a sideways structure capped below $0.704. The MACD printed a brief golden cross during this range but with minimal follow-through. RSI rebounded into the neutral band, but momentum remained flat. In the 22:00 UTC to 01:00 UTC interval, bulls showed a temporary push above $0.705, with RSI peaking over 70, indicating a short-lived overbought condition. Yet, this was quickly reversed as price action rolled over by 01:00 UTC, suggesting the upside was driven more by exhaustion than strength.
Between 01:00 UTC and 04:00 UTC, OP price gradually gave up prior gains and returned toward $0.695. A fresh descending channel emerged, with price candles steadily tilting lower. RSI again trended below 30 twice in this stretch, and MACD produced a fresh death cross near 03:00 UTC. Selling pressure was steady, not sharp, hinting at orderly distribution rather than panic. Attempts to retest $0.700 were repeatedly rejected, and no clear bullish divergence formed on either MACD or RSI, weakening the case for immediate reversal.
Breakdown Deepens as Support Fails
The Optimism price action from 04:00 UTC onward into the chart’s close reveals intensified selling. After hovering near $0.695 for several hours, OP collapsed below this key support at around 10:25 UTC. The fall was sharp and clean, sending price down to $0.679 by 11:54 UTC. This breach of $0.695 now establishes it as fresh resistance. MACD momentum turned decisively bearish again, with a death cross confirming the breakdown. RSI plunged to 18.5, entering deep oversold territory without any reversal divergence. The breakdown was accompanied by strong red candles and minimal lower wicks, showing little buyer intervention.
Bearish Continuation Threatens Key Support Zone
OP is clearly trending within a multi-phase downtrend, reinforced by repeated failures to hold above $0.705 and now losing $0.695. The prevailing momentum is strongly bearish, with RSI sitting in deep oversold levels and MACD printing a clean death cross without signs of bullish reversal. If current pressure persists, the next significant downside target lies near $0.662, which aligns with late April demand. A temporary relief bounce could occur toward $0.695, but unless OP reclaims $0.705 with strong volume, upside OP recovery will likely remain capped. Traders should monitor for divergence or a sharp MACD turn for any reversal cues. The covered window ends with OP at $0.679, in a vulnerable state.
Optimism(OP) Price Analysis of May 7th, 2025
The OP price action over the last 24 hours shows a highly reactive market with alternating directional moves. The session began within a downtrend channel, where selling pressure continued from earlier weakness and pulled the price down to $0.612 by 10:45 UTC. From there, Optimism price entered a sideways path between $0.608 and $0.620, indicating short-term indecision. The RSI dipped near oversold territory twice in this stretch, while MACD remained relatively flat, suggesting no strong trend bias. Buyers lacked conviction early on, and momentum stayed fragile as price hovered below the $0.620 mark.

Chart 2- OP/USDT M5 Chart, Analyzed by Alokkp0608, published on May 7th, 2025.
By 13:55 UTC, OP price attempted an aggressive breakout toward the key resistance around $0.630. Although the price briefly reached $0.626, it failed to hold ground and reversed sharply by 14:20 UTC. This rejection reinforced the selling zone near $0.630. From this point, OP re-entered a descending channel, breaking below the earlier trading range. The MACD formed a clear bearish crossover (death cross) during this decline, while the RSI again touched oversold conditions. By 21:30 UTC, the price bottomed out at the critical support near $0.590, making this the third retest of this level in recent days.
Temporary Strength Fades After Resistance Rejection
Following the sharp touch of the support level at $0.590, OP price reversed into a notable upward channel, suggesting short-term strength. Between 21:30 and 01:30 UTC, the price rebounded confidently, breaking through $0.610 and eventually testing $0.633, just above the prior resistance band. However, this upward breakout proved short-lived. MACD showed a bullish golden cross during this stretch, and RSI briefly moved into overbought territory near the peak. The strong rejection from $0.633 highlights seller dominance near upper resistance, turning that zone into a firm ceiling once more.
As the price dropped back below $0.620 by 01:30 UTC, Optimism price shifted into another descending channel. From 01:30 to 06:00 UTC, the coin steadily declined toward $0.600. Despite occasional bounce attempts near $0.608, the OP bearish trend dominated. Multiple death crosses appeared on MACD, while RSI hovered in the lower mid-zone without showing strong reversal signals. Sellers consistently sold into rallies, and the coin failed to reclaim key territory above $0.610. The structure now mirrors prior breakdown patterns, where rallies are being sold and support levels face constant pressure.
Bearish Pressure Intensifies Near Support Floor
In the most recent stretch up to 09:00 UTC, OP price showed continued weakness near $0.600 with bears pressing the lower edge of support again. Despite a short-lived push at 03:20 UTC, the price couldn’t sustain momentum and drifted lower, staying above, but uncomfortably close to, the critical $0.590 support. MACD remains neutral to bearish, lacking clear crossover signals, while RSI sits below 45, suggesting weakening bullish intent. This ongoing grind along the support area increases the risk of a breakdown if buying interest does not return soon.
Support Under Siege as Bulls Lose Momentum
Optimism price is now precariously positioned above $0.590, and if this key support fails, a move toward $0.580 could unfold quickly. Momentum remains weak with repeated MACD death crosses and RSI failing to reclaim the 50 line, which underlines the continued OP bearish trend. Resistance stands firm at $0.630–$0.633, while $0.600 is proving fragile. Until buyers can reclaim ground above $0.610 and flip momentum, OP risks entering a deeper decline. Short-term price direction leans bearish with increasing downside pressure, unless another strong bounce emerges off support in the next few hours.
Optimism (OP) Price Analysis of May 31st, 2025
The Optimism price action today shows an initial bearish breakdown toward the $0.602 support level before rebounding sharply. Price dropped from $0.615 at 00:02 UTC, forming a Lower Low (LL) near $0.602 by 00:19 UTC, then reversed on a Golden Cross at 00:23 UTC. A swift recovery followed as OP pushed back toward resistance at $0.615, tagging it by 00:40 UTC. However, rejection near that level confirmed it as a short-term ceiling. During this early stretch, RSI climbed from oversold territory, while MACD briefly held a bullish tone before turning neutral again near 02:00 UTC.
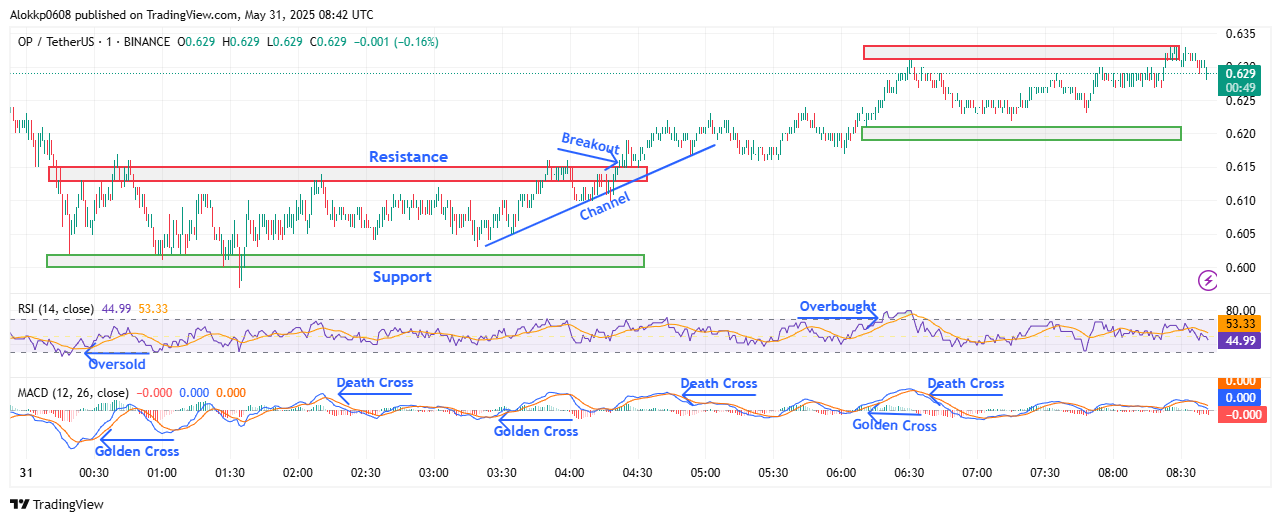
OP/USDT M-1 Chart, Analyzed by Alokkp0608, published on May 31st, 2025.
Between 01:00 UTC and 03:20 UTC, OP consolidated within a narrow horizontal band between $0.602 support and $0.615 resistance. Price structure during this phase formed a sequence of Higher Lows (HL) but failed to register any Higher Highs (HH), signaling hesitation. MACD printed a Death Cross at 02:13 UTC, validating the lack of OP breakout momentum, and RSI floated in the midrange, showing indecision. This range-bound activity set the stage for the breakout that followed shortly after, with a clear ascending pattern forming beneath the resistance line, a bullish sign of buildup.
OP Breakout Rally and Rejection at Local Top
From 03:25 UTC to 04:21 UTC, OP price surged in an ascending channel and finally broke through the $0.615 resistance. The move was triggered by a Golden Cross on the MACD and confirmed as price established HHs above the prior ceiling. By 04:21 UTC, OP had flipped resistance into support, forming a new short-term support zone around $0.621. The trend remained bullish, even though MACD printed a brief Death Cross at 04:45 UTC — it acted more as a signal of slowing momentum than reversal. RSI stayed healthy, oscillating between 55 and 65, avoiding overbought extremes.
From 04:30 UTC to 06:31 UTC, the bullish momentum extended toward the newly established resistance zone near $0.631. Price reached a peak of $0.633 by 06:31 UTC but faced immediate rejection. This move formed another HH, but the MACD simultaneously posted a Death Cross at the same time, which marked a turning point. RSI also dipped from the overbought zone, hinting at exhaustion. The rejection led OP to pull back modestly and settle into a consolidation phase between $0.625 and $0.631, showing signs of short-term range development just below the high.
Rejection at Local High Sets Range Tone
The most recent price action from 06:30 UTC to 08:40 UTC shows OP price holding above $0.625 support but unable to reclaim the $0.631 resistance. The price formed equal highs just under the resistance, suggesting a short-term double-top setup. MACD showed mixed behavior, a Golden Cross at 06:05 UTC followed by a quick Death Cross at 06:32 UTC, supporting the fading momentum thesis. RSI softened, slipping back below 50, aligning with the lateral structure forming on the chart. Buyers are active on dips into $0.625, but the inability to break higher points leads to indecision and low conviction near current levels.
OP Fails to Reclaim High, Momentum Stalls Below Resistance
With the rally stalling under $0.631, Optimism price now shows signs of waning momentum and possible short-term range formation. The price is currently hovering near $0.629, consolidating between support at $0.625 and resistance at $0.631. A break below $0.625 could trigger a dip toward $0.621. However, reclaiming and holding above $0.631 could re-establish bullish momentum. MACD is leaning bearish after the last Death Cross, while RSI remains neutral near 45, suggesting limited buying pressure. For now, OP’s trend appears neutral with a downside bias unless bulls reclaim the recent high.


